UID/SOC/04011/2013 UID/AGR/04033/2013
OS DOCES TRADICIONAIS PORTUGUESES COMO IDENTIDADE CULTURAL E VALORIZAÇÃO GASTRONÓMICA: AVALIAÇÃO DA TEXTU
A NEW INSIGHT ON THE PORTUGUESE TRADITIONAL SWEETS AS CULTURAL IDENTITY: A SCIENTIFIC APPROACH TOWARDS EVALUATION OF TEXTURE IN
Raquel P. F. Guiné CI&DETS, Instituto Politécnico de Viseu / Dep. de Indústrias Alimentares, Escola Superior Agrária de Viseu raquelguine@esav.ipv.pt
RESUMO
A importância do património gastronómico de qualquer povo é inquestionável e Portugal é particularmente rico quando se trata de doces. Assim, o objetivo deste trabalho foi o de dar um contributo para a caracterização de um doce tradicional de Viseu "castanhas de ovos", através da avaliação da cor e da textura, devido à sua importância para a aceitação do consumidor. As amostras foram adquiridas numa pastelaria em Viseu e produzidas de acordo com a receita tradicional. A avaliação da cor foi feita por um colorímetro e a análise de textura por um texturómetro. Os resultados obtidos permitiram concluir que existem diferenças entre as áreas queimadas e não-queimada, assim como quando se comparam amostras com ou sem sulcos, em relação à cor e à textura. A área queimada apresenta-se mais escura, com um vermelho mais intenso e menos amarelo. Quanto à textura, as amostras sulcadas apresentam-se mais duras.
Palavras-chave: Doce tradicional, caracterização, castanhas de ovos, textura, cor.
ABSTRACT
The importance of the gastronomic heritage of any people is unquestionable and Portugal is particularly rich when it comes to sweets. Hence, the objective of this work was to give a contribution colour and texture, due to their importance for consumer acceptance. The samples were bought from a pastry in Viseu and produced according to the traditional recipe. Colour evaluation was made by a colorimeter and textural analysis by a texturometer. The results obtained allowed concluding that there were differences between the top burned area and the non-burned areas, as well as when comparing the ruffled with unruffled samples either regarding colour and also texture. The burned area was darker, with a more intense red and less yellow. As to texture, the ruffles samples were harder than the unruffled samples.
Keywords:
1. INTRODUCTION
According to the National Association of Municipalities and Producers for the Valuation and Qualification of Traditional Products (QUALIFICA), Portuguese Traditional Sweets includes the set of pastry, confectionery, and transformation of horticultural products whose ingredients, recipe, geographical origin (if alleged) and form of presentation are fixed in historical documentation or related to it namely in doctoral and master's theses and meritorious works recognized by referencing the historical sources - or, in its the absence, in family prescriptions and which, by their characteristics, reveal historical, ethnographic, social or technical interest, showing memory value, antiquity, authenticity, uniqueness or exemplarity (SOEIRO, 2014). Portuguese Traditional Sweets
deserts; j) candy and other confectionery products (SOEIRO, 2014).
Certain food products, because they differ from the others, started to be named after their place of origin or production, being this an integral part of its name, and making it unique, unequal and more appetizing for consumers. Recognizing the importance of such products, the EU developed some mechanisms, particularly, through Regulations (EC) 2081/92 and 2082/92, which were important milestones in the European Quality Policy as they presuppose the protection of designations of agricultural products and foodstuffs. So it was not only created the European System of Protection and Quality of Agricultural Products and Foodstuffs: Protected Designation of Origin (PDO) and Protected Geographical Indication (PGI), as was also established the European System of Appreciation of the Specificity of Certain Agricultural Products and Foodstuffs, taking into account the traditional way of production or the composition: the Traditional Specialty Guaranteed (TSG) (EC, 2004; VALES, 2014).
Although the diversity of Portuguese sweets is enormous, only a very limited number has been officially recognized by the European Commission as IGP:
1)
inside, with the particular flavour of the ingredients from the region around Chaves (Figure 1(a)). 2)
century, created by the Carmelite nuns of the Carmel of Tentúgal. It is known for its very fine and unique puff pastry (Figure 1(b)).
3) pical from the city of Aveiro, its filling is made from extremely fresh
egg yolks mixed exclusively with sugar at the right heating point, resulting in a very creamy texture (Figure 1(c)).
(a) (b) (c)
Still, the importance of all other Portuguese traditional sweets is unquestionable, being one of the main gastronomic attractions, conquering the many foreign people who visit Portugal, apart from
egg chestnuts) original from Viseu benefits from the convent influences that were greatly felt in Viseu, especially with the coming of the nuns of St. Benedict, from the Convent situated in Ferreira de Aves, to the Convent of the same Order installed within one of the entrances of the city. Its name derives from the shape resembling a chestnut, and the burned tonality of the surface also similar to the brown from the chestnut (Figure 3).
The objective of this work was to give a contribution for the characterization of the traditional sweet quality attributes of this convent sweet.
2. EXPERIMENTAL 2.1. Samples
The samples were bought from a pastry in Viseu (Confeitaria Amaral), having been produced according to the traditional recipe and made specifically for this work. They were made in the day they were bought to be analysed. The samples were as shown in Figure 4, ruffled and unruffled, being similar with just the exception of the pressing operation to produce the rigged surface.
(a) (b)
Figure 4: Samples for analysis: (a) unruffled; (b) ruffled. 2.2. Colour evaluation
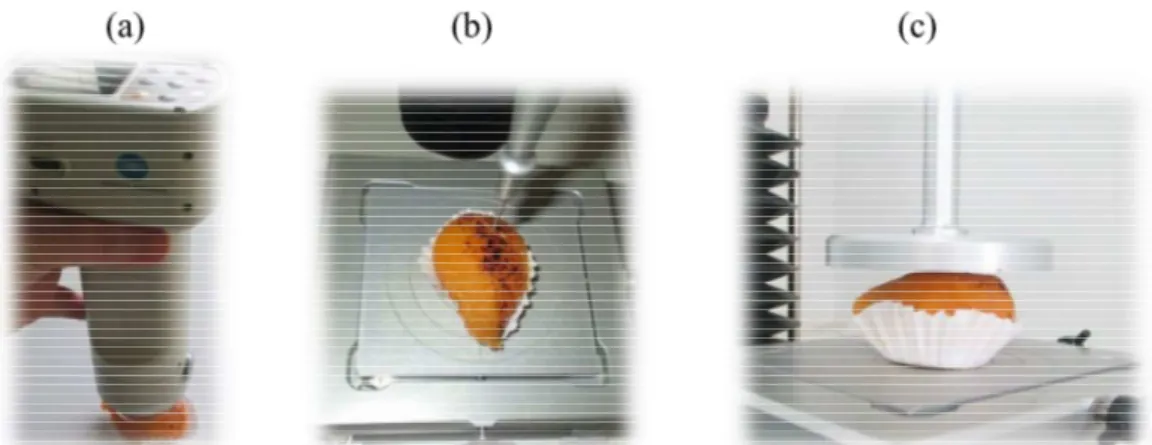
Color can be evaluated instrumentally using the CIELAB coordinate system defined by the Commission Internationale de L'éclairage - 1976. CIE L*, a* and b * were measured using a portable colorimeter Chroma Meter CR-400 from Konica Minolta. The L* coordinate expresses the lightness, ranging from 0 (black) to 100 (white), the coordinate a* goes from -60 (green) to +60 (red) and the coordinate b* varies from -60 (blue) to +60 (yellow) (BARROCA et al., 2013). For the evaluation of colour were made 6 measurements on the top burned of the sample plus 6 other measurements on the sides (unburned), and these were repeated on a different sample (Figure 5(a)).
2.3. Texture analysis
For the analysis of textural parameters was used a texturometer TA-XT2 (Stable Microsystems) and two types of test were performed: (1) Compression test and (2) Puncture test.
(1) Compression test: for this was used a compression probe 75 mm in diameter (P / 75) and the texture parameters obtained were: hardness, chewiness, adhesiveness, cohesiveness, springiness and resilience, described by GUINÉ et al. (2015). This test was done once in each sample, using different samples to repeat.
(2) Puncture test: to perform the test it was used a drilling rig 2 mm in diameter. The texture parameters analysed with this test were: crust firmness, flesh firmness, adhesiveness and stickiness, as described by GUINÉ et al. (2015). This test was repeated multiple times in each sample corresponding to punctures in different zones (4 in the burned zone and 4 in the unburned zone) for the unruffled samples and in the highs or in the grooves (4 each) in the case of the ruffled samples. Also different samples were evaluated.
(a) (b) (c)
Figure 5: (a) Evaluation of colour; (b) Evaluation of texture by the compression test and (c) Evaluation of texture by the Puncture test.
3. RESULTS AND DISCUSSION 3.1. Colour
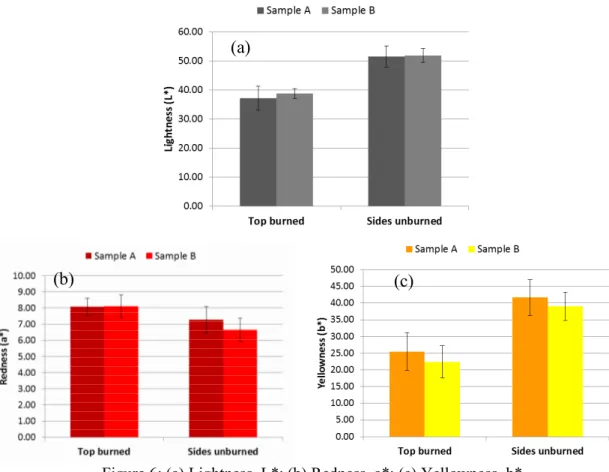
Figure 6 shows the colour coordinates of the sweets for different samples and for measurements made in different areas of the sample: top (burned) and sides (unburned). The values of lightness (L*) are under 40 for the top and about 50 for the sides, indicating that the top is darker than the sides (lower L*), which is due to the brown spots resulting from the burning with heat that constitutes an essential operation to produce the desired appearance of this traditional sweet.
Figure 6: (a) Lightness, L*; (b) Redness, a*; (c) Yellowness, b*.
The measurements in both samples indicate that they are very uniform in colour either between samples or within the same sample, given the relatively low values of the standard deviation (Figure 6). This is in a way unexpected because, due to the random disposition of the spots, one could expect greater variability in the measurement of the colour, particularly in the top, corresponding to the spotted area. Regarding the colour coordinate a*, because it corresponds to positive values it is indicative of a predominance of the red colour over green (for negative values). The intensity of the red coloration is stronger on the top, for both samples, as a result of the brownish colour of the spots, when compared to the sides, without spots. Finally, the coordinate b*, which represents intensity of yellow colour for positive values, and as expected, it is higher for the sides when compared to the top, because in the sides the yellow in dominant.
3.2. Texture compression test
Table 1 shows the results obtained for the textural parameters evaluated by the compression test, for the samples corresponding to the forms ruffled (with grooves) and unruffled as shown in Figure 4.
(a)
Table 1: Textural parameters evaluated by the compression test.
Sample Hardness (N) Adhesiveness (N.s) Resilience (%) Cohesiveness Springiness (%) Chewiness (N)
Ruffled 2.6±0.0 0.0±0.0 27.5±0.0 0.6±0.0 73.2±0.0 1.2±0.0
Unruffled 2.4±0.3 -0.3±0.2 21.5±1.0 0.5±0.0 69.2±5.8 0.9±0.2
The hardness is related to the force required by mastication that takes part during eating (GUINÉ and BARROCA, 2012). The results
when compared to the unruffled version (2.4 N), indicating that the grooves contribute for the hardness, since all the other conditions were similar: same mass and same burning process, differing just in the pressing to produce the grooves (Table 1). Still, it is worth mentioning that both values are very small, thus indicating that this is a very smooth food. Also chewiness, corresponding to the work needed to masticate the sample to a consistency suitable for swallowing, is higher for the ruffled version, being this a direct consequence of the higher hardness, given that hardness strongly contributes for the chewiness (CRUZ et al., 2015). Springiness is a measure of recovering height after releasing from the compression in mastication (GUINÉ and BARROCA, 2012), and is higher again for the ruffled sample (73.2% against 69.2% for the unruffled sample). Cohesiveness refers to the internal forces that keep the sample cohesive and measures the degree to which the sample deforms before rupturing (CRUZ et al., 2015). The value for cohesiveness is higher again for the ruffled sample (0.6) when compared to the unruffled sample (0.5). With regards to adhesiveness, which represents the force required to remove the material that adheres to a surface (GUINÉ et al., 2014), it was practically negligible in both samples, with values equal or very close to zero. Resilience is how well a product resists to regain its original position, representing an instant springiness, and like what was previously observed for springiness, is higher for the ruffled sample (27.5% as compared to 21.5%). These results show that the pressing operation to create the grooves in the ruffled version of the product has some influence on its texture.
3.3. Texture puncture test
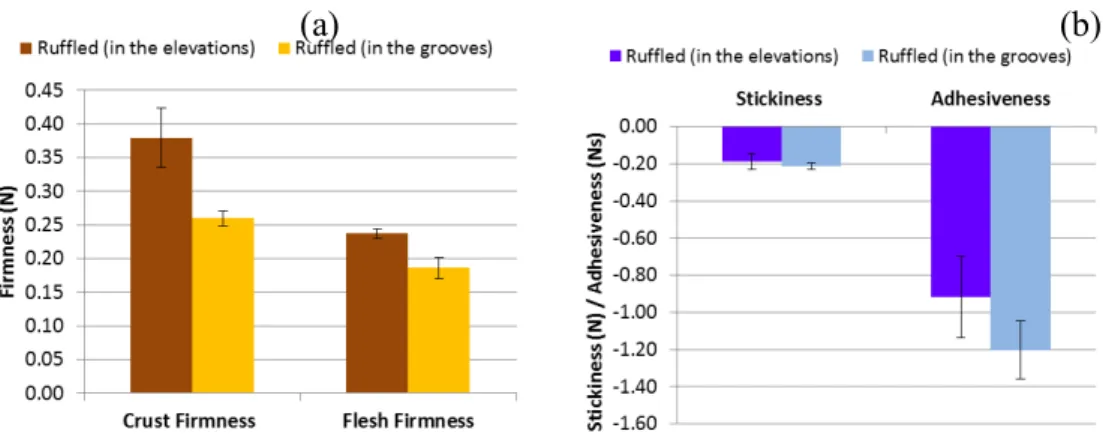
Figure 7 shows the textural parameters determined for the ruffled sample, considering the elevations and the depths separately, to verify if differences would occur. The results show that in fact those differences exist, particularly for crust firmness, for which the firmness in the elevations is 46% higher than in the grooves. Also the flesh firmness is higher in the elevations, although the difference is not so marked (26%). Concerning the values of stickiness, they are approximately equal, regardless of the place of measurement, but adhesiveness differs, being more intense, i.e., higher absolute value, in the grooves (-1.2 N) as compared to the elevations (-0.9N).
Figure 7: (a) Firmness; (b) Stickiness and adhesiveness
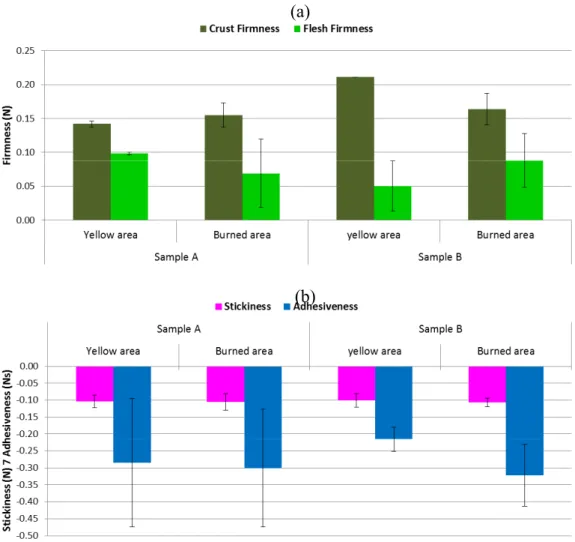
The results in Figure 8 refer to the evaluations made in the unruffled samples, for which determinations were made in the top central area submitted to the heat of burning and also in the surrounding area, unburned. The results clearly stated differences between the burned and the unburned areas for all the textural parameters evaluated, as it would be expected, due to the effect of the formation of a crust in the burned areas. However, the differences between samples are minimal, indicating a uniformity of these sweets, which is expected considering that these were made from the same manufacturer. Regarding the values of the textural parameters evaluated, it is observed that the crust firmness is, on average, 0.67 N, while the flesh firmness is 0.31 N on average, indicating that -0.42 N while adhesiveness was higher (lower negative value.-1.12 Ns).
Figure 8: (a) Firmness; (b) Stickiness and adhesiveness
4. CONCLUSIONS
The results obtained in the present work pretended to be a first attempt to characterize the traditional
some preliminary conclusion regarding the colour and texture of this traditional sweet. The colour of the top burned area is darker, more red and less yellow as compared to the non-burned area. As to texture, the shape (ruffled or not) influences the texture, being the ruffled samples harder when compared to the flat ones. Also differences were found in texture when comparing the burned area with the unburned one, for the four textural parameters evaluated: crust firmness, flesh firmness, stickiness and adhesiveness.
(a)
5. REFERENCES
BARROCA,M.J., R.GUINÉ, M.ALVES, S.OLIVEIRA, F.GONÇALVES, and P.CORREIA. (2013). Effect
of drying on the properties of pears cv. D. Joaquina. In Proceedings of the VII Congreso Ibérico de Agroingeniería y Ciencias Hortícolas, Ref. C0115, 6pp. Madrid, Espanha.
CRUZ,A.C., R.P.F.GUINÉ, and J.C.GONÇALVES. (2015). Drying Kinetics and Product Quality for
Convective Drying of Apples (cvs. Golden Delicious and Granny Smith). International Journal of
Fruit Science, v. 15, p. 54 78.
EC. 2004. Protection of geographical indications, designations of origin and certificates of specific character for agricultural products and foodstuffs. 2nd ed. European commission, Brussels.
GUINÉ,R., P.CORREIA, and A.C.CORREIA. (2015). Avaliação comparativa de queijos de cabra e
ovelha. Millenium, v. 49, p. 111 130.
GUINÉ, R.P.F., and M.J. BARROCA. (2012). Effect of drying treatments on texture and color of
vegetables (pumpkin and green pepper). Food and Bioproducts Processing, v. 90, p. 58 63.
GUINÉ,R.P.F., F.HENRIQUES, and M.J.BARROCA. (2014). Influence of drying treatments on the
physical and chemical properties of cucumber. Journal of Food Measurement and Characterization, 8: 195 206.
SOEIRO, A. (2014). Critérios Para Qualificação de Produtos da Doçaria Tradicional Portuguesa.
QUALIFICA, Portalegre.
VALES,D.L. (2014). Contributo Para a Valorização e Proteção dos Produtos Tradicionais Açorianos.
Dissertação de Mestrado em Tecnologia e Segurança Alimentar. Universidade dos Açores, Ponta Delgada.