C
OMPARISON OF EQUINE CAECAL AND FAECAL INOCULUMS FOR ESTIMATING THE NUTRITIVE VALUE OF CONCENTRATE FEEDS USING THE GAS PRODUCTION TECHNIQUE.
Ângelo Daniel Santos do Cabo
Orientador
Prof. Doutor Luís Miguel Mendes Ferreira Departamento de Zootecnia Universidade de Trás-os-Montes e Alto Douro
Co-orientadora
Prof. Doutora Ana Sofia Gonçalves Santos Departamento de Zootecnia Universidade de Trás-os-Montes e Alto Douro
Dissertação do 2º ciclo de estudos em Engenharia Zootécnica (Grau de Mestre), apresentada à Universidade
de Trás-os-Montes e Alto Douro
Universidade de Trás-os-Montes e Alto Douro Vila Real, 2012
As doutrinas apresentadas são da exclusiva responsabilidade do autor.
V
Abstract
This study intended to compare the fermentative activity of equine caecal and faecal inoculums using the gas production technique. For this purpose 2 feeds (maize and barley) were used. Caecal and faecal inoculums were collected from 2 cannulated geldings fed to maintenance level with meadow hay (80%) and concentrate (20%) offered twice a day in equal proportions. Inoculums were collected 2 hours after the morning feed into pre-warmed flasks filled with CO2. Caecal fluid was strained through 8 layers of cheesecloth and mixed with anaerobic buffer solution. Faecal inoculum was mixed with buffer mineral solution and incubated for 1 hour prior to incubation. Feed samples were incubated in 60 ml of buffered caecal or faecal fluid, in duplicate in 3 series performed on different days for each type of inoculum. Parameters pH, ammonia nitrogen (NH3-N), total volatile fatty acids (VFA) and gas production were measured after 96h of fermentation. Data was analysed by the generalized linear model procedure using a multifactorial model design with feedstuffs and inoculum as the main factors. Differences between feeds concerning pH (p<0.05), NH3-N (p<0.01), proportion of propionate (p<0.05), proportion of valerate and isovalerate (p<0.01) and relation between acetate and propionate were observed. The type of inoculum showed differences in the time of incubation at which half of the asymptotic gas production has been formed (B) parameter of gas production (p<0.01), pH (p<0.05), NH3-N (p<0.01), total VFA (p<0.01) and proportions of butyrate (p<0.01) and valerate and isovalerate (p<0.01). NH3-N was the only parameter that presented differences for the interaction between feed and inoculum (p<0.05). The results obtained in this study indicated differences in fermentation patterns between faecal and caecal inoculums, eventually due to the different microbial population present in both inoculums sources. Nevertheless, results indicate that faeces can be used as substitute for caecal fluid in the gas production technique to evaluate the nutritive value and fermentation profile of concentrate feeds.
VI
Resumo
Este trabalho teve por objetivo comparar a atividade fermentativa de inóculo cecal e fecal de equino utilizando a técnica da produção de gás. Para este efeito, foram utilizados dois equinos castrados canulados no ceco, alimentados ao nível da manutenção com um feno de prado natural (80%) e alimento composto (20%), sendo distribuída metade da quantidade diária às 08:00 h e a restante às 20:00 h, para se evitar seleção e desperdício de alimento. Foram estudados 2 alimentos (milho e cevada). As amostras de conteúdo cecal e de fezes foram recolhidas 2h após a refeição matinal para recipientes previamente aquecidos e saturados com CO2. O conteúdo cecal foi filtrado através de 8 camadas de gaze e misturado com solução nutritiva tampão (SNT). As amostras fezes foram misturadas e incubadas durante 1h com SNT antes da incubação. As amostras de alimento foram incubadas com 60 ml de inóculo cecal ou fecal, em duplicado e repetidos 3 vezes no tempo para cada tipo de inóculo. Após 96h de fermentação, foi avaliado o pH, o azoto amoniacal (NH3-N), os ácidos gordos voláteis (AGV) totais e a produção de gás. A análise de dados foi realizada através de uma análise de variância (ANOVA) considerando o alimento e o tipo de inóculo como fontes de variação. Foram observadas diferenças entre alimentos ao nível do pH (p<0.05), N-NH3 (p<0.01), a proporção de propionato (p<0.05), a proporção de valerato e isovalerato (p<0.01) e a relação acetato/propionato (p<0.05) como consequência dos diferentes padrões de fermentação. O tipo de inóculo apresentou diferenças ao nível do tempo de incubação necessário para atingir metade da produção de gás assimptota (B) da produção de gás (p<0.01), pH (p<0.05), N-NH3 (p<0.01), AGV totais (p<0.01) e proporções de ácido butírico (p<0.01) e ácido valérico e isovalérico (p<0.01). A interação entre o alimento e o tipo de inóculo foi significativa (p<0.05) apenas para o N-NH3. Os resultados demonstraram a existência de padrões de fermentação distintos consoante o tipo de inóculo, sendo provavelmente o reflexo das diferenças ao nível da população microbiana e/ou da sua atividade fermentativa. No entanto, os resultados também demonstraram que o material fecal pode ser utilizado em alternativa ao conteúdo cecal na técnica da produção de gás para a avaliação do valor nutritivo e o perfil fermentativo de cereais.
VII
Acknowledgements
Here at the end of this important stage of my life, I would like to express my deepest gratitude to those who helped to make this thesis a reality.
To my thesis supervisors Professor Ph.D. Luís Miguel Mendes Ferreira and Ph.D. Ana Sofia Gonçalves Santos for all the patience demonstrated during those long hours spent analysing the data and the guidance during the elaboration of this thesis. Thank you for the patience and support throughout the entire thesis.
To my girlfriend Liliana for her constant support and keeping me in a good mood, helping as much as possible every time she could.
To my colleagues that supported me for this past five years in the good and not so good moments: Daniela, Eduardo, Sílvia, Sónia, Rui, Telma and every other friend that made my academic life full of memorable moments.
To Nita for the guidance in the nutrition lab during all the procedures.
Last but not least, to my family for all the sacrifice, counselling and support. Thank you for everything, no words will ever express enough gratitude for everything you have done for me.
IX
Contents
Abstract...V Resumo ...VI Acknowledgements ... VII Contents ... IX List of tables ... X List of figures ... XI Abbreviations and nomenclature ... XII1. Introduction ... 1
1.1. Gas production ... 2
1.2. Microbial inocolum: caecal fluid vs. faeces ... 7
2. Material and Methods... 8
2.1. Animals and diet ... 8
2.2. Feed samples and chemical analysis ... 8
2.3. In vitro fermentation ... 9
2.4. Inoculum preparation ... 10
2.5. In vitro gas production... 10
2.6. Statistical analysis ... 10
3. Results ... 11
4. Discussion... 13
5. Conclusion ... 17
X
List of tables
Table 1: Summary of the common methods used in the in vitro gas production technique (adapted from Rymer et al., 2005). ...3
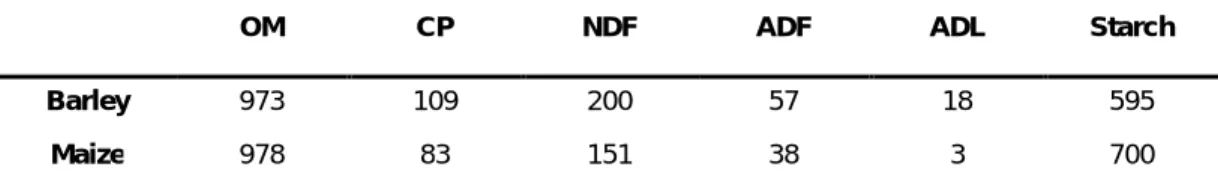
Table 2: Chemical composition of feed samples used in the experiment, expressed in g/kg of Dry Matter (DM). ...9
Table 3: Results obtained for the different parameters measured on inoculums before the incubation. ...9
Table 4: Estimated parameters of gas production profiles, pH and NH3-N after 96h
incubation. ...11
XI
List of figures
Figure 1: Description of the gas production apparatus used by Cone et al. (1996). ...5 Figure 2: Curves representing the gas production output from the automatic system when maize was incubated with caecal or faecal inoculum whereas, faecal inoculum represents a typical sigmoidal curve. The respective phases are presented as described by Beuvink and Kogut (1993) ...6
XII
Abbreviations and nomenclature
A – Estimated asymptotic gas production ADF – Acid detergent fiber
ADL – Acid detergent lignin
B – Time of incubation at which half of the asymptotic gas production has been formed C – Constant determining the sharpness of the switching characteristic for the profile CH4 – Methane
CO2 – Carbon dioxide CP – Crude protein DM – Dry matter IxF – Inoculum x Feed NDF – Neutral detergent fiber NH3-N – Ammonia nitrogen
NIRS – Near infrared spectrophotometry OM – Organic matter
OMD – Organic matter digestibility t – Incubation period
PpA – Proportion of acetate PpB – Proportion of butyrate PpP – Proportion of propionate
PpV+IV – Proportion of valerate and isovalerate VFA – Volatile fatty acids
1
1. Introduction
Nutritive values determination in animal feedstuffs is essential in animal production. Knowledge on the chemical composition of feeds, its digestibility and intake, fermentation kinetics and other nutritive parameters can have a great impact on animal performance. In the case of horses this impact can be most easily seen in high performance horses, where metabolic diseases represent a major economic loss. Different methodologies can be used to estimate nutritive parameters in horses. Miraglia et al. (1999) described some of these techniques and divided them in 1) calculations based on chemical composition of feeds, 2) in vitro and 3) in vivo methodologies.
Example of calculations techniques are the one used by Martin-Rosset et al. (1996a) where the organic matter digestibility of forages in horses is predicted based on their chemical composition, more precisely, based on neutral detergent fibre (NDF), acid detergent lignin (ADL) and crude protein (CP). Another example is the near infrared spectrophotometry (NIRS) that predicts the OMD using the reflectance spectra of forages (Andrieu et al., 1996) measured in different wavelengths (1100-2500 nm) with a monochromatic spectrophotometer. The in vivo methods include the total collection of faeces (Martin-Rosset et al., 1984) and the utilization of internal markers such as acid insoluble ash, ADL and natural alkanes (Miraglia et al., 1999; Ordakowski et al., 2001; Santos et al., 2005; Peiretti et al., 2006; Ferreira et al., 2007; Sales, 2012) and also Cr2O3 and artificial alkanes as external markers (Cuddeford and Hughes, 1990; Oliveira et al., 2003; Ferreira et al., 2007).The in situ methodology (Ørskov et al., 1980) is another in vivo method although it requires surgically modified animals to assess nutritional parameters (Mould et al., 2005). Despite having more accuracy, in vivo methodologies have several drawbacks such as being time consuming, more laborious or higher inherent costs (Stern et al., 1997; Miraglia et al., 1999; Gosselink et al., 2004; Abdouli and Ben Attia, 2007). The limitations of in vivo methods led to the development of several in vitro methodologies to estimate the digestibility of feedstuffs (Brooks and Urness, 1984). The enzymatic technique of pepsine-cellulase developed by Aufrere (1982) has been one of the most used enzymatic methods. Martin-Rosset et al. (1996b) confirmed the suitability of the pepsine-cellulase technique in horses already studied by Miraglia and Tisserand (1985). It was shown that the enzymatic method was more accurate than the chemical method (calculations) even when used with the best
2
predictors (NDF, ADL and CP). In vitro methodologies can also be performed using microbial inoculum. The two-stage method of Tilley and Terry (Tilley and Terry, 1963) is a technique that as a first fermentative stage using microbial inoculums (rumen inoculums) that simulates the microbial fermentation, and a second stage simulating the enzymatic digestion that occurs in the lower gastrointestinal tract of ruminants. This method was originally developed for ruminants but it has been adapted and changed to simulate the digestion of horses. Abdouli and Ben Attia (2007) have altered the original method performing a first enzymatic stage, followed by a fermentation stage using caecal inoculum. Gas production technique is another in vitro methodology has been widely used for nutritive value estimation. This technique was initially developed for ruminants by Menke et al. (1979), and uses microbial inoculum to assess the fermentation characteristics of feeds. The need of microbial sources, i.e. rumen fluid, led to the use of cannulated animals. Nevertheless, this technique has been adapted to monogastric animals, e. g., pigs (Awati et al., 2006), poultry (Lan et al., 2007) and horses (Lowman et a., 1996). According to Gosselink et al. (2004) the enzymatic, Tilley and Terry and gas production techniques, together with the in situ (nylon bag) are the most frequently used to measure alternative degradable organic matter.
1.1. Gas production
The gas production technique is based on the principle that the gas produced is a result of in vitro fermentation of feeds by microorganisms (Awati et al., 2006). The main objective of this technique is to measure the amount of gas that is produced during fermentation, and, for that purpose, feedstuffs are incubated with inoculum previously collected and mixed with a buffer. The gas measured using this methodology is a direct result of the substrate fermentation, releasing carbon dioxide (CO2) and methane (CH4), and indirectly by releasing CO2 due to volatile fatty acids (VFA) production from the bicarbonate buffer (Beuvink and Spoelstra, 1992; Awati et al., 2006). The gas produced results mainly from carbohydrate fermentation, whereas the contribution resulting from protein fermentation is comparatively lower (Wolin, 1960) and the contribution of fat fermentation is negligible (Getachew et al., 1998).
Due to its applicability, the gas production technique has been widely used and adapted, using different equipments. The common methods and adaptations of the in vitro gas production are summarised in Table 1.This technique was considered a
3 T a b le 1 : S u m m a ry o f th e co m m o n m e th o d s u se d i n t h e i n vi tr o g a s p ro d u c ti o n t e h n iq u e ( a d a p te d f ro m R y m e r e t a l. , 2 0 0 5 ) M e n k e e t a l. (1 9 7 9 ) Bl ü m m e l a n d Ø rs k o v (1 9 9 3 ) T h e o d o ro u e t a l. (1 9 9 4 ) M a u ri c io e t a l. (1 9 9 9 ) Pe ll a n d Sc h o fi e ld (1 9 9 3 ) C o n e e t a l. (1 9 9 6 ) D a v ie s e t a l. (2 0 0 0 ) In c u b a ti o n c o n d u c te d i n : Sy ri n g u e s k e p t in ro to r (5 0 c m d ia m e te r, 1 ro ta ti o n /m in ) Sy ri n g u e s k e p t in w a te rb a th Bo tt le i n i n c u b a to r Bo tt le i n i n c u b a to r Bo tt le a n d s ti rre r (4 8 rp m ) k e p t in in c u b a to r Bo tt le i n s h a k in g w a te rb a th (5 0 o s c ill a ti o n s /m in ) Bo tt le i n i n c u b a to r M ic ro b ia l In o c u lu m L iq u id p h a s e L iq u id a n d s o lid p h a s e L iq u id a n d s o lid p h a s e L iq u id p h a s e L iq u id p h a s e L iq u id p h a s e L iq u id a n d s o lid p h a s e R u m e n f lu id c o lle c ti o n ti m e Be fo re f e e d in g Be fo re f e e d in g Be fo re f e e d in g Be fo re f e e d in g 2 h a ft e r fe e d in g 2 h a ft e r fe e d in g Be fo re f e e d in g In o c u lu m v o lu m e (m l) 1 0 2 0 1 0 1 0 2 6 0 1 0 in c u b a ti o n v o lu m e (m l) 3 0 3 0 1 0 0 1 0 0 1 0 1 0 0 1 0 0 M e d iu m re fe re n c e M e n k e e t a l. (1 9 7 9 ) M e n k e e t a l. (1 9 7 9 )+ t ry p ti c a s e T h e o d o ro u (1 9 9 3 ) T h e o d o ro u (1 9 9 3 ) G o e ri n g a n d V a n So e s t (1 9 7 0 ) St e in g a s s (1 9 8 3 ) T h e o d o ro u (1 9 9 3 ) Sa m p le (m g ) 2 0 0 -3 0 0 2 0 0 5 0 0 -1 0 0 0 1 0 0 0 1 0 0 4 0 0 -5 0 0 1 0 0 0 Sa m p le c o n ta in e r (m l) 1 0 0 1 0 0 1 2 5 1 2 5 5 0 2 5 0 1 4 0 N u m b e r o f fe rm e n ta ti o n v e s s e ls 6 0 -A s re q u ire d A s re q u ire d 1 5 1 2 4 8 H C O 3 m m o l/ g s a m p le 7 ,2 7 ,2 9 ,3 9 ,3 9 ,3 1 1 ,7 9 ,3
4
routine method to evaluate feedstuff after the work of Menke et al. (1979), where a high correlation between in vitro gas production and apparent in vivo digestibility was reported (Getachew et al., 1998). Despite that, the procedure wasn’t widely accepted in forage evaluation laboratories such as other digestibility procedures (Theodorou et al., 1994). The base for the “Hohenheim Gas Test” or Menke et al. (1979) gas production technique was the work of Czerkawski and Brenckenridge (1975) where the displacement of a plunger due to the fermentation of feedstuff in a glass syringe was measured.
The method developed by Menke et al. (1979) was modified over time, improving the original technique: incubating the syringe in a water bath rather than a rotating incubator (Blümmel et al., 1993 cited by Rymer et al., 2005) and the record of gas changes at regular times, giving access to the kinetics of fermentation and the end-point value (Blümmel et al., 1993 cited by Williams, 2000 and Rymer et al., 2005). Theodorou et al. (1991) cited by Williams (2000), described a manual transducer technique where the pressure and volume were recorded at regular intervals, allowing the study of fermentation kinetics of feedstuffs. The advantage of this technique was that a large number of samples could be handled simultaneously at a lower cost. However, the fact of being a manual method, if the pressure wasn’t released when needed, the microbial fermentation could be negatively affected (Getachew et al., 1998). As reported by Rymer et al. (2005), semi and full automated recording systems of headspace pressure were developed as described by Pell and Scholfield (1993), Cone et al. (1996), Mauricio et al. (1999) and Davies et al. (2000). These techniques are less laborious than the manual measurement techniques.
Figure 1 describes the apparatus used by Cone et al. (1996). This method relies on a pressure transducer combined with an electric micro-valve to release overpressure from each bottle. Each bottle has its own pressure transducer that reacts to a small production of gas (± 0.7ml), opening the valve to prevent gas accumulation. The quantity of gas needed to open the valves can be adjusted. The time needed to open the valves is registered by the automatic systems and therefore a cumulative time registration of the gas production is made. This apparatus provides continuous data allowing a more profound study of feeds fermentation kinetics. This data needs to be statistically analysed and gas production curves need to be modulated.
5
Figure 1: Description of the gas production apparatus used by Cone et al. (1996). The gas
produced in the bottle flows through a 50 ml expansion vessel (A) to condense liquid and is recorded by a pressure transducer (C). when the pressure reaches a pre-set upper limit the electric valve (B) opens, until a pre-set minimum is reached. Opening and closing of the valves is controlled by an electronic control unit (D) and data transferred to a computer (PC). E is a syringue needle with a tap, which is closed after an equilibration period oif 2min after the start of the incubation (Cone et al., 1996).
The shape of the gas production curves can vary from steep diminishing to highly sigmoidal, creating a difficulty with the choice of the mathematical model (France et al., 2000). Dhanoa et al. (2000) stated that different shapes, presence of an inflexion point or not, and the relationship between gas production kinetics and extend of degradation in the rumen, requires the application of an appropriate model to describe the curves and relate to the profile to ruminal degradation. Beuvink and Kogut (1993) used classical (sigmoidal) curves and distinguished 3 different phases (Figure 2):
Phase 1 - None or minimal gas production (initial phase) Phase 2 - Rapid gas production phase (exponential phase)
Phase 3 - Phase where the gas production slows and eventually reaches 0 (asymptotic phase)
The first phase is related to the hydration, attachment and colonization of insoluble substrate by the microbes (Cheng et al. 1980). The phase of exponential gas production begins when the substrate is saturated with microbes or enzymes and the
6
most easily degradable part of the insoluble substrate is degraded, leaving the substrate less digestible. The last phase begins when the substrate is totally non-degradable and the gas production rate tends to reach zero (Beuvink and Kogut, 1993). Therefore, the relative proportions of soluble, insoluble but degradable, and undegradable particles of the feed have influence in the kinetics of gas production (Getachew et al., 1998). The kinetics depends also on a sequence of processes (Groot et al., 1996), e.g., hydration, colonization and fermentation. Demeyer (1981) and Hidayat et al. (1993) reported that the initial concentration and composition of the microbial population, and the ability to colonize, ferment and use the products of fermentation to grow, has an effect on the rate at which the processes take place.
Figure 2: Curves representing the gas production output from the automatic system when maize
was incubated with caecal or faecal inoculum whereas, faecal inoculum represents a typical sigmoidal curve.
The use of mathematical models allows analysis of data, comparisons of substrate or fermentation environments and can provide useful information concerning the substrate composition and the fermentability of soluble and slowly fermentable components of the substrate (Groot et al., 1996; Getachew et al., 1998). France et al. (2000) stated that the choice of the mathematical model to be used should be made according on a basis of fitting criteria. According to Dhanoa et al. (2000), the generalized Mitscherlich and the generalized Michaelis-Menten functions are more
0 20 40 60 80 100 0 10 20 30 40 50 60 70 80 90 100 Phase 1 Phase 2 Phase 3 Caecal inoculum Faecal inoculum ml h
7
suitable due to their flexibility to cover sigmoidal and non-sigmoidal shapes, whether symmetrical or not. The model of Groot et al. (1996) is one example of a generalized Michaelis-Menten function. This model was created due to the increased necessity of a more flexible model caused by the improved modern equipment and its high-resolution measurements. However there are many models and France et al. (2005) described the difficulties to relate them.
1.2. Microbial inocolum: caecal fluid vs. faeces
The use of faeces as an inoculum source will depend on the feasibility of representing rumen or caecal fermentation. In ruminants, the microbial population that appears in the faeces is not expected to be representative of that of the rumen. In the case of monogastric animals such influences are expected to be lower and the utilization of faeces as a replacement of caecal fluid should be easier to simulate (Rymer et al., 2005). Feeds reach the caecum after passing by the stomach and small intestine, and therefore were partially digested. The caecum and colon are the compartments in the digestive tract of the horse where the most active fermentation occurs (Kern et al., 1973). de Fombelle et al. (2003) reported that the caecum was balanced in terms of cellulolytic bacteria, Lactobacilli, Streptococci and lactate-utilizing bacteria. However, these authors stated that faeces were not as balanced as caecal fluid, presenting a higher content in total anaerobic bacteria, Lactobacilli and Streptococci, slightly more lactate-utilizing bacteria and depending on the diet a lower or equivalent content in cellulolytic bacteria.
According to Holter (1991) cited by Lowman et al. (1999) faecal material is viable after excretion, remaining largely anaerobic and the microflora being viable several hours after excretion. The capacity of faecal material as inoculum source has already been studied in ruminants and had successful results (El Shaer et al., 1987 cited by Lowman et al., 1999). Mauricio et al. (2001) reported that faecal inoculum could be used as an alternative for rumen inoculum in the in vitro gas production technique, but longer lag phases were observed. Regarding horses, Lowman et al. (1996) observed similar results with faeces and caecal fluid and suggested the possibility to use faecal inoculum as alternative source to estimate food degradability. Macheboeuf and Jestin (1997a) reported that OMD prediction of 52 forages using the gas test method with faeces as a source of inoculum was similar to what they had previously observed when
8
used caecal fluid. However, the results obtained when using the gas production technique were less accurate than the ones obtained by the enzymatic or the NIRS methods when estimating the nutritive value for the same forages (Macheboeuf et al., 1997b). Faecal inoculum has already been used in many studies (Lowman et al., 1999; Murray et al., 2006; Abdouli and Ben Attia, 2007, Denek et al., 2008; Murray et al., 2008) with success.
The present study aimed to compare the fermentative activity of equine caecal and faecal inoculum using the gas production technique, assessing the possibility of replacing caecal contents by fresh faeces as inoculum source.
2. Material and Methods
2.1. Animals and diet
Two cannulated geldings were used for faecal and caecal samples collection and were fed to maintenance level at 2% body weight according to INRA nutrient requirements for horses (INRA, 1990). A standard diet composed of commercial concentrate and meadow hay in ratio of 20:80, respectively was offered at 8:00 am and 4:00 pm in equal proportions. Animals were housed individually on a bed of wheat straw, had free access to water and were walked every day.
2.2. Feed samples and chemical analysis
Two concentrate feeds were used to study in vitro fermentation, barley and maize. Feed samples were analysed for ash (method 942.05, AOAC, 1990) and total N as Kjeldahl N (method 954.01, AOAC, 1990) and crude protein was determined as CP= total N x 6.25. Neutral detergent fibre (NDF), acid detergent fibre (ADF) and acid detergent lignin (ADL) fractions were determined by the detergent procedures of Robertson and Van Soest (1981) and Van Soest et al. (1991). Starch was analysed according to Solomonson et al. (1984).
The chemical composition of feedstuffs is summarized on Table 2. The pH values of the inoculum and fermentation medium were measured with a digital pH meter (Wissenschaftlich-Technische Werkstätten, pH 530, Weilheim, Germany). Ammonia nitrogen (NH3-N) was analysed according to Conway (1950). The
9
concentrations of VFA in the inoculum and fermentation medium after gas production were analysed in a gas-liquid chromatograph (Shimadzu GC-141 B, Kyoto, Japan) Table 2: Chemical composition of feed samples used in the experiment, expressed in g/kg of Dry
Matter (DM)
OM CP NDF ADF ADL Starch
Barley 973 109 200 57 18 595
Maize 978 83 151 38 3 700
OM: Organic matter; CP: Crude protein; NDF: Neutral detergent fiber; ADF: Acide detergent fiber; ADL: Acid detergent lignin.
equipped with a flame-ionization detector and a capillary column (SUPELCO Nukol, 30 m x 0.25 mm i.d., 0.25 µm film) using pivalic acid (0.4 M) as the internal standard (Czerkawski, 1976) The area for each VFA including acetate, propionate, butyrate, isovalerate and valerate was compared with the internal standard. Results obtained for the different parameters measured on inoculums before the incubation are presented on Table 3.
Table 3: Results obtained for the different parameters measured on inoculums before the
incubation.
pH NH3-N Total
VFA PpA PpP PpB PpV+IV
Acetate: Propionate Caecal content with buffer 6.87 ±0.197 7.07 ±0.82 2.90 ±0.20 0.67 ±0.042 0.28 ±0.04 0.049 ±0.003 - 2.49 ±0.52 Faecal content with buffer 7.085 ±0.0636 10.24 ±0.54 0.7 ±0.009 0.68 ±0.048 0.24 ±0.03 0.075 ±0.014 0.0054 ±0.0121 2.96 ±0.62
NH3-N: Ammonia nitrogen (mg/100ml); VFA: Volatile fatty acids (mmol/ml); PpA Proportion of acetate; PpP:
Proportion of propionate; PpB: Proportion of butyrate; PpV+IV: Proportion of valerate and isovalerate.
2.3. In vitro fermentation
In vitro fermentation studies were performed in three series, completed on different days for both inoculums. The faeces/caecal fluid were collected approximately two hours after the morning meal in both animals and were kept at 39ºC in a pre-warmed recipient filled with CO2. Faeces were collected by grab sampling and were
10
kept in a pre-warmed recipient. Between each grab sampling CO2 was added after each opening to keep an anaerobic atmosphere.
2.4. Inoculum preparation
Caecal fluid freshly collected was carried to the lab and was strained through 8 layers of cheesecloth and mixed with anaerobic buffer solution in a ratio 1:1 (caecal fluid:buffer), according to the results obtained by Lima et al. (personal communication). Within 1 hour freshly collected faeces were carried to the lab and approximately 400 g were mixed with 1200 ml of a freshly prepared CO2 satured nutritive medium at 39º in a liquidizer (Tefal Performa, France) under constant CO2 flow. The mixture was left for 1 hour on a stirring and heating system (39ºC). Before its utilization, the inoculum was filtered through 8 layers of cheesecloth. The nutritive medium used in both cases consisted of a carbonate-phosphate buffer solution containing (g/l): 8.75 g NaHCO3, 1.00 g NH4CO3, 1.43 g Na2HPO4, 1.55 g KH2PO4, 0.15 g MgSO4.7H2O, 0.52 g NaS, 0.017 g CaCl2.2H2O, 0.015 g MnCl2.4H2O, 0.002 g CoCl3.6H2O, 0.012 g FeCl3.6H2O and 0.125 g resazurin according to Menke et al. (1979) as modified by Steingass (1983).
2.5. In vitro gas production
Feedstuff samples (450 mg) were accurately weighted into 250 ml serum bottles (Schott, Mainz, Germany), in duplicate, and incubated with 60 ml caecal/faecal inoculum. A fully automated system (Cone et al., 1996) recorded gas production for 96h. Two blanks bottles were included in each assay to correct gas production. After the 96h, pH was measured and a sample was frozen for VFA and NH3-N analysis.
Gas curves were fitted to a mathematical sigmoidal model as described by Groot et al. (1996):
Gas (ml) =
1 + ( ⁄ )
Where A (ml) is the estimated asymptotic gas production, B (h) is the time of incubation at which half of the asymptotic gas production has been formed, C is a parameter that determines the shape of the curve and t is the incubation period.
11
Parameter values and curve fitting were estimated by the Marquard compromise of a non-linear regression method, using software (Proc NLIN) (Statistical Analysis System Institute (SAS), 1999).
Data of in vitro gas production, NH3-N, pH and end-product contents were analysed with the generalized linear model procedure of the SAS (1999) using a multifactorial model design with feedstuffs and inoculum as main factors.
3. Results
The results related to the gas production parameters (A, B and C), pH and NH3-N can be observed on Table 4. Asymptotic gas production (A) and sharpness (C) averaged 100.4 ml and 3.0 respectively. There were no differences concerning neither the type of inoculum nor the type of feed for parameters A and C. Nevertheless, differences were observed for parameter B. Values for faecal inoculum practically doubled in relation to caecal inoculum (10.5 h and 5.2 h respectively). No interaction between inoculum and type of feed (IxF) was observed for A, B or C.
Table 4: Estimated parameters of gas production profiles, pH and NH3-N after 96h incubation.
Inoculum Feed A B C pH NH3-N Caecal Barley 104 ±3.5 4.3 ±1.24 2.5 ±0.42 6.78 ±0.04 11.7 ±1.10 Maize 107 ±2.6 6.0 ±1.36 2.5 ±0.40 6.75 ±0.08 9.8 ±1.46 Faecal Barley 101 ±5.8 9.3 ±2.75 3.1 ±0.66 6.76 ±0.04 18.7 ±3.02 Maize 103 ±5.0 11.6 ±2.52 3.9 ±1.62 6.67 ±0.04 14.6 ±0.55 Effects Inoculum (I) 0.2178 0.0021 0.0890 0.0413 <0.001 Feed (F) 0.3289 0.1376 0.4779 0.0136 <0.001 IxF 0.7841 0.8149 0.4420 0.2728 0.0322
A: Estimated asymptotic gas production (ml/g OM); B: Time of incubation at which half of the asymptotic gas
production has been formed (h); C: Constant determining the sharpness of the switching characteristics for the profile; NH3-N: Ammonia nitrogen (mg/100ml); IxF: Inoculum x Feed.
The values of pH showed no differences for IxF, however there were differences between inocula (p<0.05) and between feeds (p<0.05). Faecal inoculum (6.72) presented lower values than caecal inoculum (6.77). When barley was used, pH values averaged 6.77, a higher value when compared to maize (6.71).
12
NH3-N values showed differences in all the effects studied as presented on Table 4. Higher values were observed when faeces were used as inoculum source, averaging 16.65 compared to the caecal inoculum that averaged 10.75. Regarding feed type, barley presented higher values than maize. The averages values were 15.2 and 12.2 for barley and maize respectively.
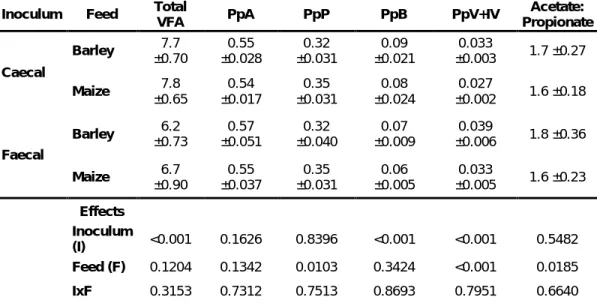
Results regarding VFA, proportion of acetic acid (PpA), propionic acid (PpP), butyric acid (PpB), valeric and isovaleric acid (PpV+IV), and the ratio of acetic and propionic acid are presented on Table 5.
Table 5: Estimated parameters of fermentation end-products after 96h incubation.
Inoculum Feed Total
VFA PpA PpP PpB PpV+IV
Acetate: Propionate Caecal Barley 7.7 ±0.70 0.55 ±0.028 0.32 ±0.031 0.09 ±0.021 0.033 ±0.003 1.7 ±0.27 Maize 7.8 ±0.65 0.54 ±0.017 0.35 ±0.031 0.08 ±0.024 0.027 ±0.002 1.6 ±0.18 Faecal Barley ±0.73 6.2 ±0.051 0.57 ±0.040 0.32 ±0.009 0.07 ±0.006 0.039 1.8 ±0.36 Maize 6.7 ±0.90 0.55 ±0.037 0.35 ±0.031 0.06 ±0.005 0.033 ±0.005 1.6 ±0.23 Effects Inoculum (I) <0.001 0.1626 0.8396 <0.001 <0.001 0.5482 Feed (F) 0.1204 0.1342 0.0103 0.3424 <0.001 0.0185 IxF 0.3153 0.7312 0.7513 0.8693 0.7951 0.6640
VFA: Volatile fatty acids (mmol/ml); PpA Proportion of acetate; PpP: Proportion of propionate; PpB: Proportion of butyrate; PpV+IV: Proportion of valerate and isovalerate.
There were no differences observed regarding total VFA values for neither the type of feed nor IxF. However, an influence (p<0.01) due to the type of inoculum was observed. Caecal inoculum presented higher (7.75 mmol/ml) total VFA values than faecal inoculum (6.45 mmol/ml). PpA values averaged 0.55 and did not present differences regarding the inoculum type, feed type or the interaction between them. Differences (p<0.05) were observed for PpP values related to the feed type, barley averaged lower values compared to maize (0.32 and 0.35 for barley and maize, respectively). Nevertheless, inoculum type and IxF did not present influences on PpP values. Regarding PpB values, influence (p<0.01) due to the inoculum type was
13
observed. Faecal inoculum averaged lower values compared to the caecal inoculum (0.07 and 0.09 respectively). Neither feed type nor IxF had an influence on PpB values. PpV+IV presented differences caused by inoculum type (p<0.01) and feed type (p<0.01) but no interaction was observed. When compared, faecal inoculum presented higher PpV+IV values, an average of 0.036 compared to 0.030 for caecal inoculum. Regarding feed type, higher values were observed when barley was used as substrate for the incubation (0.036 and 0.030 for barley and maize, respectively). The values regarding the ratio between acetic acid and propionic acid did not show differences for the type of inoculum used or IxF. On the other hand, differences were observed for the type of feed used. Barley averaged 1.77, while maize averaged lower values (1.58).
It should be noted the lack of interaction between feed and inoculum type for any of the studied parameters, excepting for the NH3-N values.
4. Discussion
The analysis of the gas production profiles showed differences between the inoculums for parameter B. These differences should be interpreted, on a first stage, accordingly to the biological meaning of this parameter. As presented by Groot et al. (1996), B is the time of incubation at which half of the asymptotic gas production has been formed, and together with C it defines the shape of the gas production curves. In this way, it might be reasonable to accept that a higher lag phase occurred when faecal inoculum was used. In fact, it is expected that feeds, incubated with different inoculums, showing longer initial lag phase will also show a later asymptotic gas production. When faecal inoculum was used, B values averaged 10.5h, whereas when caecal inoculum was used the average time of incubations for reaching half asymptotic gas production was of 5.2 hours. Furthermore, the visual appraisal of the gas production curves showed medium lag time of 6h for faecal inoculum whereas no lag time was observed for caecal inoculum. These results can be related to the type of microbial population present in the different inoculums and its respective fermentative capacity.
Although it has been referred that faeces present a higher number of starch using bacteria than caecal fluid (Sadet-Bourgeteau and Julliand, 2010), the results obtained in our trial indicate that faeces may have a deficient viable microbial population compared to caecal fluid. The microbial population present in faeces surely decreases its viability in the rectum due to the diminution of the optimum environmental
14
conditions for their maintenance. Also, optimum conditions of anaerobiosis and temperature are not easily maintained throughout the collection or during the preparation of the inoculum, these factors can lead to a “latent” microbial population. This has been referred by other authors when using ruminant faecal inoculum. Mauricio et al. (2001) reported longer lag phases when using faeces, justifying these observations on the basis that the microbial population in the faeces is likely to be in a “state of suspended animation” from which it takes a longer period of time to begin its growth and activity.
Values obtained for the asymptotic gas production (A: 100.4 ml) using caecal or faecal inoculum did not differ and were lower than those generally observed for the same substrates incubated with rumen inoculum (345 ml/g OM by Van Laar et al. (2006) and 300 ml/g OM observed by Rodrigues et al. (2009) using the Groot model). Differences in gas production profiles have also been reported by several authors. Mauricio et al. (2001) reported lower gas production comparing faecal and rumen inoculum of bovines. The lower production on faecal inoculum can be due to the lower content on viable microorganisms as referred above. The time of collection and the time spent preparing the faeces for the incubation may also have effects on the microorganism’s viability (Desrousseaux et al., 2010). The low values for caecal inoculum when compared to rumen inoculum, can be explained by the post gastric placement of the caecum compartment. The microbial population existing in the caecum is limited by the pre-caecal digestion of feed components, and this will lead to a less active microbial population compared to that of the rumen (Santos et al., 2010).
The differences of pH observed between barley and maize can be explained by the different composition of the feeds. Soluble carbohydrates such as starch are known to lower pH of caecum when they aren’t digested in the pre-caecal compartments (Willard et al., 1977). Feeds with high starch content promote higher rate of propionate directed fermentation, leading to an increase of total VFA and to a pH decrease. Diminution of pH per se changes the microbial ecosystem, decreasing cellulolytic bacteria and increasing acidophyle flora, modifying the fermentative profile (less acetate, more lactate and propionate), amplifying the decrease of pH (de Fombelle et al., 2001). Maize has higher starch content, justifying the lower pH values. According to Wolter et al. (1980) the average caecum pH is around 7.0 and descends to 6.8 five to eight hours after the meal. The results observed for barley are in accordance to that, but maize had lower pH values showing the impact that feeds with higher starch
15
content can have on the gastro-intestinal physiology. The differences observed between inoculums can be due to the microbial population. Faeces are known to have a higher content on starch using bacteria when compared to caecal inoculum (de Fombelle et al., 2003; Sadet-Bourgeteau and Julliand, 2010; Santos et al., 2010), thus can lead to propionate oriented fermentation and, as stated before, to a cycle that decreases pH and amplifies that decrease. It should be highlighted that the faecal inoculum presented a higher pH decrease when the values after the incubation were compared to the values before incubation (Table 3). The decrease for caecal inoculum was around 0.11 in comparison to the faecal inoculum that presented a decrease of 0.37, showing that faecal inoculum had a more acid related fermentation when compared to caecal inoculum.
Ammonia nitrogen showed differences for every effect tested in the experiment. The higher values of NH3-N observed when barley was used can be explained by the higher crude protein content of this feed. Fermentation of protein will lead to a release of NH3-N to the medium. This can also be observed when analysing the valerate and isovalerate proportion. These fatty acids can be related to protein fermentation, feeds with more CP will lead to a higher valerate and isovalerate production (Kern et al., 1974). Besides higher NH3-N, barley also presented a higher PpV+IV. Ammonia nitrogen differences observed for the type of inoculum can be due to differences in microbial population. In fact, the caecal microbial population has higher relative proportion of fibrolytic microbes, whereas the faecal microbial population has a higher proportion of starch using microbes (de Fombelle et al., 2003; Sadet-Bourgeteau and Julliand, 2010; Santos et al., 2010; Martin-Rosset and Martin, 2012). In this way, a proteolytic directed fermentation could be expected, resulting in higher NH3-N values has observed. Additionally to this, immediately after inoculum preparation, faecal inoculum showed higher NH3-N content than caecal inoculum (Table 3). This may be due to the microbial protein produced in the caecum being degraded before the excretion, leading to higher values of NH3-N and PpV+IV in the faeces and therefore in the faecal inoculum as it is presented in Table 3. Also faeces can contain some residual microorganisms has a result of the inoculum preparation, increasing the protein availability for the other microbes.
Lower total VFA values were observed for the faecal inoculum. This was expected since faecal inoculum presented a lower fermentation rate, with a longer lag phase concerning gas production, indicating a possible adaptation of the microbial
16
population of the faeces. The VFA values are a direct consequence of the gas production and the composition related to the type of fermentations that occurs. Since the faecal inoculum can possibly have a lower viable microbial population, due to the reasons already stated above, total VFA could be directly affected and therefore present lower values when compared to caecal inoculum. Nevertheless, It should be referred that faecal inoculum had lower total VFA values before incubation (Table 3).
Regarding PpP, maize presented higher values compared to barley. This can be due to the higher starch content of maize that promotes the production of propionate as end-product of fermentation (McDonald et al., 2002). Caecal inoculum showed higher values of PpB than faecal inoculum, eventually due to the obligate anaerobic bacteria that produces butyrate. According to Sadet-Bourgeteau and Julliand (2010), caecum has higher concentrations of these types of bacteria and therefore may be the cause of the higher PpB values observed when caecal inoculum was used. The differences between inoculum and feed type observed for PpV+IV may have the same causes as the NH3-N differences as stated earlier, since both are related to protein content and proteolysis. Despite that, Hintz et al. (1971) reported higher production of valerate and isovalerate from colonic fluids, possibly causing the higher content observed in faecal inoculum. The ratio between acetate and propionate presented differences for feed type. This difference is a consequence of the slightly lower values of PpA and higher PpP (p<0.05) observed for maize.
The general caecum VFA profile obtained in our study presented lower acetate and butyrate proportions and a higher propionate proportion when compared to the values observed by Vermorel and Martin-Rosset (1997) for animals with a maintenance diet and for feeds with 5% crude fiber (DM%). According to McDonald et al. (2002) concentrate feeds produce less acetate and more propionate. The feeds used in this study were both concentrated feeds, with less than 5% CF (DM %) and so this might explain the differences in VFA distribution observed in this study. When compared the VFA profile from the inoculums after the incubation (Table 5) to the ones before (Table 3), it was observed that PpA decreased and PpP, PpV+IV increased, probably due to the feed composition. PpB increased for caecal inoculum but had a slight decrease for faecal inoculum, probably an effect of the microbial population, showing that caecum may have a higher content on microorganisms that produce butyrate.
The lack of interaction between inoculum source and feed type on all parameters studied except for NH3-N should be highlighted. In our opinion, this is an important
17
result indicating that both inoculum sources show similar tendencies concerning fermentation patterns, at least for our experimental conditions (feed types). Nevertheless, different microbial population present in faeces and caecal contents may explain the differences observed in fermentation kinetics between inoculum sources.
5. Conclusion
This research aimed to study the fermentative patterns and responses of equine caecal and faecal inoculums using the gas production technique aiming to assess the possible use of faeces in detriment of caecal inoculum when investigating the nutritive value of concentrate feeds for horses. Results obtained indicate slightly different fermentation patterns between faecal and caecal inoculums as a result of the different microbial population present in both inoculum sources. Nevertheless, results indicate that faeces may be used as a substitute of caecal fluid in the gas production technique when evaluating the nutritive value and fermentation profile of concentrate feeds, since similar trends were observed for both inoculums types. In this way, more studies should be conducted to assess this possibility. Moreover, the utilization of feeds with different chemical composition (e.g.) fibrous feeds) should also be studied.
6. References
Abdouli, H. and Ben Attia, S., 2007. Evaluation of a two-stage in vitro technique for estimating digestibility of equine feeds using horse faeces as the source of microbial inoculum. Animal Feed Science and Technology 132, pp. 155-162. Andrieu, J., Jestin, M. and Martin-Rosset, W., 1996. Prediction of composition and
nutritive value of hay in horses by NIRS method. In: 45th EAAP Meeting Lillehammer, 26-29 August, Horse Comission, Session-H 4: Nutrition.
Aufrere, J., 1982. Étude de la prévision de la digestibilité des fourrages par une méthode enzymatique. Annales de Zootechnie 31, pp- 111-130.
Awati, A., Williams, B.A., Bosch, M.W., Li, Y.C. and Vestegen, M.W.A., 2006. Use of the in vitro cumulative gas production technique for pigs: An examination of alterations in fermentation products and substrate losses at various time points. Journal of Animal Science 84, pp. 1110-1118.
Beuvink, J.M.W. and Spoelstra, S.F., 1992. Interactions between substrate, fermentation end-products, buffering systems and gas production upon
18
fermentation of different carbohydrates by mixed rumen microorganisms in vitro. Applied Microbiology and Biotechnology 37, pp. 505-509.
Beuvink, J.M. and Kogut, J., 1993. Modeling gas production kinetics of grass silages incubated with buffered ruminal fluid. Journal of Animal Science 71, pp. 1041-1046.
Brooks, J. and Urness, P.J., 1984. Comparison of in vivo and in vitro digestibility of forages by elk. Journal of Animal Science 58, pp. 963-970.
Cheng, K.J., Fay, J.P., Howarth, R.E. and Costerton, J.W., 1980. Sequence of events in the digestion of fresh legumes leaves by rumen bacteria. Applied and Environmental Microbiology 40, pp. 613-625.
Cone, J.W., van Gelder, A.H., Vischer G.J.W. and Oudshoom, L., 1996. Influence of rumen fluid and substrate concentration on fermentation kinetics measured with a fully automated time related gas production apparatus. Animal Feed Science and Technology 61, pp. 113-128.
Conway, E.J., 1950. Microdiffusion. Analysis and volumetric error. 2nd edition, Crosby, Lockwood and Son, London.
Cuddeford, D. and Hughes, D., 1990. A comparison between chromium-mordanted hay and acid-insoluble ash to determine apparent digestibility of a chaffed, molassed hay/straw mixture. Equine Veterinary Journal 22, pp. 122-125.
Czerkawski, J.W. and Breckenridge, G., 1975. New inhibitors of methane production by rumen microorganisms. Development and testing of inhibitors in vitro. British Journal of Nutrition 34, pp. 429-446.
Czerkawski, J.W., 1976. The use of pivalic acid as a reference substance in measurements of production of volatile fatty acids by rumen microorganisms in vitro. British Journal of Nutrition 36, pp. 311-315.
Davies, Z.S., Mason, D., Brooks, A.E., Griffith, G.W., Merry, R.J. and Theodorou, M.K., 2000. An automated system for measuring gas production from forages inoculated with rumen fluid and its use in determining the effect of enzymes on grass silage. Animal Feed Science and Technology 83, pp. 205-221.
de Fombelle, A., Julliand, V., Drogoul, C. and Jacotot, E., 2001. Feeding and microbial disorders in horses: 1-effetcs of an abrupt incorporation of two levels of barley in a hay diet on microbial profile and activities. Journal of Equine Veterinary Science 21, pp. 439-445.
19
de Fombelle, A., Varlourd, M., Goachet, A.G., Jacotot, E., Philippeau, C., Drogoul, C. and Julliand, V., 2003. Characterization of the microbial and biochemical profile of the different segments of the digestive tract in horses given two distinct diets. Animal Science 77, pp. 293-304.
Demeyer, D.I., 1981. Rumen microbes and digestion of plants cell walls. Agriculture and Environment 6, pp. 295-337.
Denek, N., Polat, E., Koncagul, S. and Can, A., 2008. The determination of incubation time and amount of faecal content of horse faeces as inoculum source of digestibility. Determination of forages with in vitro procedure. Journal of Animal and Veterinary advances 7, pp. 698-702.
Desrousseaux, G. Santos, A.S., Pelikaan, W.F., Cone, J.W., Ferreira, L.M.M., Guedes, C.M.F. and Rodrigues, M.A.M., 2010. Effect of collection time on the fermentative activity of equine faeces in the gas production technique. The impact of nutrition on the health and welfare of horses, EAAP scientific series 128, pp. 189-192. Dhanoa, M.S., Lopez, S., Dijkstra, J., davies, D.R., Sanderson, R., Williams, B.A.,
Sileshi, Z. and France, J., 2000. Estimating the extend of degradation of ruminant feeds from a description of their gas production profiles observed in vitro: comparison of models. British Journal of nutrition 83, pp. 131-142.
Ferreira, L.M.M., Garcia, U., Rodrigues, M.A.M., Celaya, R., Dias-da-Silva, A. and Osoro, K., 2007. Estimation of feed intake and apparent digestibility of equines and cattle grazing on heathland vegetation communities using the n-alkane markers. Livestock Science 110, pp- 46-56.
France, J., Dijkstra, J., Dhanoa, M.S., Lopez, S. and Bannink, A., 2000. Estimating the extend of degradation of ruminant feeds from a description of their gas production profiles observed in vitro: derivation of models and other mathematical considerations. British Journal of Nutrition 83, pp 143-150.
France, J., Lopez, S., Kebreab, E., Bannink, A., Dhanoa, M.S. and Dijkstra, J., 2005. A general compartmental model for interpreting gas production profiles. Animal Feed Science and Technology 123-124, pp. 473-485.
Getachew, G., Blümmel, M., Makkar, H.P.S. and Becker, K., 1998. In vitro gas measuring techniques for assessment of nutritional quality of feeds: a review. Animal Feed Science and Technology 72, pp. 261-281.
Gosselink, J.M.J., Dulphy, J.P., Poncet, C., Tamminga, S. and Cone, J.W., 2004. A comparison of in situ and in vitro methods to estimate in vivo fermentable organic
20
matter of forages in ruminants. NJAS – Wageningen Journal of Life Science 52, pp. 29-45.
Groot, J.C.J., Cone, J.W., Williams, B.A., Debersaques, F.M.A. and Lantiga, E.A., 1996. Multiphasic analysis of gas production kinetics for in vitro fermentation of ruminant feeds. Animal Feed Science and Technology 64, pp. 77-89.
Hidayat, Hillman, K., Newbold, C.J. and Stewart, C.S., 1993. The contribution of bacteria and protozoa to ruminal forage fermentation in vitro, as determined by microbial gas production. Animal Feed Science and Technology 42, pp. 193-208. Hintz, H.F., Argenzio, R.A. and Schryver, H.F., 1971. Digestion coefficients, blood
glucose levels and molar percentage of volatile acids in intestinal fluid of ponies fed varying forage grain ratios. Journal of Animal Science 33, pp. 992-995. INRA, 1990. Alimentation des chevaux. W. Martin-Rosset ed. INRA Editions, Paris,
France.
Kern, D.L., Styler, L.L., Leffel, E.C., Weaver, J.M. and Oltjen, R.R., 1974. Ponies vs steers: microbial and chemical characteristics of intestinal digesta. Journal of Animal Science 38, pp. 559-564.
Lan, Y., Williams, B.A., Verstegen, M.W.A., Patterson, R. and Tamminga, S., 2007. Soy oligosaccharides in vitro fermentation characteristics and its effect on caecal microorganisms of young broiler chickens. Animal Feed Science and Technology 133, pp. 286-297.
Lima, S.M., Cabo, A.D. Santos, A.S., Ferreira, L.M. and Rodrigues, M.A.M., Non published. Influência do grau de diluição na atividade fermentativa do inóculo cecal utilizando a técnica da produção de gás.
Lowman, R.S., Theodorou, M.K., Longland, A.C. and Cuddeford, D., 1996. A comparison of equine faeces or caecal digesta as source of inoculum for in vitro fermentation studies using the pressure transducer technique. Animal Science 62, pp. 683.
Lowman, R.S., Theodorou, M.K., Hyslop, J.J., Dhanoa, M.S. and Cuddeford, D., 1999. Evaluation of an in vitro batch culture technique for estimating the in vivo digestibility and digestible energy content of equine feeds using faeces as the source of microbial inoculum. Animal Feed Science and Technology 80, pp. 11-27.
Macheboeuf, M. and Jestin, M., 1997a. Utilization of the gas test method using horse faeces as a source of inoculum. In: in vitro techniques for measuring nutrient
21
supply to ruminants, Proceedings of Occasional Meeting of the British Society of Animal Science, 8–10 July 1997, University of Reading, UK.
Macheboeuf, M., Jestin, M., Andrieu, J., and Martin-Rosset, W., 1997b. Prediction of the organic matter digestibility of forages in horses by the gas test method. In: in vitro techniques for measuring nutrient supply to ruminants, Proceedings of Occasional Meeting of the British Society of Animal Science, 8–10 July 1997, University of Reading, UK
Martin-Rosset, W., Andrieu, J., Vermorel, M. and Dulphy, J.P., 1984. Valeur nutritive des aliments pour le cheval. In: Jarrige, R., Martin-Rosset, W. (Eds.), Le Cheval. Reproduction, Sélection, Alimentation, Exploitation, INRA, Paris, pp. 209-238. Martin-Rosset, W., Andrieu, J. and Jestin, M., 1996a. Prediction of the organic matter
digestibility (OMD) of forages in horses from the chemical composition. In: 47th EAAP Meeting, Lillehammer, 26-29 August, Horse Commission, Session- h 4. Nutrition, p 4.
Martin-Rosset, W., Andrieu, J. and Jestin, M., 1996b. prediction of the organic matter digestibility (OMD) of forages in horses by the pepsin-cellulase method. In: 47th EAAP Meeting, Lillehammer, 26-29 August, Horse Commission, Session- h 4. Nutrition, p 4.
Martin-Rosset, W. and Martin, L., 2012. Principes de la nutrition des chevaux. In: Martin-Rosset, W., (coord), Nutrition et alimentation des chevaux. Nouvelles recommendations de l’Inra. 1st edition, Versailles Cedex, France, pp. 13-80. Mauricio, R.M., Mould, F.L., Dhanoa, M.S., Owen, E., Channa, K.S. and Theodorou,
M.K., 1999. A semi-automated in vitro gas production technique for ruminant feedstuff evaluation. Animal Feed Science and Technology 79, pp. 321-330 Mauricio, R.M., owen, E., Mould, F.L., Givens, I, Theodorou, M.K, France, J., Davies,
D.R. and Dhanoa, M.S., 2001. Comparison of bovine rumen liquor and bovine faeces as inoculum for an in vitro gas production technique for evaluating forages. Animal Feed Science and Technology 89, pp. 33-48.
McDonald, P., Edwards, R.A., Greenhalgh, J.F.D. and Morgan, C.A., 2002. Animal Nutrition. Peaeson Education Limited, Edinburgh Gate, Harlow, UK, 6th edition, pp. 179-195.
Menke, K.H., Raab, L., Salewski, A., Steingass, H., Fritz, D. and Schneider, W., 1979. The estimation of the digestibility and metabloizable energy content of ruminant
22
feedingstuffs from the gas production when they are incubated with rumen liquor in vitro. Journal of Agriculture Science 93, pp. 217-222.
Miraglia, N. and Tisserand, J.L., 1985. Prévision de la digestibilité des fourrages destines aux chevaux par dégradation enzymatique. Annales de Zootechnie. 34, pp. 229-236.
Miraglia, N., Bergero, D. bassano, B. Tarantola, M. and Ladetto, G., 1999. Studies of apparent digestibility in horses and the use of internal markers. Livestock Production Science 60, pp- 21-25.
Mould, F.L., Kliem, K.E., Morgan, R. and Mauricio, R.M. 2005. In vitro microbial inoculum: a review of its function and properties. Animal Feed Science and Technology 123-124, pp. 31-50.
Murray, J.-A.M.D., Longland, A. and Moore-Colyer, M., 2006. In vitro fermentation of different ratios of high-temperature dried lucerne and sugar beet pulp incubated with an equine faecal inoculum. Animal Feed Science and Technology 129, pp. 89-98.
Murray, J.-A.M.D., Longland, A. and Dunnet, C., 2008. Effect of yeast supplementation on the in vitro fermentation of high-temperature dried lucerne incubated with an equine faecal inoculum. Animal Feed Science and Technology 146, pp. 149-159. Oliveira, C.H. de, Almeida, F.Q. de, Filho, V.F. do N., Almeida, M.I.V. de, Corassa, A.,
Lopes, B.A. and Macedo, R., 2003. Estimativa da digestibilidade aparente de nutrientes em dietas para equinos, com o uso de óxido crômico e indicadores internos. Revista Brasileira de Zootecnia 32 (Suppl. 1), pp. 1681–1689
Ordakowski, A.L., Kronfeld, D.S., Holland, J.L., Hargreaves, B.J., Gay, L.S., Harris, P.A., Dove, H. and Sklan, D., 2001. Alkanes as internal markers to estimate digestibility of hay or hay plus concentrate diets in horses. Journal of Animal Science 79, pp. 1516-1522.
Ørskov, E.R., DeB Hovell, F.D. and Mould, F., 1980. The use of the nylon bag technique for the evaluation of feedstuffs’. Tropical animal production 5, pp. 195-213.
Peiretti, P.G., Meineri, G., Miraglia, N., Mucciarelli, M. and Bergero, D., 2006. Intake and apparent digestibility of hay or hay plus concentrate diets determined in horses by the total collection of feces andn-alkanes as internal markers. Livestock Science 100, pp. 189–194.
23
Pell, A.N. and Schofield, P., 1993. Computerized monitoring of gas production to measure forage digestion in vitro. Journal of Dairy Science 76, pp. 1063-1073. Robertson, J.B. and Van Soest, P.J., 1981. The detergent system of analysis. W.P.T.
James, O Theander, Editors, The Analysis of Dietary Fiber in Food, Marcel Dekker, Chapter 9, pp. 123-158.
Rodrigues, M.A.M., Cone, J.W., Ferreira, L.M.M., Blok, M.C. and Guedes, C.V.M., 2009. Relationship between in situ degradation kinetics and in vitro gas production fermentation using different mathematical models. Animal Feed Science and Technology 151, pp. 86-96.
Rymer, C., Huntington, J.A., Williams, B.A. and Givens, D.I., 2005. In vitro cumulative gas production techniques: History, methodological considerations and challenges. Animal Feed Science and Technology 123-124, pp. 9-30.
Sadet-Bourgeteau, S. and Julliand, V., 2010. Equine microbial gastro-intestinal health. The impact of nutrition on the health and welfare of horses, EAAP scientific series 128, pp. 161-181.
Sales, J., 2012. A review on the use of indegestible dietary markers to determine total tract apparent digestibility of nutriente in horses. Animal Feed Science and Technology 174, pp. 119-130.
Santos, A.S., Abreu, J.M. and Dias-da-Silva, A.A., 2005. Apparent digestibility of mixed diets in horses determined by acid-insoluble ash and acid detergent lignin as internal markers. Pferdeheilkunde 21, pp. 51-52.
Santos, A.S., Rodrigues, M.A.M., Bessa, R.J.B., Ferreira, L.M., Martin-Rosset, W., 2010. Understanding the equine cecum-colon ecosystem: current knowledge and future perspectives. Animal 5, pp. 1-9.
SAS 1999. SAS/STAT User’s guide, version 8. SAS Institute, Cary, NC, USA.
Solomonson, A., A. Theander, and E. Westerlund. 1984. Chemical characterization of some cereal whole meal and bran fractions. Swedish Journal of Agricultural Research 14, pp.111–117.
Steingass, H., 1983. Bestimmung des energetischen Futterwertes von wirtschaftseigenen Futtermitteln aus der Gasbildung bei der Pansenfermentation in vitro. Ph.D. Thesis, University of Hohenheim, Germany.
Stern M.D., Bach, A. and Calsamiglia, S., 1997. Alternative techniques for measuring nutrient digestion in ruminants. Journal of Animal Science 75, pp. 2256-2276.
24
Tilley, J.M.A. and Terry, R.A., 1963. A two stage technique for the in vitro digestion of forage crops. Journal of the British Grassland Society 18, pp. 104–111.
Theodorou, M.K., Williams, B.A., Dhanoa, M.S., McAllan, A.B. and France, J., 1994. A simple gas production method using a pressure transducer to determine the fermentation kinetics of ruminant feeds. Animal Feed Science and Technology 48, pp. 185-197.
Van Laar, H., Van Straalen, W.M., Van Gelder, A.H., De Boever, J.L., D’heer, B., Vedder, H., Kroes, R., de Bot, P., Van Hees, J. and Cone, J.W., 2006. Repeatability and reproductibility of an automated fas production technique. Animal Feed Science and Technology 127, pp. 133-150.
Van Soest, P.J., Robertson, J.B. and Lewis, B.A., 1991. Methods for dietary fiber, neutral detergent fiber, and nonstarch polysaccharides in relation to animal nutrition. Journal of Dairy Science 74, pp. 3583-3597.
Vermorel,M. and Martin-Rosset, W., 1997. Concepts, scientific bases, structure and validation of the French horse net energy system (UFC). Livestock Production Science 47, pp. 261-275.
Willard, J.G., Willard, J.C., Wolfram, S.A. and Baker, J.P., 1977. Effect of diet on cecal pH and feeding behavior of horses. Journal of Animal Science 45, pp. 87-93. Williams, B.A., 2000. Cumulative gas-production techniques for forage evaluation.
Forage evaluation in ruminant nutrition, CABI publishing, UK, 1st edition, pp. 189-213.
Wolin, J.M., 1960. A theoretical rumen fermentation balance. Journal of Dairy Science 43, pp. 1452-1459.
Wolter, R., Durix, A., Gouy, D., Letourneau, J.-C., Carcelen, M. and Gouy, J., 1980. Paramètres biochimiques et digestibilités dans le duodenum chez le poney recevant un même aliment complet granule ou semi expanse. Annales de Zootechnie 29, pp. 305-315.