Satisfaction and Service Quality and Life in the institutions for seniors
Joaquim Antunes1,
Madalena Malva2
Vânia Pereira3
Abstract
The socio-demographic changes justified the increase number of studies related to population aging; the increase in the elderly population has led to many social changes, which seek through new and improved services to meet the needs of this population.
This study sought to understand user satisfaction in elderly homes adding two constructs: the quality of Parasuraman services, Zeithaml and Berry (1988) and the quality of life of Kane (2003) These play an important role in the management of organizations having a significant weight in the strategic and operational decisions that influence the quality of services provided (Hespanhol, 2008; Escoval & Ferreira, 2010). For the first time, these constructs were analyzed together in order to see whether the part of the services or the part of the quality of life contribute more to the satisfaction of residents in institutions for seniors.
The study was carried out to 209 users institutionalized in elderly homes, protected by the Social Security or private nature in Viseu county.
The results allow us to verify a set of relationships between variables related to quality of service and the quality of life in user satisfaction.
Keywords: Institutions for seniors; service quality; quality of life; satisfaction;
Main theme: Wellbeing; Health & Ageing
1
Centre for the Study of Education, Technologies and Health - Polytechnic Institute of Viseu, Portugal. E-mail:
2 Centre for the Study of Education, Technologies and Health - Polytechnic Institute of Viseu, Portugal. E-mail: [email protected] 3 Master Student at Higher School of Technology and Management - Polytechnic Institute of Viseu, Portugal, Email:
INTRODUCTION
Currently, about 87% of people reach the age of 65. This demographic aging is visible in the increase in the percentage of elderly in the population, or by increasing the number of people aged 65 and over per 100 persons under 15 years (Rosa, 2012).
Population aging is caused by two factors, the reduction in mortality and reducing fertility, says the same author. "Between 1960 and the present, the number of young people has fallen a million (...) and the number of elderly increased by 1.3 million." It was in 2000 that for the first time in the history of Portugal, the group "65 and over" had more people than the group of young people (Rosa, 2012).
There is a general concept for the social responses, but each is of a particular nature which aims to meet the growing needs of society, although in recent years have increased the number of networks for the elderly services, these fall short of the population's needs (Trincadeiro, 2009).
To Cardão (2009) the institutionalization of the elderly in nursing homes comes as a residential option for people, who for various reasons don't find in the community a satisfactory answer to its needs.
The proper functioning of services will allow a more individualized follow-up and provide interactions with the elderly, and access to better basic care as food and hygiene.
The results of Census 2011 indicate that there are 2,023 million people over 65 living in Portugal, equivalent to 19% of the population. About 60% of these people live alone (400,964), while that 804,577 elderly live with other seniors, a total of 1 million 200 thousand elderly people. This increased 28% over the last ten years, so institutions geared to the care of the elderly are of an increasingly important.
According to Kane assessing the quality of life of elderly residents in elderly homes can serve different purposes, namely to be included in the equipment regulatory process, used for improved internal quality, or have the results available for consultation to potential customers (Kane, 2004).
To help managers in their decision-making is important to assess the satisfaction of its users, in this case we consider relevant an assessment with regard to the quality of services that nursing home offers and the quality of life they can have in the institution.
This study therefore aims to help the institutions to increase the quality of services provided and the lives of users, to ensure the best conditions for the residents.
Since 2007, the Sheltered Housing equipment in Portugal grew by 33% and had an occupancy rate of 97%. Currently the concern is not only about assessing the quality of the provision of care to users of elderly homes, but also with the quality of life of users in such equipment (Kane, 2005).
Kane is not the only author concerned with the concept of quality of life. This concept has gained increasing importance in the social and health sciences (Hortelão, 2003), as well as in political and government organizations.
Nursing homes in its aspects of support to the elderly, are one of the answers most represented (33%) in the new answers that came operation in 2011.
In our study it was considered that "the owners or management companies are grouped according to the legal nature in profit entities and non-profit entities. Non-profit organizations include the Private Institutions of Social Solidarity (IPSS), other non-profit entities (entities assimilated to IPSS and other private non-profit organizations), the official entities, pursuing social action purposes, the social Business Services and the Santa Casa da Misericordia de Lisboa ".
According to the 2010 report (Team Studies and Policies of Social Security, 2010) about 70% of the entities of social facilities in mainland Portugal are suitable for the non-profit sector, and 61.4% are IPSS.
By December 2010 there were in Portugal "more than 5,800 entities that own social facilities" (Study Team and Policy of Social Security, 2010). The equipment’s of the solidarity network (non-profit entities) remain the structuring pillar of the social facilities and services network with 81.7% of the equipment. "
In Portugal, we observed an increase in the rate of aging of population 102 to 129, which means that per 100 young there are currently 129 elderly. In addition to these data, an analysis show that the central region has index of 164, one of the highest in the country, only surpassed by the Alentejo (179).
Also, data presented by the UN, reported that for 2050 the number of elderly remain higher when compare with the number of young people, which is reflected in the increase in the aging index, in the most drastic scenario could reach 395 elderly per 100 young, quadrupling the amount recorded in 2000.
Elderly people have referred to as "the fourth age" entered the group with 80 and more years is almost half a million, a number that has quadrupled in Portugal between 1971 and the present (Rosa, 2012).
Portugal presents an aging population faster than the European average (Baker, 2003), example is the average life expectancy has been increasing, since the decade of 70. The average life expectancy was in 2003, 80.4 years for women and, in 2009, 81.74 years, projecting 84.7 years to 2050. For men the phenomenon is similar with an average life expectancy of 74 years in 2003, 75.49 in 2009 and in 2050, 79.
Forecasts suggest that Portugal, in 2050, will be the fourth country with the highest percentage of elderly in the European Union.
Our study will focus on Viseu county. Data released by INE indicate that in Viseu county live 99.274 people (i.e. 26.29% of the inhabitants of the district), among which 18.73% are over 65 years old and 15.27% are children or young people. The data indicate that per 100 young residents in Viseu are 122 elderly.
To meet the needs of this population in Viseu district there are, currently, 105 equipment with the valence of sheltered housing, with capacity for 4.346 users. Regarding Viseu county there are 20 equipment’s with valence of nursing home for up to 1042 users.
2. Theoretical Model - Quality and perceived satisfaction in social responses
When we study the relationship between an institution and its users is inevitable seek to realize their satisfaction and the factors contributing to it. This aspect becomes even more relevant because satisfaction is regarded as one of the prerequisites for the success of an organization, whether is lucrative nature or not.
Customer satisfaction is seen by many authors as "a judgment about the attributes of a service, or the service itself, which guarantee a pleasure level related to consumption (Javadein, Khanlari, & M., 2008); (Leeweun, Quick, and & Daniel, 2002), and (Lovelock, 2001).
Consumers buy services with a view to resolving specific needs and therefore the evaluation of these services depend on the expectations created (Lovelock, 2001).
Parasuraman, Zeithaml and Berry (1988) made an important contribution to the assessment of quality in service organizations through Servqual scale. The authors distinguish between the provision of a product and the services products. In the first case, the quality is assessed on two main components, namely the technical quality of service and functional quality.
The ServPerf scale appeared to overcome the limitations pointed out by some authors to ServQual. According to Cronin and Taylor (1992) to measure the quality of a service can only consider the perceptions, not considering the expectations consumer prior, since the quality of service is understood by the authors as a consumer attitude, and this attitude will depend on customer's perceptions upon consumption.
Cronin and Taylor (1992) admit that the 22 items presented by Parasuraman, Zeithaml and Berry in 1988 to represent the dimensions of service quality are well founded.
The study presented here is located in the second time, as users of homes are already institutionalized, so it is not possible to collect expectations prior to the experience.
The ServPerf scale is based on Servqual scale Parasuraman, Zeithaml and Berry (1988) but presents as a more precise scale to evaluate the quality of a service. Thus, Cronin and Taylor (1992) removed the 22 questions, the ServPerf model, relating to perceptions and adapted the weights related to the importance attached to each dimension, creating three items linked with the perceptions and expectations in the original scale. The quality of service, satisfaction and future purchase intent are now present in three items with a response Likert scale.
The author Rosaline Kane (2004) introduces eleven dimensions to measure quality of life. Kane argues that the quality of life of nursing homes results from four factors: the health of the user; the social situation (which includes family support outside of home); personality and care (environment offered to the user) (Kane, 2003).
Currently, there are still few studies that analyze the overall quality of life associated with living in a Home, appearing here researcher Rosaline Kane with a pioneering study. The investigation began in 1998 when the Center of Medicare and Medicaid Services attributed to Rosalie Kane team, of School of Public Health - University of Minnesota, the study of Measurement, Indicators and Improvement of the Quality of Life in Nursing Homes, (Kane, 2004), which had as its main objective the development of quality evaluation measures of life for users of senior homes, highlighting psychological and social factors (Kane, 2003b). Born from here the Quality of Life Scales for Nursing Home Residents (Kane, 2003a), an instrument to assess the quality of life of institutionalized elderly, which allows even compare, through the results, the quality of life among elderly homes.
The researcher Rosalie Kane and his team selected 11 areas of quality of life, considered fundamental and based on domains compiled by various researchers and conducting focus groups (Kane, 2005). The areas are Security, Physical Comfort, Satisfaction with Food, Significant Activities, Relationships, Functional Skills, Dignity, Privacy, Individuality, Autonomy and Spiritual Welfare (Kane, 2001). For our study we were not considered the spiritual welfare, as our analysis leaves aside the religious issue addressed by this concept.
This study aims to introduce a new approach to finding satisfaction, found by quality perceived in institutions for seniors. Thus, this study aims to gather and look through the results known construct of Quality of Service, presented by ServQual and in this case adapted to ServPerf, as our respondents fail to evaluate differently the time of expectations from the moment of perceptions. At the same time looking for how to the residents evaluate their quality life, construct presented by Rosaline Kane.
The goal is not just to understand whether the institution offers good services, but if they are complemented by a care in relation to their own experiences and how they feel this phase of their lives.
3. Methodology
In this study we have chosen to put all questions in Likert scale of 5 points and hold the bridge between the SerQual/ServPerf and the Quality of Life Scale combining the points evaluated in both.
The study applied concepts and quality models to the responses of these institutions in Viseu municipality, overseen by Social Security or private nature. To this was referred to Social Charter, available online and updated every year by Social Security. In 2012, the county had 20 institutions with home valence. It was necessary to establish contact with each in order to obtain authorization to carry out the questionnaires to users. The institutions present in the county, 17 agreed to participate in study
A total of 1.042 users in 2012, the study allowed to question 209 users fit in nursery homes of Viseu county. Data collection was based on the characterization of the respondents, including their socio-economic situation, the assessment of quality of service and the quality of life in the perspective of the user.
4. Results
The sample is comprised by 31.1% of men and 68.9% women; 13% are single, 15.9% are married or union indeed, 3.8% are divorced and 67.3% are widowed.
The average age of respondents is 82 years, the youngest is 42 years and oldest is 100 years. As regards the time spent in the institution the average is 36.9 months which is equivalent to about three years.
The cost per room, excluded here any extra expense as medication, diapers, travel consultations, among others; we noticed a minimum of 245 Euros and a maximum of around 1530 Euros, and the average value of 672 Euros.
The majority of respondents, 38.8%, have the 4th grade and 46.9% are illiterate
or have not completed the 4th grade, 6.2% have the 2nd cycle of basic education, 2.4%
have the 3rd cycle of basic education, and others 2.4% the 12th grade, only 3.3% have a
college degree.
Most respondents, 71.8% have a pension or retirement pension, 14.1% have a disability or survivor pension and 11.1% indicated another source of income.
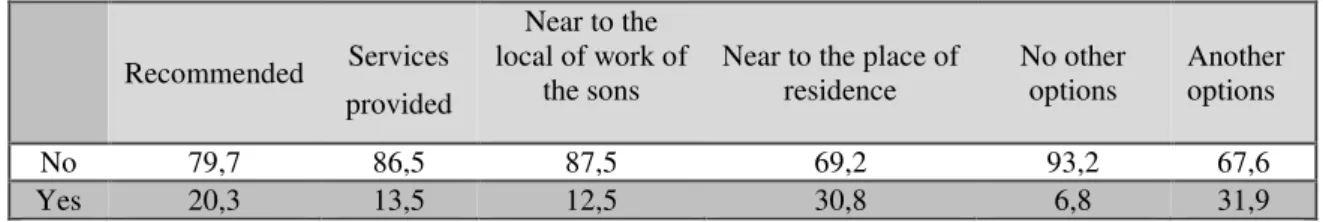
Table 1 presents six possible reasons for choosing a home.
Table 1 - Lar choice of Reasons
Recommended Services
provided
Near to the local of work of
the sons
Near to the place of residence No other options Another options No 79,7 86,5 87,5 69,2 93,2 67,6 Yes 20,3 13,5 12,5 30,8 6,8 31,9
20.3% of residents indicated that chose the home because someone recommended it. The proximity of the residence to the elderly home was indicated by 30.8%, and the proximity to the son’s workplace was decisive for 12.5%. Note that 31.9% of respondents said another reason to choose the home, including the existence of a vacancy, have family or spouse already institutionalized in space, have been a widow(er), known people that working in the institution, by illness, because it was home alone, by choice of the sons, the price or already attending the day center.
It should also be noted that the sons or other family members have in many cases a high weight in the choice of the home, fitting them the decision.
It was found that 75.4% of users have a less than 500 Euros income, and only 12.6% indicated above income of 776 Euros.
We wanted to know as the users occupy their time: television wins, 68.6% says they sees TV very often or often. It was also mentioned by the elderly others activities, some carried out by the institution, as crafts, gymnastics or walkways. In this case 61.2% of respondents regard these activities as very common and 17.9% as frequent.
Some clients report tours to the city of Viseu, weekends with the family, visits to the church, recitation of the Rosary and prayers, movie viewing or internet use as alternative activities.
With regard to satisfaction demonstrated by users when asked directly, it was found the following results:
Table 2 – Satisfaction
1 2 3 4 5
I`m satisfied with this nursing home 14,3% 15,0% 28,4% 19,1% 19,8% Use the services of this nursing home was the right decision 23,8% 15,0% 26,1% 30,3% 17,1% The nursing home provides me everything I need 11,9% 20,0% 19,3% 19,1% 20,8% I went do pick this nursing home 26,2% 25,0% 13,6% 15,8% 20,9% I recommend this nursing home to friends ans family 23,8% 25,0% 12,5% 15,8% 21,3%
It appears that the majority of the users, 38.9%, are satisfied or very satisfied and 29.3% are dissatisfied by little satisfied. When asked about the decision to enter a nursery home, 47.4% agree or strongly agree that it was the right decision.
48.8% would not recommend the home to friends and family, while 37.1% advise their acquaintances to enter the institution. Recalling that some users would not choose the home because rather be home.
The six variables of the construct satisfaction obtained, on average, more than four points, with the item "use the services of this home was the right decision" to get the lowest average (4.34).
We try to find the key dimensions that lead to user satisfaction through a factor analysis of the variables. We chose to perform 11 factor analyses, based on the dimensions shown in the literature. The results of the factor analysis will allow validate the dimensions most relevant to subsequently measure the satisfaction.
Table 3 shows the KMO values as well the p-values to the different Bartlett sphericity test.
Table 3
Scales KMO Bartlett's Test
(p-value) Total variance explained Services ,701 ,000 59.3% Staff ,653 ,000 62.3% Privacy ,653 ,000 72.4% Dignity ,609 ,000 65.3% Activities ,715 ,000 48.%7 Relationships ,627 ,000 48.5% Autonomy ,537 ,000 61% Food ,627 ,000 47.5% Safety ,656 ,000 43.4% Individuality ,639 ,000 55.7% Satisfaction ,837 ,000 61.5%
The values obtained shows that the factor analyses are appropriate do deal with the variables.
At first was carried out a factor analysis to the scale services, which resulted in six factors.
Table 4: Services
Component
Communication Services Readiness Mobility Comfort Rest
Not always the institution's objectives correspond to the best interests of customers.
0,78
When I want information, institution employees have availability 0,76 There is no response readiness to my questions. 0,71 The institution don’t devotes me personalized attention. 0,68
The Institution's facilities are attractive. 0,73 The facilities meet the needs of the institution (easy movement…) 0,72
The institution is reliable. 0,64
Materials, equipment and means of transportation are suitable for the elderly.
0,59
The opening hours of the service are of my knowledge and must be met.
0,73
The schedule of the institution corresponds to my needs 0,72 The institution communicates accurately the information about
the operation of services.
0,72
In case I have any questions or problems, the institution help in its resolution.
0,61
I go out when I want 0,74
I can walk alone easily in the room. 0,74
I can easily get to a bathroom. 0,67
I tend to be disturbed by noises in different areas of the nursery home.
0,78
I often stay in pain because I´m always in the same position. 0,67
I can sleep well here. 0,8
Table 5: Staff
Components
Attention Skills Dress Code I think the staff did not have exact knowledge of my needs (…) 0,822
I do not expect the staff of the institution dedicate me personal attention. 0,705 Employees of the institution do not always show willingness to help me. 0,695 Employees do not have the support of the institution required the functions
they perform.
0,662
I feel confident about the competence of employees. 0,823 0,812 0,641 I have confidence in the staff and they like what they do.
The staff are polite and correct.
Table 6: Quality of Life
Components
Privacy Dignity Activities Relation Autono Free will Food Safety Individ I can be alone in somewhere with a visit, or
another person 0.91
0,84 0,81 I find a place to stay alone
I can make a phone call without anyone being around.
Employees hear me when I want to say
something. 0,76
I am treated with respect. 0,76 Employees respect me when I do not want
to be seen 0,66
The institution has regularly new activities. 0,8 I like the activities done by the nursery
home. 0,76
Usually the activities planned are executed. 0,76 I tend to be inserted in recreational
activities outside the facilities. 0,61 There are activities, in addition to religious,
during the end-of-week. 0,51
It's easy to make friends here. 0,817
Some patients are my close friends. 0,755 Some members of the staff are friends. 0,727
I go to bed at the time you want. 0,79
I get up in the morning to the time you
want. 0,74
I decide the clothes that I want to wear. 0,51
I can change things that do not like. 0,94
I like the food of the nursery home. 0,84
I can eat my favorite dishes here. 0,78
I like to arrive at mealtimes. 0,71
I have felt fear for the way I was treated or
another user. 0,717
My clothes are damaged or lost when they
go to wash. 0,661
If I feel bad a nurse or doctor quickly
comes to see me. 0,63
I feel that my goods are safe in the nursery
home. 0,62
My personal interests and wishes are
respected in the Home. 0,77
Employees know what I like. 0,75
Employees are interested in what I did in
life. 0,55
The other patients know me. 0,51
All the variables that make up each of the factors are strongly correlated in the same direction (positive). The various items are aggregated into 18 factors.
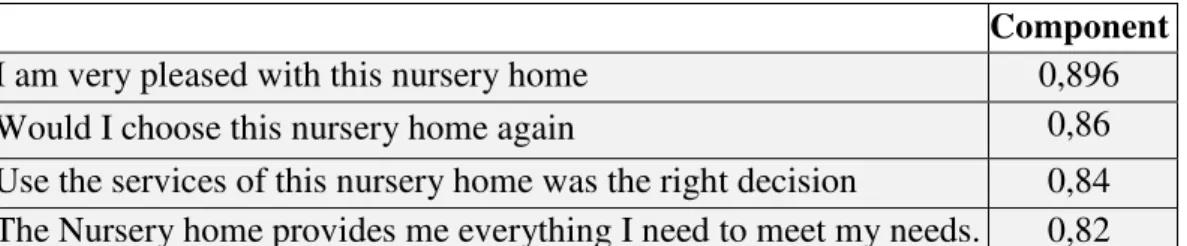
Finally we conducted a factor analysis for satisfaction. Table 7: Satisfaction
Component
I am very pleased with this nursery home 0,896
Would I choose this nursery home again 0,86
Use the services of this nursery home was the right decision 0,84
The Nursery home provides me everything I need to meet my needs. 0,82
Once we found the factors we went looking for the existence of differences with regard to some socio demographic characteristics.
As the normality assumption is not verified, we used the nonparametric test. The following table shows the results of Mann-Whitney test for food, privacy and dignity factors. Table 8 n mean (sd) p_value Food Gender Male 65 0.195(1.019) 0.027* Female 142 -.252 (0.982) Time in the nursery home <3 years 134 0.133(0.918) 0.007* > 3 years 65 -0,277(1.062) Privacy Price per room <500 25 -0146(1.208) 0.02* >500 66 0.293 (0.876) Dignity Price per room <500 25 -0.065(0.738) 0.019* >500 66 0,183(1.017) * 5% significance level.
From the table above we noticed that relative to the food there are differences in relation to gender and the length of stay in the institution. It is observed that, on average, men are more demanding and well the users who are in the home at less time.
With regard the price we find differences in the privacy and dignity; the people who pay more, on average, are more demanding
The table below contains the results of the Kruskal-Wallis test for dignity, rest, free choice, privacy and dignity.
Table 9
* 5% significance level.* * 6% significance level.
With regard to dignity is concluded that there are differences among the population with income between 250 and 500 Euros and the population with income above 500 Euros, with the last more demanding. Regard to qualifications, where detected differences between the population that can read and write and the population who have the 2nd or 3rd cycle, with the last one more demanding.
As regards the rest and free will we can see that there are differences among the population with less than 250 euros income and population with income exceeding 500 euros, the rest is more valued by the population with the lowest income, and the free will is more valued by the population with higher incomes.
Privacy is seen differently depending on income and educational background. There are differences among the population with income between 250 and 500 euros
n Mean (SD) Value test statistic p-value Dignity Income <250 45 0.067 (1.004) 6.115 0.047* [250, 500] 54 -0.164(1.187) >500 33 0.315 (0.616) Qualifications Illiterate 52 .125(.663) 9.445 0.051**
Read and write 35 -.524(1.532)
Primary school 75 .124(.706) 2nd or 3rd cycles 16 .08(1.49) Other 11 .149(0.651) Rest Income <250 34 0.239(0.685) 6.867 0.032* [250, 500] 42 -0.372(1.08) >500 30 0.059 (0.943) Free will Income <250 44 -.352(.986) 7,308 0.026* [250, 500] 53 .0005(1.003) >500 31 0.257(0.88) Privacy Income <250 44 .153(.760) 6.105 0.047* [250, 500] 52 -.017(1.029) >500 34 0.429(0.677) Qualifications Illiterate 52 -0.294(1.027) 22.182 0.000*
Read and write 35 -0.294(1.141)
Primary school 75 .121(.956)
Second or 3rd cycles 16 .567(.424)
and the population with income higher than 500 Euros, privacy is more valued by the population with higher incomes. Regarding the qualifications, illiterate people or people without diploma value equally the privacy, but there are differences between these two populations and all others, with the value of privacy increasing, on average, with qualifications.
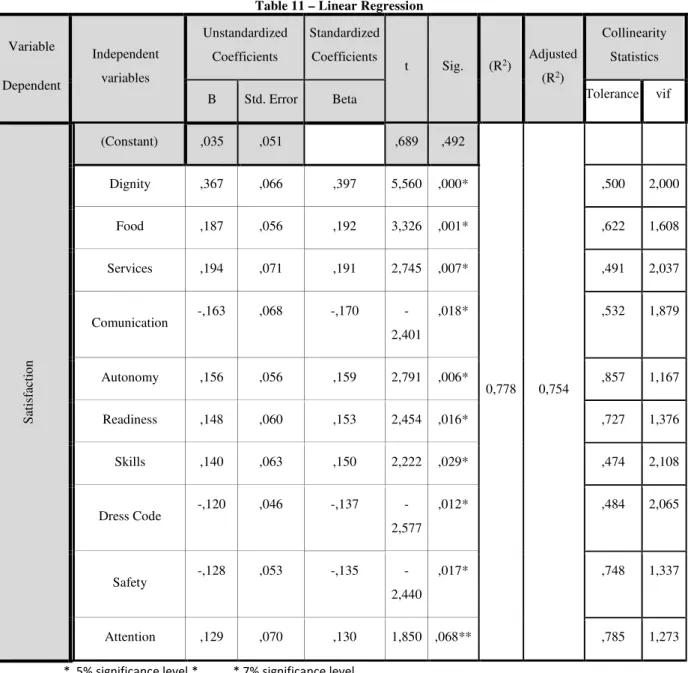
Then, was applied a linear regression model to determine the factors that have a significant impact on the satisfaction. We can see in the following table, Pearson correlation coefficient is 0.882, which indicates a strong linear relationship between variables; 77.8% of the variation in satisfaction is linearly explained by the remaining 10 independent variables.
Table 11 – Linear Regression Variable Dependent Independent variables Unstandardized Coefficients Standardized Coefficients t Sig. (R2) Adjusted (R2) Collinearity Statistics
B Std. Error Beta Tolerance vif
S at is fa ct io n (Constant) ,035 ,051 ,689 ,492 0,778 0,754 Dignity ,367 ,066 ,397 5,560 ,000* ,500 2,000 Food ,187 ,056 ,192 3,326 ,001* ,622 1,608 Services ,194 ,071 ,191 2,745 ,007* ,491 2,037 Comunication -,163 ,068 -,170 -2,401 ,018* ,532 1,879 Autonomy ,156 ,056 ,159 2,791 ,006* ,857 1,167 Readiness ,148 ,060 ,153 2,454 ,016* ,727 1,376 Skills ,140 ,063 ,150 2,222 ,029* ,474 2,108 Dress Code -,120 ,046 -,137 -2,577 ,012* ,484 2,065 Safety -,128 ,053 -,135 -2,440 ,017* ,748 1,337 Attention ,129 ,070 ,130 1,850 ,068** ,785 1,273
The model is significant, p-value≈0.000, and all the variables considered are significant to the level of 0.05, except the factor attention that has a significance level of 7%.
Model assumptions: the residuals are independent (Durbin-Watson: 2.051), with normality distribution (p-value≈0.2) with mean zero (p-value = 1.000) and constant variance (p-value≈0.000). A VIF below 10 shows that there isn´t no multicollinearity problems.
Therefore satisfaction is influenced positively, and in descending order, by Dignity, Food, Services, Communication, Autonomy, Readiness, Skills, Dress Code Safety and Attention, note that communication and the Dress Code have a negative influence.
5 Conclusions
As mentioned, the aim of this study was to understand the influence that the quality of services and life in institutions for seniors have in the overall satisfaction of its residents.
Factor analysis suggested the existence of 18 factors that could influence the satisfaction. Then we tried to know if socio economic characteristics influence the perception of factors. Thus, men are more demanding in relation to the food. The more increases the residence time in the home, the lower is the satisfaction with the food.
As regards the price paid it was observed that users who pay more than 500 euros are more demanding with regard to dignity and privacy. Rest is more valued by those who receive less, while free will is valued by users with higher incomes.
On the other hand, qualifications increase the level of demand with privacy. The highest the amount paid, more demanding are the residents with the comfort, the skills of employees and activities.
The linear regression model showed that satisfaction is explained by: Dignity, Food, Services, Communication, Autonomy, Readiness, Skills, Dress Code, Security and attention.
Bibliography
1. Cardão, S. (2009). O idoso institucionalizado. Lisboa: Coisas de ler.
2. Cronin, J. J., & Taylor, S. A. (1992). Measuring Service Quality: A Reexamination and extension. Journal of Marketing, Vol. 56, p. 13.
3. Escoval, A., & Ferreira, P. (Maio-Junho de 2010). Desafios em tempos de crise. Revista Portuguesa de Clínica Geral, p. 264-270.
4. Hespanhol, A. (2008). Monitorização da satisfação dos utentes do Centro de Saúde São João – 2007, Biblioteca - Universidade do Porto: http://biblioteca.med.up.pt/ 5. Hortelão, A. P. (2003). Envelhecimento e qualidade de vida: Estudo comparativo de
idosos residentes na comunidade e idosos institucionalizados na região de Lisboa. Lisboa: Universidade Aberta.
6. Javadein, S. R., Khanlari, A., & M., E. (2008). Customer loyalty in the sport services industry: the role of service quality, customer satisfaction, commitment and trust. International Journal of Human.
7. Kane, R. (2001). Long-Term Care and a Good Quality of Life: Bringing Them Close Together. The Gerontologist, 293-304.
8. Kane, R. (2003b). Definition, Measurement, and Correlates of Quality of Life in Nursing Homes: Toward a Reasonable Practice, Research, and Policy Agenda. The Gerontologist, 28-36.
9. Kane, R. B. (2004). Using Resident Reports of Quality of life to Distinguish among Nursing Homes. The Gerontologist, 624-632.
10. Kane, R. K. (2003). Quality of Life Measures for Nursing Home Residents. Journal of Gerontology: Medical Sciences, 240-248.
11. Kane, R. K. (2005). Proxy Sources for Information on Nursing Home Residents' Quality of Life. Journal of Gerontology, S318-S325.
12. Kotler, P., & Keller, K. (2008). Marketing Management (13ed.). New Jersey: Pearson Education, Inc.
13. Leeweun, L., Quick, S., and Daniel, K. (2002). The sport satisfaction model: a conceptual framework for understanding the satisfaction of spectators. Sport Management Review, 99-128.
14. Lovelock, C. (2001). Services Marketing. People, Technology, Strategy (4ed.). Upper Saddle River, New Jersey: Prentice Hall.
15. Parasuraman, A., Zeithaml, V. A., & e Berry, L. L. (1985). A conceptual model of service quality and its implications for future research. Journal of marketing, Vol. 49, 41-50.
16. Rosa, M. J. (2012). O envelhecimento da sociedade portuguesa. Lisboa: Fundação Francisco Manuel dos Santos.
17. Trincadeiro, M. L. (2009). Cuidados continuados: Evoluir no cuidar. Lisboa: Instituto São João de Deu.
18. Zeithaml, V. A. (1993). The Nature and Determinats of Customer Expectations