Agriculture and climate change are closely related. In this report, the European Conservation Agriculture Federation (ECAF) offers its experience and knowledge on how the agricultural sector can respond to climate change through Conservation Agriculture (CA). This experience is based on the development of several European (LIFE) public-funded projects based on the implementation of CA in Europe, and on a literature review on the topic. This document aims to serve as a basis for decision-making based on science and agricultural experimentation in Europe.
CLIMATE CHANGE AND AGRICULTURE
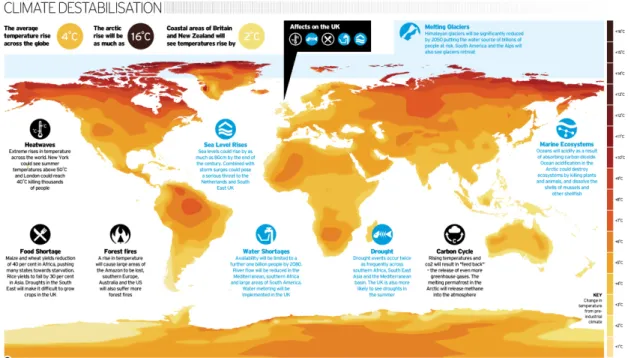
The study of the climate is a complex field of investigation and in constant evolution but, since it is influenced by a great number of factors, it is not a static system and therefore it is difficult to forecast its future potential impacts with precision (Fig. 1). However, it is obvious that the climate is undergoing rapid changes, where socio-economic development is not corresponding to the limited natural resources. Thus, one of the greatest challenges is to respond to the need to produce enough food, feed and fiber in a sustainable way while satisfying the needs for a growing world population in a changing climate. Agricultural production, and therefore food security, is strongly influenced by changes in rainfall and temperature patterns and other climatic conditions.
Fig. 1. Global impacts of climate change.
In terms of contribution, approximately 10% of greenhouse gases (GHGs) globally emitted come from the European Union (EU). Of these GHGs emitted in Europe, around 10% come from agriculture, which is the fourth largest emitter in the EU after the energy production, transport and industrial combustion sectors. In order to slow down these emissions, the 21st meeting of the Conference of the Parties (COP21) and the 11th meeting
of the Conference of the Parties was celebrated at the end of 2015, serving as the meeting
of the Parties with respect to the Kyoto Protocol (CMP). It concluded with the adoption
of a historic agreement to combat climate change and promote measures and investments for a low-carbon, resilient and sustainable future, the so-called Paris Agreement.
Agriculture is a fundamental sector that provides food for both people and animals, produces fibers for the textile sector, and many other products and services essential for the existence of humanity. Like any other economic activity, agriculture is linked to the natural and social environment in which it is developed, and interacts with it. If there is any productive activity that depends directly on the climate and its variability, this is undoubtedly agriculture. A change of temperature and precipitation, or an increase in the concentration of atmospheric CO2, will significantly affect crop development and
performance. At a global level, it is estimated that climate variability is responsible for between 32% and 39% of the variability in yields, an effect that is probably even more pronounced in many regions of Southern Europe.
Today, a multidimensional approach it is essential for measuring agricultural sustainability in order to achieve a balance between preservation and improvement of the environment, social equity and economic viability, and therefore improve the welfare of society. Scientific studies carried out in different agro-ecological regions and countries agree that the less soil is tilled, the more carbon is absorbed and stored in it. Plants absorb carbon dioxide from the air and transform it through the process of photosynthesis into organic carbon. This organic carbon becomes the source for soil organic matter, contributing thus to an enhanced soil fertility and to an improved productive capacity. On the other hand, any action aimed at saving energy and fuel, such as reducing the number tillage operations, optimizing the use of agricultural inputs and proper execution of operations, directly reduces emissions of greenhouse gases. Therefore, a sustainable agricultural system that responds to these requirements is of particular importance: Conservation Agriculture.
WHAT IS CONSERVATION AGRICULTURE?
The principles of Conservation Agriculture are as follows (Fig. 2):• Minimum soil disturbance. In practice it means no-tillage. At least 30% of the soil must be covered after seeding to effectively protect it against erosion. However, it is recommendable to leave more than 60% of the soil covered to have almost complete control over the soil degradation process.
• Permanent soil cover. In other words, it means to maintain stubble in arable crops and to seed or preserve groundcovers between rows of trees in permanent crops. In this way, soil organic matter and water infiltration into the soil are increasing, weeds are inhibited, and water evaporation from the soil is limited.
• Practicing rotations or crop diversification in annual crops. In this way, pests and diseases are better controlled by breaking cycles that are maintained in monocultures, in addition to including crops that can improve the natural fertility of the soil and biodiversity.
Fig. 2. Principles and benefits of Conservation Agriculture.
CONSERVATION AGRICULTURE AS AN INTEGRATED
APPROACH TOWARDS SUSTAINABILITY
Conservation Agriculture offers a considerable environmental improvement of the agricultural ecosystems, without reducing yields. Almost 20% of the European surface suffers soil losses exceeding 10 tons per hectare per year. Taking into account the low rate of soil formation, losses greater than 1 ton per hectare per year can be considered as irreversible. Conservation Agriculture reduces soil erosion by up to 90% compared to conventional tillage, thus reducing soil degradation.
Comparing Conservation Agriculture to tillage based agriculture, the latter increases emissions of CO2 into the atmosphere, reducing the content of organic matter of the soil,
and therefore affecting its quality and fertility. The implementation of Conservation Agriculture leads to the significant improvement of soil physical and chemical properties resulting in a much better soil structure, increases in soil organic matter (CO2
sequestration) and biodiversity, improved water infiltration and water holding capacity and reduced runoff and direct evaporation from the soil, thus improving the efficiency of water use and the quality of the water (Table 1).
Table 1. Main environmental benefits of Conservation Agriculture.
For the soil Reduced erosion
Increase in soil organic matter
Improvement of structure and porosity Greater biodiversity
Increased soil fertility
For the air Fixation of atmospheric carbon in the soil
Reduced CO2 emissions into the atmosphere
For the water Reduced runoff
Better quality
Increased water holding capacity
Conservation Agriculture has a double effect on the reduction of greenhouse gases concentration in the atmosphere. On the one hand, the changes introduced by CA (more biomass in form of crop residues and cover crops), increase the carbon content in the soil through higher organic carbon inputs (Fig. 3). And, on the other hand, the drastic reduction of tillage operations along with the minimal mechanical soil disturbance, lead to reduction of the CO2 emissions resulting from energy savings through less fuel
consumption, and the reduction of the mineralization processes of the organic matter.
Fig. 3. Mitigating climate change mechanisms through Conservation Agriculture.
ADOPTING CONSERVATION AGRICULTURE
Conservation Agriculture is one of the most studied agro-sciences in the world, as is practiced on almost 160 million hectares according to FAO. Today, CA is performed in annual crops applying the principles of no-tillage, permanent organic soil cover and crop
rotations, while in permanent crops, the CA approach is based on groundcovers between the tree crop rows. CA in annual crops is widespread around the world (Fig. 4), being its adoption rather heterogeneous in Europe (Fig. 5).
Fig. 4. Worldwide No-tillage adoption.
SOIL
ORGANIC
CARBON
FIXATION
THROUGH
CONSERVATION AGRICULTURE
Different studies in Europe show that during several years of the application of CA principles it is possible to sequester large amounts of CO2 per hectare and year in annual
crops, compared to tillage-based systems. The estimation for EU-28 countries of the potential soil organic carbon (SOC) sequestration through the adoption of CA in annual crops when compared to conventional tillage systems is given in the table 2.
Table 2. Area under CA in annual crops in Europe, carbon sequestration potential per biogeographic region
or country and actual and potential carbon/CO2 fixation through CA in annual crops (1 ton of Corg
corresponds to 3.7 tons of CO2)
Country Biogeographical region
Increase of soil organic carbon (t ha-1 yr-1) NT current area (ha) Current SOC fixed (t yr-1) Current CO2 fixed (t yr-1) NT potential area (ha) Potential SOC fixed (t yr-1) Potential CO2 fixed (t yr-1) Austria Continental 0.42 28,330 11,927 43,731 1,232,040 518,670 1,901,791 Belgium Atlantic 0.32 270 87 320 613,580 198,084 726,308 Bulgaria Continental 0.42 16,500 6,946 25,470 3,197,800 1,346,225 4,936,160 Croatia Continental 0.42 18,540 7,805 28,619 832,870 350,626 1,285,627 Cyprus Mediterranean 0.81 270 219 803 61,770 50,085 183,646
Czech Republic Continental 0.42 40,820 17,185 63,010 2,373,890 999,372 3,664,363 Denmark Atlantic 0.32 2,500 807 2,959 2,184,120 705,107 2,585,391 Estonia Boreal 0.02 42,140 843 3,090 578,660 11,573 42,435 Finland Boreal 0.02 200,000 4,000 14,667 1,912,710 38,254 140,265 France Atlantic 0.20 300,000 60,000 220,000 17,166,990 3,433,398 12,589,126 Germany Continental 0.43 146,300 63,441 232,617 10,904,310 4,728,505 17,337,853 Greece Mediterranean 0.81 7 6 21 1,600,950 1,298,104 4,759,713 Hungary Continental 0.42 5,000 2,105 7,718 3,560,130 1,498,761 5,495,456 Ireland Atlantic 0.32 2,000 646 2,367 999,550 322,688 1,183,190 Italy Mediterranean 0.77 283,923 219,094 803,344 5,992,540 4,624,243 16,955,559 Latvia Boreal 0.02 11,340 227 832 1,101,650 22,033 80,788 Lithuania Boreal 0.02 19,280 386 1,414 2,129,630 42,593 156,173 Luxembourg Continental 0.42 440 185 679 60,950 25,659 94,083 Malta Mediterranean 0.81 ND ND ND 5,290 4,289 15,727 Netherlands Atlantic 0.32 7,350 2,373 8,700 670,360 216,415 793,520 Poland Continental 0.41 403,180 164,632 603,650 9,518,930 3,886,896 14,251,954 Portugal Mediterranean 0.81 16,050 13,014 47,718 707,490 573,656 2,103,407 Romania Continental 0.42 583,820 245,779 901,191 7,295,660 3,071,362 11,261,662 Slovakia Continental 0.42 10,000 4,210 15,436 1,304,820 549,309 2,014,135 Slovenia Continental 0.42 2,480 1,044 3,828 165,410 69,635 255,329 Spain Mediterranean 0.85 619,373 526,467 1,930,379 7,998,655 6,798,857 24,929,141 Sweden Boreal 0.02 15,820 316 1,160 2,324,650 46,493 170,474
United Kingdom Atlantic 0.45 362,000 161,331 591,548 4,376,000 1,950,237 7,150,870 Total Europe 3,137,733 1,515,074 5,555,271 90,871,405 37,381,131 137,064,146
These SOC fixation data are represented by maps for the different biogeographic regions (Fig. 6) as well as for 7 countries in particular (France, Germany, Italy, Netherlands, Poland, Spain and the United Kingdom) (Fig. 7).
In relation to CA in permanent crops (groundcovers), there are no official data for Europe as a whole. Due to that, the data of the adoption of this practice derive from reports of the European national associations of Conservation Agriculture. The available scientific data
for carbon sequestration, except for France, only address the Mediterranean biogeographic region. However, with due caution, a calculation of the carbon sequestration potential for EU-28 is provided in table 3.
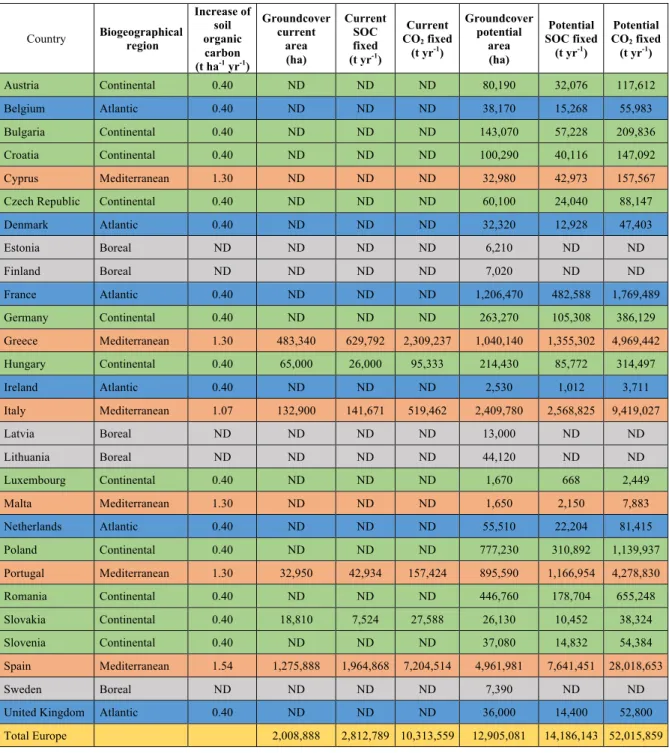
Table 3. Area under CA in permanent crops (groundcovers)in Europe, carbon sequestration potential per
biogeographic region or country, and actual and potential carbon/CO2 fixation through groundcovers (1 ton
of Corg corresponds to 3.7 tons of CO2)
Country Biogeographical region
Increase of soil organic carbon (t ha-1 yr-1) Groundcover current area (ha) Current SOC fixed (t yr-1) Current CO2 fixed (t yr-1) Groundcover potential area (ha) Potential SOC fixed (t yr-1) Potential CO2 fixed (t yr-1) Austria Continental 0.40 ND ND ND 80,190 32,076 117,612 Belgium Atlantic 0.40 ND ND ND 38,170 15,268 55,983 Bulgaria Continental 0.40 ND ND ND 143,070 57,228 209,836 Croatia Continental 0.40 ND ND ND 100,290 40,116 147,092 Cyprus Mediterranean 1.30 ND ND ND 32,980 42,973 157,567
Czech Republic Continental 0.40 ND ND ND 60,100 24,040 88,147
Denmark Atlantic 0.40 ND ND ND 32,320 12,928 47,403 Estonia Boreal ND ND ND ND 6,210 ND ND Finland Boreal ND ND ND ND 7,020 ND ND France Atlantic 0.40 ND ND ND 1,206,470 482,588 1,769,489 Germany Continental 0.40 ND ND ND 263,270 105,308 386,129 Greece Mediterranean 1.30 483,340 629,792 2,309,237 1,040,140 1,355,302 4,969,442 Hungary Continental 0.40 65,000 26,000 95,333 214,430 85,772 314,497 Ireland Atlantic 0.40 ND ND ND 2,530 1,012 3,711 Italy Mediterranean 1.07 132,900 141,671 519,462 2,409,780 2,568,825 9,419,027 Latvia Boreal ND ND ND ND 13,000 ND ND Lithuania Boreal ND ND ND ND 44,120 ND ND Luxembourg Continental 0.40 ND ND ND 1,670 668 2,449 Malta Mediterranean 1.30 ND ND ND 1,650 2,150 7,883 Netherlands Atlantic 0.40 ND ND ND 55,510 22,204 81,415 Poland Continental 0.40 ND ND ND 777,230 310,892 1,139,937 Portugal Mediterranean 1.30 32,950 42,934 157,424 895,590 1,166,954 4,278,830 Romania Continental 0.40 ND ND ND 446,760 178,704 655,248 Slovakia Continental 0.40 18,810 7,524 27,588 26,130 10,452 38,324 Slovenia Continental 0.40 ND ND ND 37,080 14,832 54,384 Spain Mediterranean 1.54 1,275,888 1,964,868 7,204,514 4,961,981 7,641,451 28,018,653 Sweden Boreal ND ND ND ND 7,390 ND ND
United Kingdom Atlantic 0.40 ND ND ND 36,000 14,400 52,800
Total Europe 2,008,888 2,812,789 10,313,559 12,905,081 14,186,143 52,015,859
These SOC fixation data are represented by maps for the different biogeographic regions (Fig. 8) as well as for 7 countries in particular (France, Germany, Italy, Netherlands, Poland, Spain and the United Kingdom) (Fig. 9).
Fig. 9. Current and potential SOC fixed by groundcovers compared to systems based on soil tillage in
France, Germany, Italy, Netherlands, Poland, Spain and the United Kingdom.
In order to quantify the CO2 emission reduction achievable through the values of organic
C sequestered in the soil and not released through the microbiological oxidation processes of organic matter, we are using the ratio of 3.7 tons of CO2 that are generated from 1 ton
of C. Therefore, taking into account the increase in soil organic matter (SOM) observed in CA systems (both annual crops and groundcovers in permanent crops) in comparison to the management systems based on tillage, it is possible to calculate the total CO2
emission offset potential through the implementation of CA in Europe (Table 4).
Table 4. Current and potential fixation of CO2 in Europe.
Biogeographical region Current CO2 fixation through CA (t yr-1) Total Potential CO2 fixation through CA (t yr-1)
Remaining Potential for CO2
fixation through CA (Potential - current) (t yr-1) Austria Continental 43,731 2,019,403 1,975,672 Belgium Atlantic 320 782,291 781,971 Bulgaria Continental 25,470 5,145,996 5,120,526 Croatia Continental 28,619 1,432,719 1,404,101 Cyprus Mediterranean 803 341,213 340,410
Czech Republic Continental 63,010 3,752,510 3,689,499
Denmark Atlantic 2,959 2,632,794 2,629,835 Estonia Boreal 3,090 42,435 39,345 Finland Boreal 14,667 140,265 125,599 France Atlantic 220,000 14,358,615 14,138,615 Germany Continental 232,617 17,723,982 17,491,365 Greece Mediterranean 2,309,258 9,729,155 7,419,897 Hungary Continental 103,051 5,809,954 5,706,902 Ireland Atlantic 2,367 1,186,900 1,184,533 Italy Mediterranean 1,322,806 26,374,586 25,051,780 Latvia Boreal 832 80,788 79,956 Lithuania Boreal 1,414 156,173 154,759 Luxembourg Continental 679 96,532 95,853 Malta Mediterranean 0 23,611 23,611 Netherlands Atlantic 8,700 874,935 866,234 Poland Continental 603,650 15,391,891 14,788,241 Portugal Mediterranean 205,142 6,382,238 6,177,096 Romania Continental 901,191 11,916,910 11,015,719 Slovakia Continental 43,024 2,052,459 2,009,435 Slovenia Continental 3,828 309,713 305,885 Spain Mediterranean 9,134,893 52,947,794 43,812,901 Sweden Boreal 1,160 170,474 169,314
United Kingdom Atlantic 591,548 7,203,670 6,612,122
COMMITMENTS WITHIN THE PARIS AGREEMENT
The Paris Agreement pursues to strengthen the global response to the threat of climate change, in the context of sustainable development and efforts to eradicate poverty. To comply with the 40% target compared to 1990, an Emission Reduction is planned in two areas:
- Reduction of 43% compared to 2005 emissions in sectors belonging to the EU Emissions Trading Scheme (ETS).
- Reduction of 30% compared to 2005 emissions in sectors outside the EU ETS (non-ETS) system.
Agriculture is included within the second, counting the reduction of its emissions, within the binding objectives to which each of the Member States has committed (Fig. 10).
Fig. 10. Percentage reduction of national emissions in sectors outside the EU ETS (non-ETS).
The amount of CO2 sequestered in the soil through the application of the CA, would reach
the targets committed by 2030 with greater ease. Considering overall European figures, carbon sequestration that could take place on farm land under Conservation Agriculture would help achieve around 22% of the necessary reductions in the non-ETS sectors by 2030, and almost 10% of the total emissions still allowed in the non-ETS sectors. This achievement would could give the signing member countries some margin in the emission reduction in other sectors such as housing or transport.
Table 5. Existing relationship between CO2 sequestration that would occur in the soil when conventional
farming system is substituted by conservation agriculture on the entire surface, and the emission reduction to be achieved in the non-ETS sectors by 2030. And with respect to Non-ETS emissions allowed by 2030.
(A) Non-ETS emissions allowed by 2030 (t yr-1) (B) Reduction of emissions by 2030 from non-ETS compared to 2005 (t yr-1) (C) Potential of CO2 fixed through CA (t yr-1) Percentage of (C) over (B) (%) Percentage of (C) over (A) (%) Austria 36,268,800 20,401,200 2,019,403 9.90 5.57 Belgium 50,830,000 27,370,000 782,291 2.86 1.54 Bulgaria 24,570,000 0 5,145,996 - 20.94 Croatia 15,642,600 1,177,400 1,432,719 121.69 9.16 Cyprus 3,176,800 1,003,200 341,213 34.01 10.74
Czech Republic 53,793,000 8,757,000 3,752,510 42.85 6.98 Denmark 24,448,800 15,631,200 2,632,794 16.84 10.77 Estonia 4,724,100 705,900 42,435 6.01 0.90 Finland 20,496,000 13,104,000 140,265 1.07 0.68 France 249,221,700 146,368,300 14,358,615 9.81 5.76 Germany 290,432,800 178,007,200 17,723,982 9.96 6.10 Greece 51,895,200 9,884,800 9,729,155 98.43 18.75 Hungary 43,133,400 3,246,600 5,809,954 178.96 13.47 Ireland 33,264,000 14,256,000 1,186,900 8.33 3.57 Italy 220,523,800 108,616,200 26,374,586 24.28 11.96 Latvia 8,008,800 511,200 80,788 15.80 1.01 Lithuania 9,809,800 970,200 156,173 16.10 1.59 Luxembourg 6,078,000 4,052,000 96,532 2.38 1.59 Malta 834,300 195,700 23,611 12.06 2.83 Netherlands 78,643,200 44,236,800 874,935 1.98 1.11 Poland 163,689,300 12,320,700 15,391,891 124.93 9.40 Portugal 41,109,900 8,420,100 6,382,238 75.80 15.52 Romania 71,569,400 1,460,600 11,916,910 815.89 16.65 Slovakia 19,624,000 2,676,000 2,052,459 76.70 10.46 Slovenia 10,072,500 1,777,500 309,713 17.42 3.07 Spain 173,041,600 60,798,400 52,947,794 87.09 30.60 Sweden 25,740,000 17,160,000 170,474 0.99 0.66 United Kingdom 261,267,300 153,442,700 7,203,670 4.69 2.76 Total Europe 1,991,909,100 856,550,900 189,080,005 22.07 9.49
KEY TOOLS FOR CONSERVATION AGRICULTURE
Machinery
Since Conservation Agriculture avoids tillage, it is necessary to have adequate equipment to establish the crops in conditions with abundant plant residues. Therefore the development specific machinery, especially for seeding, has had special relevance in the implementation of CA. One of the keys to success in Conservation Agriculture are the direct seeders (no-till drills) and its features, which allow farmers to establish the crops successfully under the divers conditions soil types of soils groundcovers. In general, no-till drills must have the following characteristics:
• Enough weight to penetrate under compact soil conditions and cover crops.
• Ability to open a groove wide and deep enough to place the seed at the adequate depth. It will be different if it is used for fine (~ 3 cm) or thick (~ 5 cm) seed.
• Possibility to regulate the rate and spacing of seeds of different size and ensure their adequate covering.
• Possibility to easily modify its settings to adapt to different crops and to amply fertilizers and plant protection products simultaneously.
• Resistance of its elements to withstand heavy duty conditions.
Plant protection
Conservation Agriculture principles, namely crop diversity and rotation and enhanced soil and aboveground biodiversity, help control weeds, pest and diseases. However, some
applications of crop protection products may be needed during the season. The numerous plough passes performed in tillage-based agriculture are replaced by an optimized use of phytosanitary treatments. For that reason, herbicides have been, and remain, a crucial element in the development of CA systems. The active ingredients used in the pre-seeding weed control are diverse, but normally glyphosate alone or in combination with other herbicides, such as hormonal ones are a common choice among farmers. Glyphosate controls many weeds and leaves no residue in the soil that could prevent or delay seeding. The low toxicological characteristics of this herbicide, its excellent weed control, and the easy availability of numerous brands commercialized by many companies -since its patent expired in 2000- make treatments with this active ingredient safe, inexpensive and well-known all around the world. Without glyphosate the maintenance and spread of the area under CA in Europe would be at risk, or would depend on the use of other herbicides with a less favourable ecotoxicological profile and at a higher cost to the farmers. It is also important to stress that the application of any plant protection product in CA is much safer when compared to the application in conventional agriculture, as the risk of any off-site transport is much lower and the degradation rate of the products applied is enhanced due to a much higher soil microbial activity.
FACTS AND FIGURES
Data are based on the potential of CO2 sequestration in Europe (189 M t ha-1 yr-1) and on
the average yearly CO2 sequestration that can be achieved by the implementation of CA
(1.82 t ha-1 yr-1). This amount results of dividing the CO2 sequestration in Europe by the
area susceptible to be managed under CA (103 M ha).
Just 4 hectares under CA would negate the average annual emissions of a European citizen.
One hectare under CA would compensate emissions equivalent to 14 car journeys from Paris to Berlin.
Adoption of CA across Europe would sequester the CO2 emitted by 18 million
households. Or the emissions from electricity generation for 25 million households. The carbon sequestration due to the adoption of CA across Europe would be equivalent to the emissions saving obtained by the installation of over 43,000 wind turbines.
Implementation of CA in Europe would reduce as much emissions as the closure of 50 coal-fired power plants.
If all European farmland was converted to CA, it would reduce atmospheric carbon by as much as planting 65 million hectares of forest.
For every hectare converted to CA in Europe the emissions of a return flight from London to Athens is removed from the atmosphere.