i
Market Basket Analysis
Trend Analysis of Association rules in different
time periods.
Dissertation presented as partial requirement for
obtaining the master’s degree in Statistics and
Information Management
Sohaib Zafar Ansari
M2016027
ii
NOVA Information Management School
Instituto Superior de Estatística e Gestão de Informação
Universidade Nova de Lisboa
MARKET BASKET ANALYSIS: TREND ANALYSIS OF
ASSOCIATION RULES IN DIFFERENT TIME PERIODS
by
Sohaib Zafar Ansari
M2016027
Dissertation presented as partial requirement for obtaining the master’s degree in statistics and Information Management, with a specialization in Market Research and Customer Relationship Management
Advisor / Co Advisor: Fernando Bação (Associate Professor)
iii
ACKNOWLEDGEMENT
My journey through this dissertation and this degree has required more effort than I was able to deliver on my own. For this reason, I would like to acknowledge all the people who supported me throughout the process.
Firstly, I would to thank my supportive supervisor Dr. Fernando Bação without whose guidance and knowledge I would not have completed this journey. He has encouraged me to learn new concepts and new tools which will be highly useful in building a successful career in future. I would like to thank my colleague and friend Jonas Deprez who got me in touch with a retail company who were willing to provide me their transactional data so that I can use it for my thesis. I would like to thank all the experts that participated in the evaluation of this and guided me with their knowledge and expertise no matter the distance and time.
At last, I would like to thank my family and friends for being supportive and loving at every step and for being there for me to give me a push whenever I needed it.
iv
ABSTRACT
Market basket analysis (i.e. Data mining technique in the field of marketing) is the method to find the associations between the items / item sets and based on those associations we can analyze the consumer behavior. In this research we have presented the variability of time, because with the change in time the habits or behavior of the customer also changes. For example, people wear warm clothes in winter and light clothes in summer. Similarly, customers purchase behavior also changes with the change in time. We study the problem of discovering association rules that display regular cyclic variation over time. This problem will allow us to access the changing trends in the purchase behavior of customers in a retail market, and we will be able to analyze the results which will display the changing trends of the association rules. In this research we will study the interaction between association rules and time. We worked on transactional data of a Belgian retail company and analyzed the results which will help the company to build up time period specific marketing strategies, promotional strategies, etc. to increase the profit of their company.
KEYWORDS
Data mining; Market basket analysis; association rules; apriori algorithm; changing trends of association rules; Comparative Analysis
v
Contents
CHAPTER 1: INTRODUCTION ... 1
1.1. DATA MINING ... 2
1.2. MARKET BASKET ANALYSIS ... 2
CHAPTER 2: SCOPE OF THE STUDY ... 5
CHAPTER 3: LITERATURE REVIEW ... 8
CHAPTER 4: METHODOLOGY ... 13
4.1. RESEARCH PURPOSE ... 13
4.2. RESEARCH APPROACH ... 13
4.3. RESEARCH STRATEGY ... 13
CHAPTER 5: STRATEGY FOR MARKET BASKET ANALYSIS ... 15
5.1. KEY TERMS AND CONCEPTS ... 15
5.1.1. Association rules: ... 15
5.1.2. Antecedent and Consequent: ... 16
5.1.3. Causality: ... 16
5.1.4. Frequent Itemset: ... 17
5.1.5. Time Period: ... 17
5.1.6. Transaction:... 17
5.1.7. Long Tail Effect: ... 18
5.2. DETERMINE SUITABILITY OF Market Basket Analysis ... 18
5.2.1. ADVANTAGES OF USING MARKET BASKET ANALYSIS ... 19
5.2.2. CHECK MBA REQUIREMENTS ... 20
5.2.3. APRIORI ALGORITHM ... 21
5.2.4. OTHER ALGORITHMS USED IN MARKET BASKET ANALYSIS ... 26
CHAPTER 6: PRACTICAL IMPLEMENTATION OF MARKET BASKET ANALYSIS ON THE DATASET ... 30
6.1. DATA COLLECTION ... 30
6.2. DATASET DESCRIPTION ... 30
6.2.1. ATTRIBUTES ... 30
6.3. TOOLS USED FOR ANALYSIS ... 31
6.4. DATA EXPLORING & TRANSFORMATION ... 32
6.5. BINARY REPRESENTATION ... 33
6.6. ANALYSIS & DISCUSSION ... 34
vi
6.6.2. Time development of association rules ... 35
6.6.3. Top 30 association rules comparison ... 35
CHAPTER 7: CONCLUSION ... 39
7.1. SUMMARY & FUTURE WORK ... 39
7.2. LIMITATIONS ... 40 CHAPTER 8: REFERENCES ... 42 ANNEX ... 46
Figures
1. Market basket ……….3 2. Transaction example ………183. All possible subsets ………22
4. If an itemset set id infrequent, we do not consider its super sets ………22
5. Transactional date to frequent items ………23
6. Pruning and joining ……….24
7. Pruning and joining again until there are no more frequent items left ……….25
8. Support, confidence and lift calculation ………..25
9. Calculation of confidence ………26
10. Long tail effect on dataset ……….33
11. Degree of confidence of top 30 rules ……….36
12. Degree of support of top 30 rules ……….37
13. Lift of top 30 association rules ……….38
Tables
1. Research strategy methods ………..……….142. Attributes description ……….…31
3. Data exploring ………..………33
4. Category and subcategories distribution ………33
5. Association rules with different thresholds ………..………34
6. 30 association rules with highest degree of confidence ……..………36
7. 30 association rules with highest degree of support ………..………37
1
CHAPTER 1: INTRODUCTION
Retail have evolved since the common corner stores from the 1900s, until the new e-commerce, that have shaken the retail world to its core. This changing process have led to a new era of unlimited possibilities for commerce and the consumers.
Consumers nowadays have a wide range of options, independently in almost every domain. In the past, when the consumer had to buy something, he only could choose a product from the catalogue of the store. However, with the new era of information and globalization, the list of options have increased exponentially. Now consumers can choose between a huge variety of products and their variances. Limitations as geography, season and so on are no longer an issue. Products that were considered as luxury goods are considered as common products now. All of this led the companies to have limitless possibilities nowadays. However, this limitless possibility caused a huge number of new competitors to enter the market. The retail stores seek for marketing strategies in order to attract new customers or keep its current customers. Only new marketing strategies could help this situation by offering efficient promotions and proper product planning. Market basket analysis which have been practiced in other countries have shown remarkable success. As a result, multinational retail stores such as Walmart and Tesco have been using market basket analysis in order to achieve higher profit. But in order to get the insights using market basket analysis we need to have information about our customer purchase regarding what they buy and when they buy it. Hence, comes the importance of the data about the customers purchases which is based on their behavior.
In the last two decades there have been an explosive growth in the data, but not all data is relevant. So, the companies started to use data to discover and extract relevant information. This process of extracting useful information is called Data Mining also known as Knowledge Discovery and Data (KDD) process. Data mining allows a search for valuable information in large volumes of data (Weiss & Indurkhya, 1998). It is widely used in several aspects of science such as manufacturing, marketing, CRM, retail trade, psychology, education, etc. There are several data mining techniques which helps to extract meaningful knowledge and find the solution to the organizational problems. Some of them are Neural Networks, Artificial information, Classification, Association, Prediction, Clustering, Regression, Sequence discovery, Visualization.
2
1.1. DATA MINING
According to David Hand, “Data mining is the analysis of (often large) observational data sets to find unsuspected relationships and to summarize the data in novel ways that are both understandable and useful to the data owner”. (David Hand, Heikki Mannila, and Padhraic Smyth, 2001)
Application of data mining techniques in various fields have been very effective till now. For example, in the field of healthcare, it can help healthcare insurers detect fraud and abuse, healthcare organizations make customer relationship management decisions, physicians identify effective treatments and best practices, and patients receive better and more affordable healthcare services (Hian Chye Koh and Gerald Tan). In the field of marketing, customer segmentation involves the subdivision of an entire customer base into smaller customer groups, consisting of customers who are similar within each specific segment (Woo, Bae, & Park, 2005). This segmentation technique is useful to identify the customers and cluster them based on their characteristics and features. One major application domain of data mining is the analysis of transactional data. In a recorded transactional database each transaction is a collection of items. The best technique to analyze and find the relationships and patterns between items is market basket analysis. It is one of the most interesting research areas of the data mining that have received more attention by researchers nowadays.
1.2. MARKET BASKET ANALYSIS
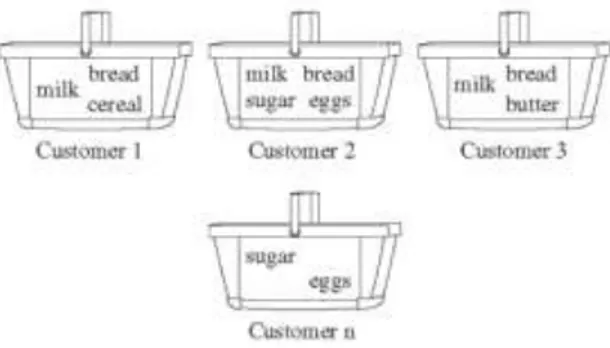
Market basket is defined as an itemset bought together by a customer on a single visit to a store. In our visit to the super market we tend to buy a lot of products from different categories and put them all together in one single basket. Which is considered to a be a single transaction. Market basket analysis is the analysis of those baskets all together.
Market basket analysis encompasses a broad set of analytic techniques aimed at uncovering the associations and connections between specific objects, discovering customer behaviors and relation between items. In retail, it is used based in the following idea, if a customer buys a certain group of items, is more (or less) likely to buy another group of items. For example, it is known that when a customer buy beer, in most of cases, buys chips as well. These behaviors produced in purchases is something that the companies selling their products are interested in. The sellers/
3 supermarkets are interested in analyzing which items are purchased together in order to create new marketing/sales strategies that can be helpful in improving the benefits of the company as well as customer experiences.
Most of the retail markets are more focused on the what their customer’s buy. But they ignore the fact about when they buy it. Which is also considered to be a huge factor in their behavior of purchase. This thesis is focused on not just “what” the customer buys but also “when” they buy it. According to Forbes magazine marketers are constantly looking into future, trying to predict next big trend and data driven marketing is the top most trend right now in which time plays a highly significant role. So, data driven marketing with time as a crucial factor will help us predict a better future for the retail company.
figure 1: Market basket
The market basket analysis is a powerful tool for the implementation of up-selling, cross-selling, inventory management strategies (Chen, Tang, Shen, & Hu, 2005). Market Basket Analysis is also known as association rule mining or affinity analysis, which have been used to understand consumer behavior regarding the types of the purchases they make. It is a Data Mining technique that originated in the field of marketing and was initially used to understand purchase patterns of the customers by extracting associations and co-occurrence from a transactional database (i.e. market basket data). For example, when shopping in a supermarket, consumer rarely buy one product, they far more likely to purchase an entire basket of products, mostly from different product categories. This allows us to uncover nonobvious, usually hidden and counterintuitive associations between items, products, or categories. We are also able to extract products and product categories which are purchased together, and these associations can be represented in the form of association rules. These association rules enable managers to develop marketing strategies like developing interventions, promoting specific product categories, offering promotions, etc.
4 which eventually leads to get customers spend more money based on two different principles.
Up-selling, which consists in buying a large quantity of the same product or adding new features and Cross-selling, which consists in adding more products from various categories. Market Basket
5
CHAPTER 2: SCOPE OF THE STUDY
Market basket analysis is mostly used in three main domains.
The first domain is the creation of personalized recommendations which is a very well know methodology nowadays. During the explosion of the e-commerce, personalized recommendations have appeared as a part of the marketing process. Basically, the idea consists of suggesting items to customer based on his/her preferences. The first way to do it is, by suggesting items like the ones that the customer have purchased in the past which is also called collaborative filtering. The second way is, looking for similar customers and recommending items that had been purchased by others. It is called content-based filtering. There is also a third way to do it which is called hybrid recommendation system. The name of this system explains itself. It is the combination of both collaborative and content-based filtering, which can be very effective in certain cases. These strategies are often used for companies in order to realize cross-selling and upselling strategies. The second domain where market basket analysis is used in the analysis of spatial distribution in chain stores. Due the increasing number of products that nowadays exist, physical space in stores started to be a problem. More and more, stores invest money and time trying to find which distribution of items can lead them to obtain more sells. Due to that, knowing in advance which items are commonly purchased together, the distribution of the store can be changed in order to sell more products. It is also very helpful in inventory or stock management within the store. Also having several stores in different areas of the city or the country helps the chain stores to target more and more customers and develop marketing strategies based on customer demographics. This way the chain stores conduct target marketing which also leads to the variability of price of same product in different store.
The last domain is in the creation of marketing strategies which focus on discounts and promotions which is solely based on customer’s behavior through which special sales or targeted promotions can be performed. When sales campaigns are prepared, promoted items must be chosen very carefully. The main goal of a campaign is to entice customers to visit the store and buy more than they usually do. Profit margins on promoted items are usually cut; therefore, non-promoted items with the higher profit margin should be sold together with the promoted items. Therefore, the items chosen should make the promotion effective enough to generate higher sales. Customers who buy
6 a bathroom accessory often also buy several other bathroom accessories. It makes sense that these groups are placed side by side in a retail store so that customers can access them easily. When different additional brands are sold together with the basic brands, the revenue from the basic brands is not decreasing but increasing.
Market basket analysis targets customer baskets in order to monitor buying patterns and improve customer. It is an important component of analytical CRM in retail organizations. By analyzing, recurring patterns in order to offer related goods together, a pattern can be found and therefore the sales can be increased. Sales on different levels of goods classifications and on different customer segments can be tracked easily. For example, if the company knows which items are often purchased together, they can create new offers on those products in order to increase the sale of those items or even they can create combo promotions which increases in the sale of their products. The main aim of the project is the detection and analysis of purchase behavior of the customers (items purchased together). Based on variability in demographics and difference in the segment of customers, every store will have different results. So, in our research we will be focusing on a single store and its transactions which will be giving a comparative analysis in different time periods. This way we will be able to investigate the fluctuation of the consumer behaviors on purchases with the change in time.
Analyzing transactional database and discovering association rules have helped the managers to increase the sale of the company. Time series analysis allows you to track the changes in the trends and to keep track of the progress or downfall of any market. So, we need to focus on the problem which displays regular variations in the association rules over time. For example, if we compute association rules over monthly sales data, we may observe seasonal variation where certain rules are true at approximately the same month each year. Similarly, changing time variations to hourly, daily, weekly, etc., might display different association rules. This will allow us to find the patterns of purchases by the customers which are different in different time periods. Some changes can be seasonal, they may also vary because of different demographic and sociographic. For example, during summer season we can see that the sale of cold beverages increases a lot whereas during the winter season it drops down. Our research is more specific to the time periods which will allow us to do up-selling and cross-selling in every time lags and help the company to increase its sale and maximize profit.
7 Similar study was first made by Ramaswamy and Siberschatz (1998) to discover the association rules that repeat in every cycle of a fixed time span. This information about variations in different time periods allowed marketers to better identify the trends in association rules and help in better predictions.
8
CHAPTER 3: LITERATURE REVIEW
S.H. Liao, P.H. Chu and P.Y. Hsiao reviewed published papers from 2000 to 2011 about data
mining techniques and their applications. These techniques have tend to become more expertise-oriented and their application is more problem-centered, leading to development of advanced algorithms and their application in different discipline areas, like, computer science, engineering, medicine, mathematics, earth and planetary sciences, biochemistry, genetics and molecular biology, business, management and accounting, marketing decisions, social science, decision sciences, multidisciplinary, environmental science, energy, agricultural and biological sciences, nursing, material science, neurology, chemical engineering, etc.
Market basket Analysis is rather a practical subject than academical, therefore most of the studies on the matter have been practiced in actual retail stores. MBA as an old field in data mining and is also one of the best examples of mining association rules (Gancheva, Market basket analysis of beauty products, 2013). Rakesh Agrawal and Usama Fayyad as pioneers in data mining, Association Rule Mining (ARM) and Clustering have developed different algorithms to help users achieve their objectives.
Most of the data mining algorithms have existed since decades, but in last decade there have been sudden increase in the data and realization of the importance of data in every field. S. Linoff,
Michael J.A. Berry in his book suggested for companies in the service sector, data/ information
confers competitive advantage. That is why hotel chains records your preference for a non-smoking room, a car rental companies record your preferred type of car. Similarly, credit card companies, airlines, retailers, etc. compete more on services than on price. Many companies find that the information on their customers is not only valuable for themselves but also for others. Like, the information about the customers of a credit card company is also useful for an airline company – they would like to know who is buying a lot of airline tickets. Similarly, google knows what people are looking for on web and it takes advantage of the knowledge by selling this information.
In 2009 E. Ngai, L.Xiu and D. Chau presented how data mining in customer relationship management is an emerging trend, which helps in identification, attraction, retention and development of a customer. Customer retention and development are important to maintain a long
9 term and pleasant relationship with the customers which is very much useful in maximizing the organization’s profit. Data mining provides a lot of opportunities in the market sector. For customer identification the methods mostly used are classification, clustering and regression. For customer development the methods usually used are classification, regression, association discovery, pattern discovery, forecasting, etc.
Aiman Mushtaq in 2015 highlighted how data mining in marketing helps to increase return on
investment or net profit, improve customer relationship management, market analysis, building better marketing strategies, reduces unnecessary expense, etc. With the growing volume of data everyday various techniques are being used to mine the data in the field of marketing and helping in fulfilling the organizational goals.
Market basket analysis is a data mining technique originated in the field of marketing to understand purchase patterns of customers. It has made a lot of advancements since it was first introduced in 1993 by Rakesh Agrawal. He proposed the first associative algorithm called apriori algorithm, which have been used as part of technique in association, classification and associative classification algorithms. It was mostly used in stock management and placement of items. Now, market basket analysis is being used to build predictive models and to get interesting insights which are helpful in decision making. Its application is in several fields. Cascio and Aguinis in 2008 noted, “there is a serious disconnect between the knowledge that academics are producing and the knowledge the practitioners are consuming.” The use of MBA can produce knowledge that is relevant and actionable and market basket analysis can help bridge the science and practical divide.
S. Kamley, S. Jaloree, R.S. Thakur in 2014 have developed an association rule mining model for
finding the interesting patterns in stock market dataset. This model is helpful in predicting the price of share which will be helpful for stock brokers and investors to invest in the right direction by understanding market conditions. In June 2015, S.S. Umbarkar and S.S. Nandgaonkar used association rule mining for prediction of stock market from financial news. Prediction depends on technical trading indicators and closing prices of the stock.
One of the most important use of market basket analysis is product placement in the super market. In 2012 by A. A. Raorne market basket analysis was used in understanding the behavior of the customer. The researchers did experimental analysis by employing association rules using MBA,
10 which improved the strategy in placement of product on the shelf leading to fetch more profit to the seller. This research was effective in fetching more profit but what it was lacking was that changing of consumer behavior. To sustain in a competitive market the organizations must understand consumer behaviors and consumer behavior changes with the change in time.
In 2015, G. Kapadia did a study that analyses the pattern of consumer behavior of products of lifestyle store. It gives valuable insights relating to the formation of the basket. This study helped in product assortments, managing the stocks for the likely items sold, making promotions on the likely items sold, give discounts to the loyal customers and cross selling. The limitation of this study was that its scope was limited to one store in a specific region.
Data mining tools are also used in the field of education as well. In April 2015, Om Prakash
Chandrakar applied association rule mining to analyze the student’s performance in their
examinations and predicts the outcome of forth coming examination. This prediction allows the students and professors to identify subjects which need more attention even before commencement of the semester.
Solnet et al. in 2016 studied the potential of market basket analysis to grow revenue of hotels. The
researchers explored and derived the most attractive services and products which could attract and satisfy hotel guests and encourage them to repeat their purchase. This approach can increase revenue without increasing customer counts.
In February 2017, Roshan Gangurde did a study on building predictive model using market basket analysis which stated that in a retail business if we are using market basket analysis to come up with product bundles then you are basing past purchase behavior of customers to predict future purchase behavior, which is a predictive model. He also concluded that, with MBA, the leading retailers can attract more customers, increase the value of market basket, drive more profitable advertising and promotion and much more. The study also suggested to design and develop intelligent prediction models to generate the association rules that can be adopted on the recommendation system to make the functionally more operational. Later by the end of 2017, they designed optimized technique for MBA with goal of predicting and analyzing the consumers buying behaviors. In this study, they introduced novel algorithms based on data cleaning, which is one of the most important challenge in every field of data analysis. To overcome this challenge, they combined two data mining algorithms i.e. apriori algorithm and neural networks. They also
11 highlighted that one of the biggest challenges is that demands of customers are continuously changing with respect to seasons and time. Also output of MBA is totally dependent on time and seasons and so we need to perform it over and over.
Analyzing the trends is very useful method to understand any businesses performance. Debaditya
and Nimalya in 2013 attempted to develop a method using association rule mining to find out the
most preferable and popular genres which can be represented as movie business’s trend. The study can predict the possible movie trend based on the genres. As viewer’s taste in movies can change time to time, it was important to get the insights in the changing trends. This study is very useful to the production houses to drive movie business towards profitability.
Kaur and Kang (2016) did MBA to identify the changing trends of market data using association
rule mining. This study proposed a different approach of periodic mining which will enhance the power of data mining techniques. This study was helpful in finding out interesting patterns from large database, predicting future association rules as well as gives us right methodology to find out outliers. This study shows advancement by not just mining static data but also provides a new way to consider changes happening in data.
S. Tan and J. Lau (2014) tried a different approach by summarizing a real-world sales transaction
data set into time series format. Rather than applying association rule mining (i.e. often used in market basket analysis), they used time series clustering to discover commonly purchased items that are useful for pricing or formulating cross-selling strategies. This approach uses a data set that is substantially smaller than the data to be used for association analysis which shows that certain market basket analysis can be analyzed more easily using time series clustering instead of association analysis.
G.N.V.G. Sirisha, M. Shashi & G.V. Padma Raju in 2013 presented a paper overviewing distinct
types of periodic patterns and their applications along with a discussion of the algorithms that are used to mine these patterns. Periodic pattern mining is very much useful in constructing classification/ prediction and recommender systems.
Data keeps on changing with time and interestingness of data differs from person to person. Time to time and task to task. So, attempts are being made to mine the necessary information from a
12 large amount of transactional data on a seasonal basis. Frequent item sets based on calendric pattern will be mined to generate association rules.
Similar study was first made by Ramaswamy and Siberschatz in 1998 to discover the association rules that repeat in every cycle of a fixed time span. This information about variations in different time periods allowed marketers to better identify the trends in association rules and help in better predictions.
Ismail H. Toroslu (2003) extended sequential pattern mining technique by adding repetition support and introduced cyclic pattern mining, which was more efficient than the sequential pattern mining.
Lee and Jiang (2008) relaxed the restrictive crisp periodicity of the periodic association rule to a fuzzy one and developed an algorithm for mining fuzzy periodic association rules. They cover two aspects, finding the pattern and determining the periodicity.
13
CHAPTER 4: METHODOLOGY
Methodology are the guidelines or path on how to proceed in validating knowledge on your subject matter. Different areas of science have developed very different bodies of methodology based on which to conduct their research (Little, 2012).
4.1. RESEARCH PURPOSE
The ultimate purpose of every business is to find better ways to improve the profit for a long run. But for this research the aim would be to encountering actual case of dependencies among products chosen by customer.
Though several different products could be bought in a single visit to a mega store like, groceries, pillowcase, furniture, an electric toaster, etc. However, we believe that there are no coincidences for these choices. These decisions from several categories results in forming customer’s shopping basket. Which with-holds the collection of categories that customer purchased on a specific shopping trip. (Manchanda, Ansari, & Gupta, 1999).
4.2. RESEARCH APPROACH
The implementation of Market Basket Analysis results into inventory management, marketing and promotion strategies, etc. Therefore, this a comparative analysis thesis, which displays the relevance of time. This analysis would be done by implementing the idea on a dataset and check the results. Exploratory data mining techniques are used followed by association rules, or pattern recognition, or ‘if then’ statements. Also, a comparative analysis is done on the data for three months (i.e. April, May and June) all together and individually.
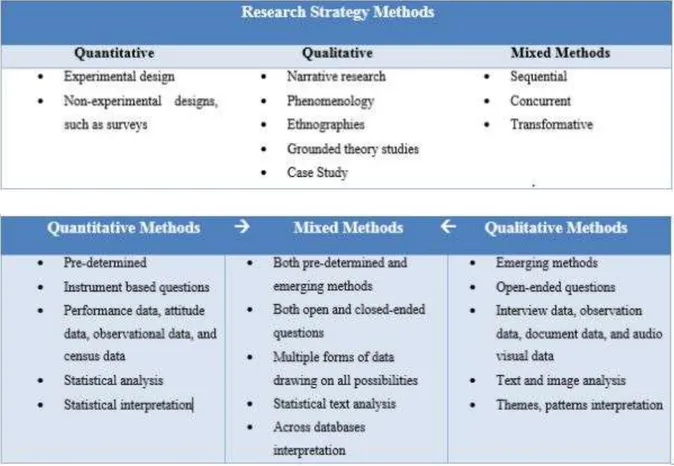
4.3. RESEARCH STRATEGY
There are three main types of research strategies that exists namely quantitative, qualitative and mixed (Creswell, 2013). Researches can also be experimental and non-experimental which in some books are falling into another category while Carswell believes they are under three main mentioned categories. In the book research design by John W. Creswell he mentions that these three categories are not discrete, and they actually are at the ends on a continuum (Creswell, 2013). The research tends to be more qualitative than quantitative and vice versa so as a result all other types can be fitted in between this continuum. Therefore, he adds that the mixed methods are in
14 middle since it contains the elements of both these types. The methods alongside their types are presented in the following tables below explaining the strategies more clearly.
TABLE 1:RESEARCH STRATEGY METHODS
The strategy opted for the research was mixed methods because in our research we are doing data interpretation, pattern interpretation, trying to find insights in the data, doing statistical analysis, data exploring, comparative study. In the coming chapters it will be made clearer.
15
CHAPTER 5: STRATEGY FOR MARKET BASKET ANALYSIS
In this section we describe the entire research process. Before getting into the steps of the analysis. First, we clear some of the concepts that we will be coming across in our analysis.
5.1. KEY TERMS AND CONCEPTS 5.1.1. Association rules:
Association analysis is also known as affinity analysis or association rule mining, a method commonly used for market basket analysis. ARM is currently the most suitable method for analysis of big market basket data but when there is a large volume of sales transaction with high number of products, the data matrix to be used for association rule mining usually ends up large and sparse, resulting in longer time to process data. Association rules provide information of this type in the form of “IF-THEN” statements. There are three indexes which are commonly used to understand the presence, nature and strength of an association rule. (Berry & Linoff, 2004; Larose, 2005; Zhang & Zhang, 2002)
Lift is obtained first because it provides information on whether an association exist or not or if
the association is positive or negative. If the value for lift suggests that there is an existence of association rule, then we obtain the value for support.
𝑳𝒊𝒇𝒕 = 𝑷(𝑨 ∩ 𝑩) 𝑷(𝑨) ∗ 𝑷(𝑩)
Support of an item or itemset is the fraction of transactions in our dataset that contain that item or
itemset. It is an important measure because a rule that have low support may occur simply by chance. A low support rule may also be uninteresting from a business perspective because it may not be profitable to promote items that are seldom bought together. For these reasons, support is often used to eliminate uninteresting rules.
𝑺𝒖𝒑𝒑𝒐𝒓𝒕 = 𝑷(𝑨 ∩ 𝑩)/𝑵
Confidence is defined as the conditional probability that shows that the transaction containing the
16 inference made by an association rules does not necessarily imply causality. Instead, it suggests a strong co-occurrence relationship between the items in the antecedent and consequent of the rule.
𝑪𝒐𝒏𝒇𝒊𝒅𝒆𝒏𝒄𝒆 = 𝑷(𝑨 ∩ 𝑩) 𝑷(𝑨)
Confidence and support measure the strength of an association rule. Since the transactional database is quite large, there is a higher risk of getting too many unimportant and rules which may not be of our interest. To avoid these kinds of errors we commonly define a threshold of support and confidence prior to the analysis, so that only useful and interesting rules are generated in our result.
If lift is greater than 1, it suggests that the presence of the items on the LHS has increased the probability that the items on the RHS will occur on this transaction. If the lift is below 1, it suggests that the presence of the items on the LHS make the probability that the items on the RHS will be part of the transaction lower. If the lift is 1, it suggests that the presence of items on the LHS and RHS are independent: knowing that the items on the LHS are present makes no difference to the probability that items will occur on the RHS.
While performing market basket analysis, we look for rules with a lift of more than one. It is also preferable to have rules which have high support as this will be applicable to a large number of transactions and rules with higher confidence are ones where the probability of an item appearing on the RHS is high, given the presence of items on the LHS.
5.1.2. Antecedent and Consequent:
In every association rule we have an antecedent and a consequent, also called rule body and rule head accordingly. The generated association rule relates the rule body with the rule head. LHS is the Antecedent and RHS is the Consequent.
5.1.3. Causality:
Ideally, we would like to know that in an association rule the presence of an item/ itemset causes another item/ itemset to be bought. However, "causality” is an elusive concept. Nevertheless, for market-basket data, the following test suggests what causality means. If we lower the price of diapers and raise the price of beer, we can lure diaper buyers, who are more likely to pick up beer
17 while in the store, thus covering our losses on the diapers. That strategy works because diapers cause beer. However, working it the other way around, running a sale on beer and raising the price of diapers, will not result in beer buyers buying diapers in any great numbers, and we lose money.
5.1.4. Frequent Itemset:
In many (but not all) situations, we only care about association rules or causalities involving sets of items that appear frequently in baskets. For example, we cannot run a good marketing strategy involving items that no one buys anyway. Thus, much data mining starts with the assumption that we only care about sets of items with high support; i.e., they appear together in many baskets. We then find association rules or causalities only involving a high-support set of items. The consequent must appear in at least a certain percent of the baskets, called the support threshold.
5.1.5. Time Period:
Each transaction takes place in a single time period where W = {W1, W2, W3, …, Wt} is the set of
all the time periods under consideration. Only one transaction occurs per store, per user in a time period.
5.1.6. Transaction:
In general terms transaction is an agreement, contract, understanding, or transfer of cash or property that takes place between two parties and establishes a legal obligation.
In accounting terms events that initiates a change in the asset, liability, or net worth account. Transactions first entry are made in journal and then posted to ledger. From there they move to other accounting books like profit and loss account, balance sheet, etc.
In banking a transaction would be an activity performed by the account holder at his/her request which is affecting a bank account.
In the language of commerce, a transaction will be considered exchange of goods or services between a buyer and a seller. It has 3 components:
1. Transfer of goods or services and money,
2. Transfer of title which may or may not be accompanied by a transfer of possession, 3. Transfer of exchange rights.
18 In the field of marketing, a typical transaction consists of a set of products purchased by a customer at a retail store or on a website. These transactions contain all the information about each specific transaction which make up the data entered into the database. These can include information on the customer, information of what products were purchased in what quantity, information on time of purchases, information on if the companies marketing strategies are attracting customers or not, etc.
Also, a transaction can take place at one point in time or over time and could involve a day, a quarter, a fiscal year, or even longer periods. Because they are not limited to an event.
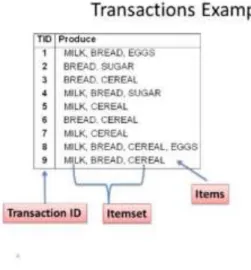
figure 2: Transaction example
5.1.7. Long Tail Effect:
This term often refers to data products purchase in supermarkets describing their distribution as a long tail in which a small number of products is purchased more frequently whereas a large one is purchased less frequently. This phenomenon creates data sparsity problem and worsens even more their elaboration.
Studying such data with MBA would be practically helpful because its transactional data and best approach to work with transactional data is to do market basket analysis.
5.2. DETERMINE SUITABILITY OF Market Basket Analysis
MBA is typically used to examine associations based on data with binary variables. However, it would not be possible to apply MBA when the data set consists of data collected from continuous
19 or Likert-type scales only. There must be at least some categorical variables among which there is some interest or meaningfulness for deriving categorical or quantitative association rules. Apparently, the data collected by organizations as a part of their business analytics and data collected by scholars for research purposes usually includes both binary as well as categorical variables. Therefore, MBA can be potentially used with many types of data available.
In addition, if the researcher is interested in theory building; examining multilevel, contingency, and dynamic relationships; producing results that can be easily communicated to the practitioner audience; if the data seems too messy or unstable to use, then MBA is likely to be a good methodological alternative. On the other hand, MBA is not appropriate for theory testing purposes due to its exploratory nature.
5.2.1. ADVANTAGES OF USING MARKET BASKET ANALYSIS
• It allows researchers to make use of data from stores which is in abundance to build their theory. This capability of MBA was first highlighted by Locke in 2007. He said using MBA has the potential to lead to important contributions by allowing researchers to implement an inductive approach to theory building, which, despite its advantages is currently underutilized. Indeed, it has led to insights in marketing and other fields. For example, Russell et al. (1999) pointed out multiple-category decision making i.e. theoretical models of purchasing decisions involving products in more than one category. Apart from marketing, other researches like patients with food allergies allowed Kanagawa et al. (2009) to build models regarding which allergens are related to which.
• MBA allows the researchers to use the data which appears to be messy and unusable. Given the affordability and availability of data storage systems, the organizations collect data every day on employees (their performance, training, skills, etc.), customers (frequency of visits, purchases, expenditure, etc.) and many other issues. Most of that data is collected in a very unsystematic and unorganized format without any specific study in mind. MBA is ideally suited to be used inductively with such datasets to uncover association rules that may not be readily apparent (Hafley & Lewis, 1963; Shmueli, Patel, & Bruce, 2010). Messy data often involves dirty data with lots of missing values and outliers. MBA is not immune to the problem of messy data, it just allows the interpretation of missing data as indicating that no option was selected, and association rules are less influenced by outliers
20 compared to other traditional data analytic approaches. In the context of MBA, outliers result in infrequently occurring associations (He, Xu, Huang, & Deng, 2004)
• MBA can help in building dynamic theories, which states how important is the role of time in theory building. There are mainly two approaches of building dynamic theories via MBA i.e. multiple MBA and sequential MBA. When the available data include transactions as they have occurred overtime, multiple MBA approach is used (Tang et al. 2008). Sequential MBA is used when the available data describes individual events as they have occurred over time. It may uncover the presence of pattern in which event A occurs before event B, which occurs before event C (Han, Kim, & Sohn, 2009).
• MBA can be used to access multilevel relationships. It can be applied across all level of analysis ranging from an individual level to firm level, industry level and country level contexts.
5.2.2. CHECK MBA REQUIREMENTS
Next step would be to check two key requirements for MBA (Marakas, 2003). Firstly, it is necessary to have sufficiently huge number of transactions. Fortunately, it is straightforward to meet the sample size requirements because of vast storage of data being collected by firms in response to the analytics movement (Davenport et al., 2010) as well as sharp decrease in cost of data storage technology (Shmueli et al., 2010). In fact, Berry and Linoff (2004) had an argument that firms face the problem of too much data rather than too little.
It is important for the researchers to explain in detail the sources of their data so that readers can be fully aware/ informed regarding the extent to which association rules may generalize to other settings, because it may be the case even if the sample size is large, the data might be collected only in one context.
Secondly, it must be verified that the data doesn’t have wrong entry or missing values which should
mandatory. It is necessary to check the data for any sort of weirdness. To do so, the researchers can use exploratory data analysis techniques, such as frequency tables, unique values, date of transaction, etc. Since our data will be transactions in retail market, we can choose the important categories that we want to focus in our analysis, rather than looking in to all the categories.
21 Our illustrative data set meets both requirements. It has sufficiently large number of transactions and data cleaning is the part of the whole process od data exploration before starting to analyze the data.
5.2.3. APRIORI ALGORITHM
This part will explain how the algorithm that will be running behind the python libraries for Market Basket Analysis. This will help the companies to understand their clients more and analyze their data more closely and attentively. Rakesh Agrawal proposed the Apriori algorithm which was the first associative algorithm proposed and future developments in association, classification, associative classification algorithms have used it as a part of the technique.
Association rule mining is seen as a two-step approach:
1. Frequent Itemset Generation: Find all frequent item-sets with support >= pre-determined minimum support count. In frequent mining usually the interesting associations and correlations between item sets in transactional and relational databases are found. In short, Frequent Mining shows which items appear together in a transaction or relation. The discovery of frequent item sets is accomplished in several iterations. Counting new candidate item-sets from existing item sets requires scanning the entire training data. In short it involves only two important steps:
a. Pruning b. Joining
2. Rule Generation: List all association rules from frequent item-sets. Calculate Support and Confidence for all the rules. Prune rules which fail minimum support and minimum confidence thresholds.
Frequent Itemset Generation scan the whole database and find the frequent itemset with a
threshold on support. Since it scans the whole database, it is the most computationally expensive step. In the real-world, transaction data for retail, can exceed to Gigabytes and Terabytes of data for which an optimized algorithm is needed to exclude item-sets that will not help in later steps. For this Apriori algorithm is used.
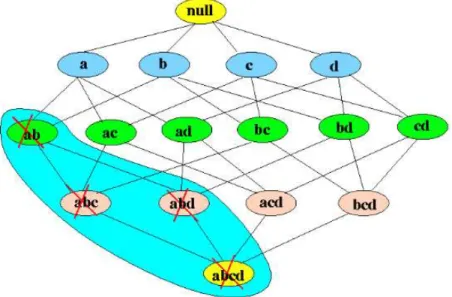
Apriori algorithm sates “Any subset of a frequent itemset must also be frequent. In other words, no superset of an infrequent itemset must be generated or tested.”
22 In the image below, which is a graphical representation of the Apriori algorithm principle. It consists of k-item-set node and relation of subsets of the k-item-set. You can notice in the figure that in the bottom is all the items in the transaction data and then you start moving up creating subsets till it reaches to the null set.
figure 3: All possible subsets
This shows that it will be difficult to generate frequent item-set by finding support for each combination. Therefore, in the figure below we can notice that Apriori algorithm helps to reduce the number of sets to be generated.
23 If an item-set {a, b} is infrequent then we do not need to consider all its super sets.
We can also look at it in the form of a transactional data-set. In the following example you can notice why Apriori algorithm is much more effective and it generates stronger association rules step by step.
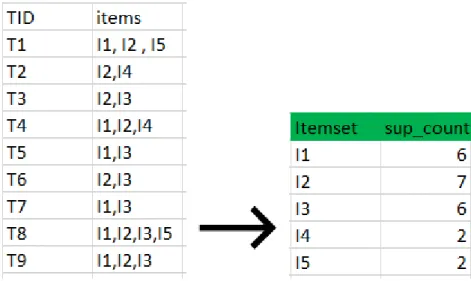
Step: 1
• Create a table containing support count of each item present in the dataset.
• Compare support count with minimum support count (in this case we have minimum support count = 2 and if support count is less than the minimum support count then remove those items), this gives us a new set of items.
figure 5: transactional data to frequent items
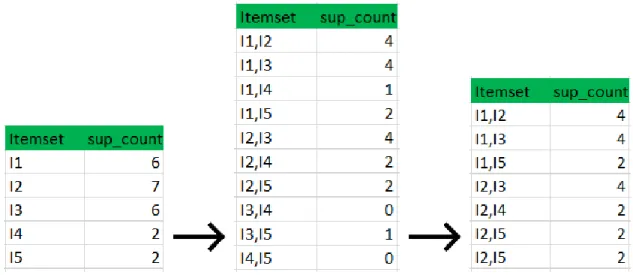
Step: 2
• This step is known as join step. We generate another set by cross joining each item with one another.
• Check if the subsets of an itemset are frequent or not and if not remove that itemset. For example, in the case below we can see that the subset of {I1, I2} are {I1}, {I2} and are frequent. We must check for the each itemset in the same way.
24 • Since we have already specified a threshold of minimum support count of 2. We compare the minimum support count and if the support count is less than the minimum support count, then remove those items. Gives us another itemset as we can see below.
figure 6: pruning and joining
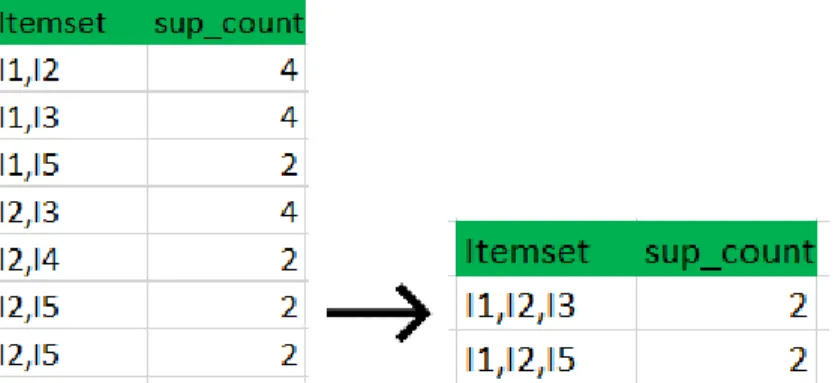
Step: 3
• After getting another dataset we follow the same step (I.e. join step). We cross join each itemset with each other. So, the itemset generated after this step will be:
{I1, I2, I3} {I1, I2, I4} {I1, I2, I5} {I1, I3, I5} {I2, I3, I4} {I2, I4, I5} {I2, I3, I5}
• Check all subsets of these item sets are frequent or not, if not then remove that item sets. For example, in this case the subset of {I1, I2, I3} are {I1, I2}, {I1, I3}, {I2, I3} which are frequent. But for {I2, I3, I4} one of the subsets is {I3, I4}, which is not frequent. So, we remove this. We do the same for every itemset.
• Once we have removed all the non-frequent item sets, find support count of the remaining itemset by searching in the dataset.
25 • Compare the minimum support count and if the support count is less than the minimum support count, then remove those items. It gives us another itemset as we can see below.
figure 7: pruning and joining again until there are no more frequent items left.
Step: 4
• We follow the same procedure again. First, we do the join step and we cross join each itemset with one another. In out example the first two elements of the item set should match.
• After, check all subsets of these item sets are frequent or not. In our example the itemset formed after join step is {I1, I2, I3, I5}. So, one of the subsets of this itemset is {I1, I3, I5} which is not frequent. Therefore, there is no itemset left anymore.
• We stop here because no more frequent itemset are found anymore. This was the first step of association rule mining.
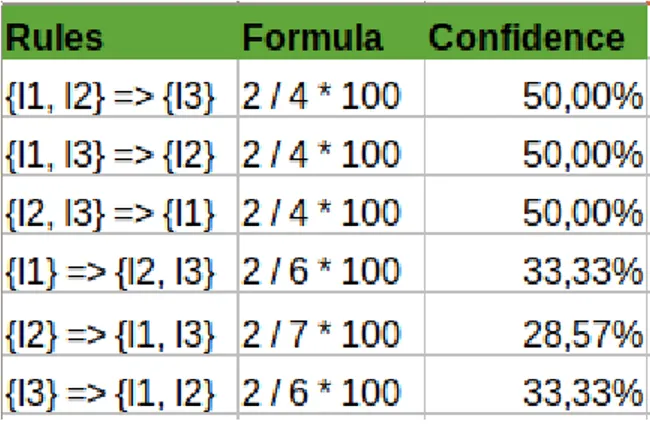
The next step will be to list all frequent item-sets and generate how strong are the association rules. For that we calculate the confidence of each rule. To calculate confidence, we use the following formula:
26 By taking an example of any frequent Item (we took {I1, I2, I3}) we will show how rule generation is done:
figure 9: calculation of confidence
So, in this case if the minimum confidence is 50% then the first 3 rules can be considered strong association rules. For example, take {I1, I2} => {I3} having confidence equal to 50% tells that 50% of people who bought I1 and I2 also bought I3.
5.2.4. OTHER ALGORITHMS USED IN MARKET BASKET ANALYSIS
Even though Apriori algorithm is the mostly used algorithm for market basket analysis. There have been different approaches taken by the researchers to build different algorithms since accuracy and efficiency are crucial factors in data mining.
The AIS algorithm was the first algorithm proposed for mining association rule. In this algorithm only one item consequent association rules are generated, which means that the consequent of those rules only contains one item, for example we only generate rules like X∩Y→Z but not those rules as X→Y∩Z. The main drawback of the AIS algorithm is too many candidate itemset that finally turned out to be small are generated, which requires more space and wastes much effort that turned out to be useless. At the same time this algorithm requires too many passes over the whole database. Apriori is more efficient during the candidate generation process. Apriori uses pruning techniques to avoid measuring certain item sets, while guaranteeing completeness. These are the item sets that the algorithm can prove will not turn out to be large. However, there are two bottlenecks of the Apriori algorithm. One is the complex candidate generation process that uses most of the time, space and memory. Another bottleneck is the multiple scan of the database. Based
27 on Apriori algorithm, many new algorithms were designed with some modifications or improvements.
As we know that apriori algorithm was an algorithm proposed by Rakesh Agrawal in 1993. Since then there have been future developments in association, classification, associative classification algorithms, which have used apriori as part of the technique.
In 1998, Liu el al. Proposed CBA the first associative classification algorithm. CBA implements the famous Apriori algorithm in order to discover the frequent rule items. CBA selects high confidence rules to represent the classifier. Finally, to predict a test case, CBA applies the highest confidence rule whose body matches the test case. Experimental results designated that CBA derives higher quality classifiers with regards to accuracy than rule induction and decision tree classification approaches.
Han et al., in 2000 presented a new association rule mining approach that does not use candidate rule generation called FP-growth that generates a highly condensed frequent pattern tree (FP-tree) representation of the transactional database. Each database transaction is represented in the tree by at most one path. FP-tree is smaller in size than the original database the construction of it requires two database scans:
1. Frequent item sets along with their support in each transaction are produced 2. FP-tree is constructed.
The mining process is performed by concatenating the pattern with the ones produced from the conditional FP-tree. One constraint of FP-growth method is that memory may not fit FP-tree especially in dimensionally large database.
In 2001, Li et al., recommended Classification based on Multiple Association Rules (CMAR). This method is an extension of FP-growth, constructs a class distribution-associated FP-tree, and mines large database efficiently. Moreover, it applies a CR-tree structure to store and retrieve mined association rules efficiently, and prunes rules effectively based on confidence, correlation and database coverage. The classification is performed based on a weighted x2 analysis using multiple strong association rules. Extensive experiments on 26 datasets from UCI machine learning database repository show that CMAR is consistent, highly effective at classification of various kinds of databases and has better average classification accuracy in comparison with CBA.
28 In 2003, Yin et al., suggested Classification based on Predictive Association Rules (CPAR). CPAR integrates the features of associative classification in predictive rule analysis. It has the following advantages:
1. CPAR generates a much smaller set of high-quality predictive rules directly from the dataset.
2. Avoids redundant rules, CPAR generates each rule by considering the set of “already generated" rules.
3. Predicting the class label of an example, CPAR uses the best k rules the example satisfies. Moreover, CPAR employs the following features to further improve its accuracy and efficiency:
1. CPAR uses dynamic programming to avoid repeated calculation in rule generation. 2. Rule generation considers all the close-to-the-best literals are selected so that important
rules will not be missed.
CPAR generates a smaller set of rules, with higher quality and lower redundancy in comparison with associative classification. As a result, CPAR is much more time efficient in both rule generation and prediction but achieves as high accuracy as associative classification.
The MCAR algorithm introduced by Fadi et al., in 2005 uses an intersection technique for discovering frequent rule items. MCAR takes advantage of vertical format representation and uses an efficient technique for discovering frequent items based on recursively intersecting the frequent items of size n to find potential frequent items of size n+1. MCAR consists of two main phases:
1. Rule generation and 2. A classifier builder.
In the first phase, the training data set is scanned once to discover frequent one rule items, and then MCAR recursively combines rule items generated to produce potential frequent rule items (candidate rule items) involving more attributes. The supports and confidences for candidate rule items are calculated simultaneously, where any rule item with support and confidence larger than minimum support and minimum confidence, respectively, is created as a potential rule.
In the second phase, the classifier builder ensures that each training instance is covered by at most one rule, which has the highest precedence among all rules applicable to it. Furthermore, there are
29 no useless rules in the MCAR classifier since every rule correctly covers at least one training instance. This approach is similar to the CBA classifier builder as each rule in CBA also covers at least one training instance. However, the way MCAR builds the classifier by locating training instances is more efficient than that of CBA due to abounding going through the training data set multiple times.
30
CHAPTER 6: PRACTICAL IMPLEMENTATION OF MARKET BASKET
ANALYSIS ON THE DATASET
6.1. DATA COLLECTION
MBA was originally designed for the use with large datasets that are usually collected by others (i.e., not the scholars or the research team). Thus, the researchers can seek out partnerships with organizations that will provide data in exchange for conducting analysis and presenting results to those who provided the data. It is also possible for the research team to collect the data but given the time involved, effort and issues to access the data sources, most MBA studies are done on the data collected by other parties. In the chapter of literature review we were able to see that researchers have been able to create data-sharing partnerships in many different fields.
In addition to using data collected by organizations, researchers can implement a third-party data collection strategy consisting of reliance on publicly available information. For example, O’Boyle and Aguinis (2012) investigated issues regarding individual performance by using data on academics, entertainers, politicians, and amateur and professional athletes.
The data for this research was collected from a Belgian known super market chain and are related to customer transactions for the period from April 2018 to June 2018. Data is extracted from the information system of the company and come exclusively from customer transactions through loyalty cards. Every transaction is a record of the purchase carried out by the customer whoever used the loyalty card at the time of the purchase.
6.2. DATASET DESCRIPTION
Number of Attributes: 11
Time period of the data: 3 months (April, May, June) Number of transactions: 78839
Number of customers: 42468
6.2.1. ATTRIBUTES
31 1 random_cust_no This is a customer ID which was replaced by random
number by the company itself.
2 orig_invoice_id This is the most important attribute of the data. It can be called invoice ID or Transaction ID. The whole analysis is based on transactions. It is explained in detail under define the transactions.
3 date_of_day This is the day when the transaction took place. 4 minute_desc For more accuracy we do not just keep track of day of
the transactions but also time of transaction. Since in case of a super market there are hundreds of transactions happening every day.
5 mikg_art_no It is the code of the article / item. 6 art_name Name of the article / item
7 catman_buy_domain_desc The categories are in hierarchy level. This is the top level of the category under which the article falls. Category_1
8 pcg_main_cat_desc This is the second level of category under which the article comes. Category_2
9 pcg_cat_desc This is the third level of category under which the article comes. This is the important level of category since we used this category in our analysis. The association rules are based on this level of category. Category_3
10 pcg_sub_cat_desc This is the last and final level of category under which the article comes. Category_4
11 quantity This is the quantity of product bought by the customer. We used this attribute to change the transactional data to binary representation.
TABLE 2:ATTRIBUTES DESCRIPTION
6.3. TOOLS USED FOR ANALYSIS
32 • Python Libraries o Pandas o Datetime o Matplotlib o Mlxtend o Random o xlsxwriter • MS Excel
6.4. DATA EXPLORING & TRANSFORMATION
Before doing anything with the data as soon as we read in the data in jupyter notebook, we start exploring it. Data exploring is the most important step for any analysis. While, exploring the data the issues that needed fixing were as follows:
1. The attribute date_of_day was read as string variable but in this research, time is a very crucial factor, so its data type was changed to date type.
2. For comparison of data of each month we needed to separate the data based on each month. Since date_of_day attribute was changed to date type. It was very easy to get the month of each transaction.
3. As explained earlier in the long tail effect the data sparsity problem tackled up to some extent by considering only the transactions in which total items purchased were more than 8 items. While exploring the data it’s important to look at the data distribution. For market basket analysis it has always been observed to have the long tail effect. The long tail effect has assumed its present connotation and dynamics by Chris Anderson [21]. This term often refers to data products purchase in supermarkets describing their distribution as a long tail in which a small number of products is purchased more frequently whereas a large one is purchased less frequently. This phenomenon creates data sparsity problem and worsens even more their elaboration. For this research from the total number of transactions there were selected, those that included at least the purchase of 8 products. That is how, to some extent, it was tried to resolve the data sparsity problem and prevent the removal of any market basket product, which may present a risk of information loss. Figure below shows the curve of long tail effect.
33
figure 10: long tail effect in our dataset
Some general exploring of data was done after all the fixes. In the table we can see the number of unique transactions, number of unique customers, number of unique articles sold, and number of articles sold in the period of 3 months as well as in each month (i.e. April, May, June).
Time 3 months April May June
Number of Transactions 78839 24803 27710 26326
Number of Customers 42468 18743 20436 19347
Number of Unique Articles Sold 42694 31286 31035 31462
Number of Total Articles Sold 1541130 482776 544023 514331
TABLE 3:DATA EXPLORING
Since there are several categories and sub categories in the super market. We can easily identify the hierarchy of the categories based on the number of unique categories in the table below.
Category/Sub category Total
catman_buy_domain_desc (Category_1) 87
pcg_main_cat_desc (Category_2) 348
pcg_cat_desc (Category_3) 1334
pcg_sub_cat_desc (Category_4) 3783
TABLE 4: CATEGORY AND SUBCATEGORIES DISTRIBUTION
6.5. BINARY REPRESENTATION
Binary data are used in information systems because data are categorized for attributes value by 0 and 1. It represents either the attribute category is present or absent in the data.
For super markets, the databases are very large and usually represented in binary format. The binary format is a matrix in which Transactions forms the rows and the items/ attributes forms the
34 columns. For a specific transaction, if an item is purchased then the matrix position is made as 1. If the item is not purchased in the transaction, then the matrix position will be made 0. Binary data sets are interesting and useful due to its computational efficiency and minimal storage capacity.
6.6. ANALYSIS & DISCUSSION 6.6.1. Association rules from dataset
Since we have the data for three months, we divide the data into subset of each month to compare the analysis output of each month.
Firstly, we look at the comparison of number of rules when the minimum support count is less than 0.01 and minimum lift is 1.
Secondly, for all the data and for each of the subsets we have applied market basket analysis and recorded the results of the three indicators, i.e. confidence, support and lift. For every application of a market basket analysis process, the minimum level of confidence, support and lift established in the program, is 0.5, 0.01 and 1 respectively. The results of the number of rules that came out, are registered in table below.
Time Minimum support = 0.01
Lift >= 1 Minimum support = 0.01 Confidence >= 0.5 Lift >= 1 3 months 17282 1534 April 16564 1371 May 19380 1760 June 19272 1900
TABLE 5:ASSOCIATION RULES WITH DIFFERENT THRESHOLDS
In the first section we looked at the number of association rules with minimum support 0.01 and lift greater than 1. This criterion was applied to overall data as well as to monthly data. Our results were:
May > June > 3 months > April
We also calculated the number of association rules by adding degree of confidence greater than 0.5, the result changed to:
35 6.6.2. Time development of association rules
The 128 rules, at the level of 1334 subcategories of products, resulting from the extraction process of overall 3 months data were used as a base for additional rules analysis at monthly level. For each of the 128 rules, there have been recorded the values for the three indicators, lift, support and confidence during each month (i.e. April, May, June). Thus, the table was created with the monthly development of association rules measurement indicators. The table can be found at the end of the document in ANNEX section in the end of the document.
In the end of the ANNEX we can notice that there are 2 association rules {'COLA KZH'} =>
{'GROENTEN'} and {'GROENTEN'} => {'COLA KZH'} which do not exist in the month of
May, because they didn’t pass the threshold of minimum support of 0.01 and lift greater than equal to 1. But these two rules only do not exist in the month of May They exist in the month of April and June.
Similarly, there are 2 association rules {'GROENTEN'} => {'KOEKJES'} and {'KOEKJES'}
=> {'GROENTEN'}which do not exist in the month of April and June. But they do exist in the month of May.
Whereas, the 128 association rules where chosen based on the threshold of minimum support as 0.05 and lift greater than and is equal to 1 from overall dataset. Whereas, to match with these 128 association rules the threshold set for monthly data was minimum support 0.01 and lift >= 1 Through these examples we can also say that there is a difference in the strength of the association rules in different time periods Its not just minor fluctuations in their strengths but sometimes it can be greater.
6.6.3. Top 30 association rules comparison
To show the fluctuation of degree of confidence of top 30 rule in each month. We have selected the rules with highest degree of confidence. In the table below, we can see the top 30 rules and their degree of confidence in 3 months all together as well as individually.
We can notice some major differences in rule number 4, 9, 18 and 19 in which we can see that those rules had lower degree of confidence in the month of April compared to the month of May and June. Also, in rule number 30 we can see that the degree of confidence for this rule is increasing with time.