Development and Application of Coatings on PET
Master Thesis
Of
Vasco Benigno
Developed in the curricular unit Dissertation in
GOVI NV
Supervisor at FEUP: Prof. Fernão Magalhães Supervisor at GOVI NV: An Creyns
Chemical Engineer Department
CONFIDENTIALITY NOTICE – IMPORTANT – PLEASE READ FIRST
This document may contain confidential information proprietary to GOVI NV. It is therefore strictly forbidden to publish, cite or make public in any way this document or any part thereof without the express written permission by GOVI NV. Under no circumstance this document may be communicated to or put at the disposal of third parties; photocopying or duplicating it in any other way is strictly prohibited.
Disregarding the confidential nature of this document may cause irremediable damage to GOVI NV.
CONFIDENTIALITY NOTICE – IMPORTANT – PLEASE READ FIRST
Este documento pode conter informação confidencial propriedade da GOVI NV. Portanto é estritamente proibido publicar, citar ou tornar público este documento ou qualquer parte dele sem a expressa permissão escrita pela GOVI NV. Sob nenhuma circunstância este documento pode ser comunicado ou posto à disposição de uma terceira parte, e fotocopiar ou duplicar este de qualquer forma é estritamente proibido.
Desconsiderar a natureza confidencial deste documento pode causar irremediáveis danos à GOVI NV.
Acknowledgements
First and foremost, I would like to thank my supervisor, An Creyns, for the kindness, patience and support. I’m really grateful for your help in every step of the way.
Dirk for the mentorship and guidance and Tom for the insights and invaluable assistance. The encouragement and helpful advice provided were crucial.
Professor Fernão for the remarks and help provided for the oral presentation.
Professor Madeira and Jan Cocquyt for making this opportunity possible. I will be forever grateful.
As always, Family and Friends, that held me down until everything came around. Your love is powerful and sustaining.
Thank you for reminding me daily that my life is truly blessed.
Finally I like to extend my deepest gratitude to everyone that works at GOVI NV. You made me feel at home.
Obrigado.
Resumo
O polietileno tereftalato (PET) é um termoplástico, amplamente utilizado em aplicações alimentares, e noutras áreas, devido ao seu perfil e propriedades versáteis. Possui um excelente equilíbrio entre propriedades físicas e mecânicas, propriedades de barreira, processabilidade e maleabilidade, características ecológicas, toxicológicas e econômicas.
Hoje em dia, a indústria de PET tem um grande interesse e preocupação, relativamente à longevidade e qualidade dos produtos embalados utilizando PET. Há também uma grande demanda por embalagens cada vez mais recicláveis e não baseadas em petróleo, uma vez que geram menos problemas ambientais e poluição. É por isso, sem qualquer surpresa, que as embalagens de PET estão constantemente a ser alvo de melhorias e optimizações.
Assim, com este projecto, pretende-se encontrar e desenvolver revestimentos para PET que exibam uma boa barreira, quer para o oxigénio, quer para o vapor de àgua. O revestimento tem, ao mesmo tempo, de ser economicamente viável e de fácil aplicação. O aspecto final da garrafa, após a aplicação de todos os revestimentos, é também um parâmetro de grande importância e que foi constantemente analisado.
Relativamente à barreira contra a saída de oxigénio, a variação de concentração de oxigénio foi medida para garrafas vazias e cheias de àgua, revestidas com diferentes polímeros e com diferentes camadas. De todos os resultados obtidos, os que revelaram uma melhoria significativa na barreira contra a saída de oxigénio, foram, uma combinação de 3 camadas de PEC e uma combinação de 3 e 5 camadas de PVOH6.
No caso da barreira contra a saída de vapor de àgua, garrafas completamente cheias com àgua foram revestidas com PVDC. Este polímero demonstrou melhorias ao nível da barreira, quando comparado com a referência.
Abstract
Polyethylene terephthalate (PET) is a barrier polyester, which is widely used in food and beverage packaging applications due to his useful property profile.
It is used in rigid food and beverage containers due to a good balance of physical and mechanical properties, barrier properties, processability and formability, ecological and toxicological characteristics, and economics.
Nowadays, the shelf life of the products is a big concern for the PET industry. There’s also an increasing demand for recyclable, non-petroleum based packaging that create less pollution and environmental problems. So, it’s without a surprise that companies are constantly trying to optimize the packaging properties of PET.
Therefore this project intends to find and develop coatings for PET that display a good gas barrier against oxygen as well as a good moisture barrier. At the same time, the coating should be economically viable and easy to apply.
Different types of coatings were applied, which were then tested for different parameters, mainly the oxygen and water barrier. The general appearance of the bottle, after all the coatings were applied, was also constantly analyzed.
For the oxygen barrier, the concentration variation was measured for empty and filled bottles, coated with different polymers and a different number of layers. A combination of 3 layers of Pectin and a combination of 3 and 5 layers of PVOH6, showed to the best results in terms of improving the gas barrier, among all the coatings tested.
For the water vapor barrier, bottles completely filled with water were coated with PVDC. This polymer showed a good improvement in the moisture barrier.
Declaração
Declara, sob compromisso de honra, que este trabalho é original e que todas as contribuições não originais foram devidamente referenciadas com identificação da fonte.
Vasco Benigno 04 de Fevereiro de 2014
Index
1 Introduction ... 1
1.1 Background and Project Presentation ... 1
1.2 GOVI – Company Presentation ... 7
1.3 Work Contributions ... 7
1.4 Thesis Outline ... 8
2 State of the Art ... 9
2.1 Barrier Properties ... 9
2.1.1 Factors Affecting Permeability ...9
2.2 Barrier Coatings ... 16
2.2.1 Synthetic Polymers ... 17
2.2.2 Natural Polymers ... 21
3 Technical Description and Results Discussion ... 25
3.1 Experimental Work ... 25
3.1.1 Bottle Coating ... 25
3.1.2 Gas Barrier Test ... 26
3.2 Results and Discussion ... 31
3.2.1 Gas Barrier Test ... 31
3.2.2 Water vapor test ... 37
3.2.3 Aluminum Scales ... 39
4 Conclusions and future work ... 42
List of Figures
Figure 1 – PET chemical structure.. ... 1
Figure 2 - PET production from DMT. ... 2
Figure 3 – PET production from PTA.. ... 2
Figure 4 – Evolution of the weight of 0,5 Liter PET bottles. ... 3
Figure 5 – Percentage of recycled PET around the world.. ... 4
Figure 6 – Schematic illustration of the injection molding process. ... 5
Figure 7 – Blow molding of PET preforms. ... 6
Figure 8 – GOVI locations around Europe. ... 7
Figure 9 – Permeation mechanism for gas and water vapor molecules through a plastic film. ... 10
Figure 10 – Effect of temperature on oxygen permeability at 75% relative humidity. ... 12
Figure 11 – Effect of CED for different barrier polymers. ... 13
Figure 12- Effect of Crystalline content on gas permeability in polyethylene at 25ºC... 14
Figure 13-Effect of relative humidity on oxygen permeability of hydrophilic barrier polymer. ... 15
Figure 14 – Polyvinyl alcohol chemical structure ... 18
Figure 15 – Ethylene Vinyl alcohol chemical structure.. ... 19
Figure 16 – Oxygen permeability of some selected polyemers at 23ºC and 0% relative humidity.. ... 19
Figure 17 – Polyvinylidene chloride chemical structure. ... 20
Figure 18 – Pectin chemical structure ... 22
Figure 19 – Comparison of water vapor and oxygen transmission rate of conventional plastics and biopolymers at a thickness of 100 µm. ... 23
Figure 20 – Bottles and preforms drying after being coated. ... 26
Figure 21 – Oven where the bottles are placed to be measured twice a week. ... 28
Figure 23 – Testing blocs used for the aluminum scales test. ... 30
Figure 24 – Oxygen barrier test results for empty bottles with 3 layers of PVOH6. ... 32
Figure 25 - Oxygen barrier test results for empty bottles with 5 layers of PVOH6. ... 33
Figure 26 - Oxygen barrier test results for empty bottles with 3 layers of Pectin, dried with a hairdryer. ... 35
Figure 27 - Oxygen barrier test results for empty bottles with 3 layers of Pectin, dried with at room temperature. ... 36
Figure 28 – Water vapor barrier test results for bottles coated with PVDC. ... 38
Figure 29 – Evolution of the oxygen increase. ... 40
Figure 30 - Oxygen barrier test results for bottles with one layer of whey type B. ... 45
Figure 31 - Oxygen barrier test results for bottles with one layer of whey type A. ... 46
Figure 32 - Oxygen barrier test results for bottles with one layer of EVOH1. ... 46
Figure 33 - Oxygen barrier test results for bottles with three layers of EVOH1. ... 47
Figure 34- Oxygen barrier test results for bottles with one layer of EVOH2. ... 47
Figure 35 - Oxygen barrier test results for bottles with three layer of EVOH2. ... 48
Figure 36 - Oxygen barrier test results for bottles with one layer of Pectin. ... 49
Figure 37 - Oxygen barrier test results for bottles with three layer of Pectin using the standard method. ... 49
Figure 38 - Oxygen barrier test results for bottles with three layer of Pectin dried in the oven. ... 50
Figure 39- Oxygen barrier test results for bottles with a mixture of PEC and VAC. ... 50
Figure 40 - Oxygen barrier test results for bottles with three layers of PVOH4. ... 51
Figure 41- Oxygen barrier test results for bottles with three layers of PVOH5. ... 52
Figure 42 - Oxygen barrier test results for bottles with five layers of PVOH5. ... 52
Figure 43 - Oxygen barrier test results for bottles with three layers of PVOH7. ... 53
Figure 44 - Oxygen barrier test results for bottles with five layers of PVOH7. ... 53
Figure 45 - Oxygen barrier test results for bottles with different layers of PVOH6, performed in filled bottles. ... 54
List of Tables
Table 1 – OTR and WTR values of some selected polymers ... 17 Table 2 – High oxygen barrier polymers ... 20 Table 3 – Calculated slopes for the PVOH6 coating analyzed in the oxygen barrier test. . 32 Table 4 - Calculated slopes for the PVOH6 coating analyzed in the oxygen barrier test. . 33 Table 5 - Calculated slopes for the Pectin coating analyzed in the oxygen barrier test. .. 35 Table 6 - Calculated slopes for the Pectin coating analyzed in the oxygen barrier test. .. 36 Table 7 – Evolution of the weight overtime for both the reference bottles and the bottles coated with PVDC. ... 37 Table 8 – Calculated slopes for the coatings analyzes in the water vapor test. ... 39
Glossary
List of unitsA Area m2
CED Cohesive Energy Density cal.cm-3
D Diffusivity cm2.s-1
D0 Pre-exponential factor s-1
Da Penetrant diffusion coefficient on the amorphous phase cm2.s-1
Ed Activation energy for diffusivity J.mol-1
Ep Activation energy for permeability J.mol-1
Hs
Ksv
Heat of adsorption of penetrant in the polymer
Stern-Volmer Constant J.mol
-1
M-1
m Total mass of the bottle g
mt
mw
Mass of the bottle over time
Initial mass of water g g
OTR Oxygen Transmission Rate nmol.m-1.s-1
P Permeability cm3.cm-1.s-1.bar-1
P0 Pre-exponencial factor s-1
R Constant of ideal gases J.mol-1.K-1
RH Relative humidity %
S Solubility cm-3.cm-2.bar-1
S0 Pre-exponencial factor s-1
Sa Solubility coefficient in the amorphous regions cm-3.cm-2.bar-1
T Temperature K
Tg Glass transition temperature K
Tm Melting point K
WTR Water Vapor Transmission Rate nmol.n-1.s-1
𝜏 𝜏 𝛽
Turtuosity
Luminescence decay time in presence of oxygen Chain immobilization factor
𝜑𝑎 Amorphous phase volume fraction
List of Abbreviations
AN Acrylonitrile AmNY Amorphous nylon BON Biaxially oriented nylon DMT Dimethyl terephthalate EVOH Ethylene vinyl alcohol HDPE High density polyethylene LDPE Low density polyethylene MXD-6 Nylon
PAN Polyactrylonitrile PE Polyehtylene
PEC Pectin
PET Poly(ethylene terephthalate) PP Polypropylene
PS Polystyrene PSC
PTA Polysaccharide Terephthalic acid PU Polyurethane PVA Polyvinyl acetate PVB Polyvinyl butyral PVC Polyvinyl chloride PVDC Polyvinylidene chloride PVOH Polyvinyl alcohol RT Room temperature VAC Vinyl copolymer
1 Introduction
1.1 Background and Project Presentation
PET - Polyethylene terephthalate: Introduction
Polyethylene terephthalate (PET) is a barrier polyester, which is widely used in food and beverage packaging applications. It is a linear, thermoplastic glassy polymer made from terephthalic acid (PTA) and ethylene glycol or dimethyl terephthalate (DMT) and ethylene glycol. [1]
Figure 1 – PET chemical structure.
Image adapted from (http://www.essentialchemicalindustry.org).
PET from DMT is made by transesterification route by reaction of dimethyl terephthalate with ethylene glycol followed by poly-condensation. Polyester through transesterification route was more common earlier due to non-availability of purified terephthalic acid. During transesterification, methanol is obtained as by product. [2]
Figure 2 - PET production from DMT. Image adapted from [2].
PET from purified terephthalic acid (PTA) is made by esterification route by reaction of purified terephthalic acid (PTA) with ethylene glycol followed by polycondensation. [2]
Figure 3 – PET production from PTA. Image adapted from [2].
PET was first synthesized in North America in the mid-1940s by DuPont chemists searching for new synthetic fibers, but it was only in the early 1970s, that the technology was developed for blow-stretch molding PET into bottles. Finally, the PET bottle was patented in 1973. [3]
Today, more than half of the world’s synthetic fiber is made from PET, which is called “polyester” when used for fiber or fabric applications or PET when used for containers and
other purposes, and it’s regarded as the world’s packaging choice for several types of food and beverages. [3]
PET has a very useful property profile. At ambient conditions, it is strong, stiff, ductile, and tough. It is used in rigid food and beverage containers due to a good balance of physical and mechanical properties, barrier properties, processability and formability, ecological and toxicological characteristics, and economics. It can be oriented by stretching during molding and extrusion, which further increases its strength, stiffness, and barrier properties. [4]
Since PET is a lightweight material, products packaged in PET can be packed and shipped efficiently, enabling lighter secondary packaging, and reducing fuel requirements and greenhouse gas emissions during transport. PET’s unique geometric properties mean there are more potential opportunities for light-weighting efficiencies. [5]
To maximize these efficiencies less plastic resin per package is being used by the manufacturers, without compromising package strength and integrity. [5]
Figure 4 – Evolution of the weight of 0.5 liter PET bottles. Image adapted from [5].
The recycling infrastructure for PET is well-established, from widespread collection and separation to further processing and end use. It’s the most recycled plastic in the world and can be recycled multiple times into a wide variety of end products including: fiber, fiberfill,
cups and take-out containers. This results in the conservation of raw materials, reduces the need for virgin petrochemical feedstock, less energy is required when converting recycled PET to a virgin equivalent, whether flake or pellet, less energy use results in less greenhouse gas emissions. [5]
Figure 5 – Percentage of recycled PET around the world. Image adapted from (http://chemical.ihs.com).
PET Production
PET Preforms
The PET preform is accomplished through a molding process.
The fused PET injected into a mold become a preform, which, by an additional processing step (blowing), takes the form of a bottle.
A preform is made by a "finish" (bottleneck), which will not change in the blowing process. "Finish" diameter and thread type are the main features of the preform, features that determine the kind of screw bottle cap and the use of the bottle.
On the other hand, the tubular structure, will form the bottle in the blowing and molding processes and it determines the weight of the final product; diameter, length and shape are the key elements that give the main features to the blown container.
The PET polymer, used for the production of preforms doesn't have a color, it's almost transparent, but once mixed with coloring additives, it can have different shades of color. [6]
The process is simple, the heated PET in the molten form is injected into the injection chamber, until the chamber is full.
Figure 6 – Schematic illustration of the injection molding process.
Image adapted from (http://newengineeringpractice.blogspot.be/2011/08/manufacturing-of-plastic-bottles.html).
Once the chamber is full, the screw pushes forward to fill the injection cavity with molten plastic through the nozzle into the mold.
The temperature within the injection molding machine are different, at the rear end of the machine the temperature should be around 275°C, at the middle of the machine about 282°C, at the nozzle about 280°C. And at the runner the temperature should be around 270°C for the bottle formed to have optimum specifications.
Subsequently the molten plastic within the mold, called the preform, should be cooled. The cooling water used to cool the preform should be in the temperature range between 15~20°C, the pressure also has to be controlled, therefore a water chiller is used. The pressure should be kept around 500,000 Pa or 5Bar. [7]
PET Bottles
Blow molding is a manufacturing process by which hollow plastic parts are formed out of thermoplastic. Blow molding is a process of inflating a hot, hollow, thermoplastic preform or parison inside a closed mold so its shape conforms to that of the mold cavity. [8]
Figure 7 – Blow molding of PET preforms.
Image adapted from (http://www.cm-pet.com.tw/services.htm).
The process is again, fairly simple.
The preform heated at about 110°C is then inserted in a hollow mold whose shape corresponds to the shape of the finished bottle. The shaping of the bottle happens through a double simultaneous action: the stretching of the material using a blowpipe introduced in the neck of the preform and a transversal forming of the bottle by blowing compressed air in the preform, hence the name ‘stretch blow molding’. Once cooled off the bottle is ejected from the mold and has – because of the stretch blow process in the thermoelastic phase of the material – higher mechanical properties than the same bottle produced by extrusion blow molding. [9]
1.2 GOVI – Company Presentation
Incorporated in 1910, GOVI has grown into a dedicated manufacturer of engineered process-chemicals. GOVI’s tailor made chemicals supply a variety of industries such as dust binding, insulation, paper, printing, rope and netting, textiles and wood. [10]
It’s located in Drongen, Belgium (Headquarters), with active production sites in Serbia and Italy.
Figure 8 – GOVI locations around Europe. Image created using (http://www.amcharts.com).
1.3 Work Contributions
As the impact we create on our environment becomes an ever greater concern, the world continues to look for solutions that are truly sustainable.
Bio Coatings can help, providing valuable function while conserving resources, improving efficiency and avoiding waste, often throughout the entire life cycle of the product.
Therefore, this projects intends to help replace the oil-based films with bio based ones, making the application of the coatings easier, looking for a competitive advantage due to a more sustainable and greener image, but also some improved technical properties, mainly the barrier properties.
1.4 Thesis Outline
This dissertation comprises four chapters.
Chapter one, is an introductory chapter, which provides background information, underlying motivation, and overall goals of this research.
Chapter two provides a broad overview of various types of barrier polymers and structures and their permeability characteristics. This chapter is adapted from a review paper published in the Encyclopedia of Polymer Science and Technology.
Chapter three describes the experimental techniques used in this research project, along with the respective results and discussion.
Finally, chapter four summarizes the results from this research and provides recommendations for future work in this area.
2 State of the Art
The barrier properties of polymers holds a big importance in today’s packaging industry. A carbonated soft drink may lose its CO2, Juice will lose Vitamin C, Liquid products will evaporate
slowly through a container, Oxygen-sensitive foods, such as ketchup, will not retain proper color and freshness. So, finding a way to improve the gas and moisture barrier, increasing shelf life and product quality is vital.
2.1 Barrier Properties
The use of polymer materials in food packaging field is one of the largest growing market area. Actually the optimization behavior of packaging permeability is of crucial importance, in order to extend the food shelf-life and to reach the best engineering solution. Studying the permeability characterization of the different polymer material (homogeneous and heterogeneous polymer system) to the different packaging gases, in different environmental condition, is crucial to understand if the selected material is adapted to the chosen food contact field. Temperature and humidity parameters are of crucial importance for food quality preservation, especially in real life situations, like food market. [11]
2.1.1 Factors Affecting Permeability
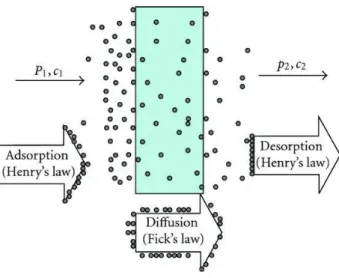
In contrast to glass or metal packaging materials, packages made with plastic are permeable at different degrees to small molecules like gases, water vapor, and organic vapor and to other low molecular weight compounds like aromas, flavor, and additives present into food. As a consequence of the barrier properties of the material, the transfer of this molecules ranges from high to low. The knowledge of the solution/diffusion/permeation behaviors of these molecules through the polymer film has become more and more important in recent years, especially for polymers used in the food packaging field where contamination from external
Figure 9 – Permeation mechanism for gas and water vapor molecules through a plastic film. Image adapted from [12]
Permeability, as reported in the literature, is defined as the quantification of permeate transmission, gas or vapor, through a resisting material. So, the concept of permeability is normally associated with the quantitative evaluation of the barrier properties of a plastic material. [11]
In a material without defects like pinholes or cracks, the primary mechanism for gas and water vapor to flow through a film or coating is an activated diffusion. This means that the permeate dissolves in the film matrix at the higher concentration side, diffuses through the film, driven by a concentration gradient, and evaporates from the other surface. Differences in the solubility of specific gases may influence the diffusivity of gases across the film. The second step of the permeability phenomenon, the diffusion, depends on the size, shape, and polarity of the penetrating molecule of the permeant and on the crystallinity, degree of cross-linking and polymer chain segmental motion of the polymer matrix. [11]
Temperature
The temperature dependence of permeability and diffusivity are usually modeled using Arrhenius equations of the following forms:
𝑃 = 𝑃0exp (− 𝐸𝑝 𝑅𝑇) (1) 𝐷 = 𝐷0exp (− 𝐸𝐷 𝑅𝑇) (2)
Where Ep and ED are activation energies for permeation and diffusion, and P0 and D0 are
pre-exponential factors. The effect of temperature on solubility is usually expressed by a van’t Hoff relationship:
𝑆 = 𝑆0exp (−
𝛥𝐻𝑆
𝑅𝑇) (3)
Where S0 is a pre-exponential factor, and ∆Hs is the heat of sorption of penetrant in the
polymer. [12]
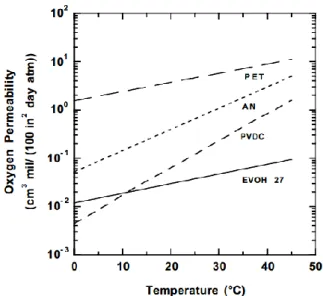
Temperature has two pronged effects on the permeability. One, it provides more energy to the permeant molecule to go through the polymer wall, and two, as the temperature goes up, the chain in the amorphous region of the polymer becomes more mobile, allowing the permeant to pass through. In other words, the barrier of polymer goes down while permeant molecules have more energy to cross the barrier. [13]
Therefore, permeability increases with increasing temperature. To illustrate this behavior, Figure 10 shows the effect of temperature on oxygen permeability of four widely used barrier polymers.
Figure 10 – Effect of temperature on oxygen permeability at 75% relative humidity. Image adapted from [12]
Chemical Structure
The presence of polar groups on or in polymer chains often increases chain rigidity, which can increase glass transition temperature and improve mechanical properties, and increases packing density. [12]
Polymer chain interactions can be quantified in terms of cohesive energy density (CED), and CED has a strong influence on penetrant diffusion. [12]
CED of a polymer is the square of its solubility parameter and characterizes the strength of attraction (or interactions) between the polymer chains. [12]
Solubility of relatively non-polar penetrants usually has a weaker dependence on CED than diffusivity, and hence, the logarithm of permeability should decrease linearly with increasing CED, as shown in Figure 11. [12]
Figure 11 – Effect of CED for different barrier polymers. Image adapted from [12]
Penetrant diffusivity, and hence permeability, can also be decreased by adding substituents to the polymer chain that reduce chain flexibility. Bulky side groups or rigid linkages such as aromatic groups decrease chain flexibility and hence, reduce penetrant diffusion coefficients. Flexible linkages, such as ether or methylene groups, produce the opposite effect. [14]
Changes in molecular structure of the polymer often affect more than one factor influencing permeability and the net effect can be difficult to anticipate. For example, addition of bulky side groups can stiffen the polymer chains, which is expected to reduce the diffusion coefficients. However, the same modification could also decrease chain packing in the amorphous phase and reduce the level of crystallinity in the polymer, which are expected to increase the diffusion coefficients. The net result of these competing effects can be difficult to predict a priori. [14]
Crystallinity
Crystallinity is an important factor because crystallites themselves are impermeable. Thus a permeant must seek out amorphous zones in order to penetrate a material. A lower degree of
crystallinity yields greater permeability. The polymer state with the highest degree of crystallinity provides the least amount of permeation, thus the better barrier. [15]
Crystallinity influences both solubility and diffusion coefficients. For most polymers and penetrants of interest, crystalline regions, which are much more dense and well-ordered than amorphous regions, preclude penetrant sorption, thereby reducing penetrant solubility. Additionally, the presence of impermeable crystallites in a polymer matrix act as barriers to diffusion, increasing the path length for diffusion and, in some cases, increasing chain rigidity, which also reduces diffusion coefficients. [12]
Figure 12 shows the effect of crystallinity on gas permeability in polyethylene at 25°C, and it’s verified that permeability decreases with increasing crystallinity primarily due to decreasing diffusion coefficients.
Figure 12- Effect of Crystalline content on gas permeability in polyethylene at 25ºC. Image adapted from [12]
The simplest and most commonly used model for the effect of crystallinity is expressed by the following relationship:
𝑃 = (𝑆𝑎𝜑𝑎) (−
𝐷𝑎
Where Da is the penetrant diffusion coefficient in the amorphous polymer, 𝜏 is a geometric
impedance (i.e., tortuosity) factor, and 𝛽 is a chain immobilization factor. Sa is the solubility
coefficient in the amorphous regions of the polymer and 𝜑𝑎 is the amorphous phase volume
fraction. [12]
Humidity
Hydrophilic barrier polymers, with the exception of certain amorphous polyamides, lose their barrier properties with increasing relative humidity as shown in Figure 13.
Figure 13-Effect of relative humidity on oxygen permeability of hydrophilic barrier polymer. Image adapted from [12].
This is because water acts as a plasticizer and increases the free volume of the polymer. However, at low to moderate relative humidity, amorphous polyamides and polyethylene terephthalate show slightly improved barrier properties with increasing relative humidity. This behavior has been explained as the water molecules not swelling the polymer, but occupying some the polymer free volume sites instead, resulting in reduction in permeability of other gases. [12]
2.2 Barrier Coatings
PET is an important polymer for packaging applications and is established for various kinds of packaging solutions like bottles, containers or foils. In the field of beverage bottling, PET is widely used due to its advantages compared to glass bottles to be lightweight and unbreakable. The only disadvantage of polymer packaging materials is a reduced gas barrier property compared to glass or metal. These barriers, can be modified and increased using barrier polymers. [15]
Barrier polymers can be broadly defined as macromolecules having the ability to significantly restrict the passage of gases, vapors, and liquids. Since all polymers restrict the transport of penetrants to some degree and the barrier performance of polymers to different penetrants depends on a variety of factors, it is difficult to provide a concise, objective definition. In a practical sense, however, the definition of a barrier polymer depends upon the end use requirements, and a material that provides sufficient barrier for a particular application can be considered to be a barrier polymer for that purpose. [16]
Polymers have found wide acceptance as alternatives to traditional materials like glass, paper, and metals, in food, beverage, and other packaging industries. A key characteristic of glass and metals as packaging materials is their total barrier to transport of gases and vapors. While polymers can provide an attractive balance of properties such as flexibility, toughness, light weight, formability, and printability, they do allow the transport of gases and vapors to some extent. Unfortunately, an inexpensive, recyclable polymeric material possessing high barrier properties to every gas or vapor in addition to good mechanical, thermal, and optical properties is not available. For this reason, the selection of a barrier polymer for a particular application typically involves tradeoffs between permeation, mechanical, and aesthetic properties as well as economic and recycling considerations. Additionally, there is an ongoing interest in optimizing property sets of barrier polymers to provide an efficient and economical method for packaging and for extending the shelf life of packaged foods and beverages. [12]
Barrier polymers can be broadly classified as high barrier, and moderate to low barrier polymers, depending on the degree to which they restrict the passage of gases like O2 or CO2
and water vapor. Values of Oxygen Rate Transmission (OTR) and Water Vapor Transmission Rate (WTR) of some commonly used barrier polymers can be found in Table 1. [12]
Table 1 – OTR and WTR values of some selected polymers [17]
Barrier Polymer OTR (nmol/(m.s) WTR (nmol(/(m.s)
Vinylidene chloride copolymers
(PVDC) 0,02-0,30 0,005-0,05
Polypropylene 300-500 0,16
Ethylene-vinyl alcohol (EVOH)
32%mol ethylene 0,03 0,96 44%mol ethylene 0,12 0,36 Polyethylene Low density 500-700 0,35 High density 200-400 0,095 Polyethylene terephthalate (PET) 6-8 0,45
Polyvinyl alcohol (PVOH) 0,12 ---
2.2.1 Synthetic Polymers
Synthetic polymers are derived from petroleum oil, and made by scientists and engineers. Man-made polymers are used in a wide array of applications: food packaging, paper, films, fibers, tubing, pipes, etc. The personal care industry also uses polymers to aid in texture of products, binding, and moisture retention (e.g. in hair gel and conditioners). [18]
Polyvinyl Alcohol
Polyvinyl alcohol (PVOH) is a water-soluble synthetic polymer. It has the idealized formula [CH2CH(OH)]n. It is used in papermaking, textiles, and a variety of coatings. It is white
(colorless) and odorless. [19]
Figure 14 – Polyvinyl alcohol chemical structure. Image adapted from [19]
Polyvinyl alcohol is produced commercially from polyvinyl acetate, usually by a continuous process. The acetate groups are hydrolyzed by ester interchange with methanol in the presence of anhydrous sodium methylate or aqueous sodium hydroxide. The physical characteristics and its specific functional uses depend on the degree of polymerization and the degree of hydrolysis. Polyvinyl alcohol is classified into two classes namely: partially hydrolyzed and fully hydrolyzed. [20]
PVOH is known for its good gas-barrier properties. Low polarity gas molecules such as oxygen and carbon dioxide exhibit only weak interactions with the highly polar hydroxyl groups in PVOH. This weak interaction combined with the presence of crystalline regions reduces the permeability rates of the gases, resulting in the good gas-barrier properties of PVOH. [20]
Ethylene Vinyl Alcohol
Ethylene vinyl alcohol (EVOH) is one of the best known flexible thermoplastic oxygen barrier materials in use today. The copolymer is prepared by polymerization of ethylene and vinyl acetate to give the ethylene vinyl acetate (EVA) copolymer followed by hydrolysis. [21]
Figure 15 – Ethylene Vinyl alcohol chemical structure.
Image adapted from (http://www.google.com/patents/US20100221560).
EVOH has one of the lowest oxygen permeability reported among polymers commonly used in packaging. Figure 16 compares oxygen permeability of EVOH with that of other common polymers. Only polyvinyl alcohol (PVOH) has oxygen permeability lower than that of EVOH. [12]
Figure 16 – Oxygen permeability of some selected polymers at 23ºC and 0% relative humidity. Image adapted from [12].
EVOH has –OH groups in its structure which makes the copolymer hygroscopic and therefore it absorbs moisture. The gas barrier properties are adversely affected by absorbed moisture, so packaging applications involving high humidity’s either during processing or in use need to be closely monitored. [22]
EVOH is soluble in water, however, even under high humidity conditions, it still has excellent barrier properties, which will recover with time as explained in Table 2.
Table 2 – High oxygen barrier polymers [22]
Oxygen Permeability (cc.mm/m2.day.atm)
0% Relative Humidity 100% Relative Humidity
PVDC 0.004 0.004
EVOH 0.003 0.25
PET 1.5 1.5
Polyvinylidene Chloride
Polyvinylidene chloride (PVDC) is a copolymer of vinylidene chloride with other monomers including vinyl chloride, acrylic esters and carboxyl containing monomers. [12]
Figure 17 – Polyvinylidene chloride chemical structure. Image adapted from (http://pslc.ws/macrog/kidsmac/saran.htm).
PVDC can be used as a water-based dispersion or solvent-based coating for application to the external surface of containers like PET bottles to improve the gas and moisture barrier. [12]
PVDC does have benefits over other competing barrier polymers, it has excellent gas barrier and moisture barrier properties, as well as being a good chemical barrier against aroma and flavors, and it is resistant to oils and fats. It does, however, have particular disadvantages in that it is more difficult to process, requires special equipment for extrusion and cannot be processed by injection moulding. These issues, have restricted its growth as a polymer for packaging at the expense of other barrier polymers. [22]
2.2.2 Natural Polymers
This group consists of naturally occurring polymers and chemical modifications of these polymers. Cellulose, starch, lignin, chitin, and various polysaccharides are included in this group. These materials and their derivatives offer a wide range of properties and applications. Natural polymers tend to be readily biodegradable, although the rate of degradation is generally inversely proportional to the extent of chemical modification. [24]
Pectin
Pectin is a branched anionic polysaccharide, which consist of methylated ester of polygalacturonic acid having segments with rhamnose residues between, some of which may be linked to short neutral sugar chains. They are structural components of plant cell walls and also act as intercellular cementing substances. Pectin is a secondary product of fruit juice, sunflower oil and sugar manufacture. Fruits rich in pectin include peach, apple, citrus fruits, currant and plum. [25]
Figure 18 – Pectin chemical structure.
Image adapted from (http://www.cybercolloids.net/information/technical-articles/introduction-pectin-structure).
They can be used for eco-friendly packaging as it is available in large amounts, in the form of agricultural wastes. [24]
The main drawback of pectin packaging is its water permeability, which limits its use in food packaging applications. However, pectin can be combined with other biodegradable materials to modify its properties. [25]
Whey
Whey is a by-product of cheese manufacturing that contains approximately 7% dry matter. Whey protein can be separated and purified from the liquid whey in an efficient membrane filtration process and subsequent spray drying to obtain either Whey Protein Concentrate (WPC, average protein concentration 65-80 % in dry matter), or Whey Protein Isolate (WPI, highly pure grade with concentrations over 90% in dry matter). In general these whey proteins are used as additives in the agro-food industry, such as the athletic drinks. Nevertheless, whey is in abundant supply, approx. 40% of the 50 million tonnes of whey produced annually in Europe is still unprocessed, which makes it an interesting resource in view of its excellent oxygen barrier properties. [26]
Whey protein can be used in the packaging field, especially for its use as a coating on paper, but also on plastic substrates. Indeed, whey coatings on polypropylene, polyvinylchloride and low density polyethylene demonstrated excellent visual properties, such as excellent gloss and high transparency, as well as good mechanical properties. However, the incorporation of plasticizing agents (e.g glycerol and sorbitol) was generally reported as necessary to overcome the intrinsic brittleness of whey protein coatings. However, use of plasticizers has the disadvantage of lowering barrier properties. [26]
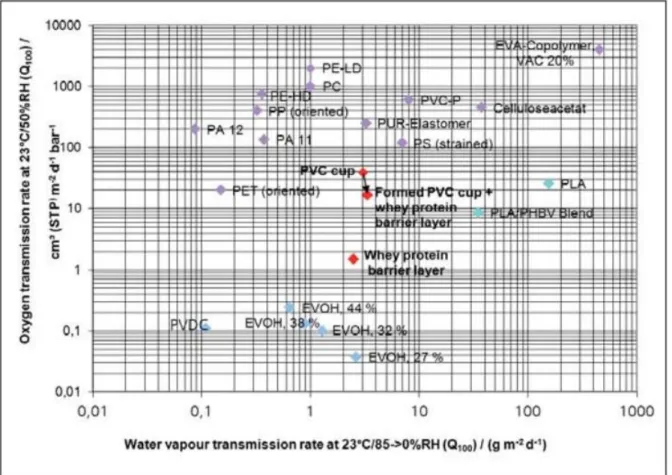
Figure 19 – Comparison of water vapor and oxygen transmission rate of conventional plastics and biopolymers at a thickness of 100 µm.
Image adapted from [27].
Figure 19 shows the barrier properties of conventional plastics and biopolymers. A whey protein film on PVC increases the oxygen barrier by a factor of 2.6. [27]
Whey proteins can be hydrolyzed by different enzymes, such as protease, in specific conditions. This makes multilayer films recyclable, since the separation of the layers made up of
conventional petroleum-based plastics and associated by the whey-based layer is facilitated, enabling them to be handled separately. [27]
3 Technical Description and Results Discussion
3.1 Experimental Work
3.1.1 Bottle Coating
First, take the initial weight of the bottle without coating, secondly, coat the bottle by dipping it until the neck and finally let the PET bottle dry using one of the following methods:
At room temperature until the bottle is touch dry, then place it in the oven at 40ºC for 40 minutes.
At room temperature or in the oven for a designated period of time, it could be a day or five days.
With the help of a hairdryer.
When the bottle is perfectly dry, measure the weight of the bottle once more. If the bottle only requires one layer, the process is finished, however, if there’s the need of more than one layer, keep applying layers of coating following the method described.
Figure 20 – Bottles and preforms drying after being coated.
3.1.2 Gas Barrier Test
The gas barrier test is used to measure the concentration of oxygen in the bottles.
A sensor spot is placed on the cap and a fiber optical probe is positioned on the outside enabling a non-invasive measurement. The measurement is passive, it does not interfere with contents of the package and does not consume oxygen.
The principle of measurement is based on the effect of dynamic luminescence quenching by molecular oxygen.
Collision between luminophore in its excited state and quencher (oxygen) results in radiationless deactivation and is called collisional or dynamic quenching. During collision, energy transfer takes place from the excited indicator molecule to oxygen which consequently is transferred from its ground state (triplet state) to its excited singlet state. As a result, the
indicator molecule does not show luminescence and the total measurable luminescence signal decreases.
Therefore, a relation exists between oxygen concentration in the sample and luminescence intensity as well as luminescence life-time which is expressed by the following Stern-Volmer-equation:
𝜏0
𝜏 = 1 + 𝐾𝑆𝑉. [𝑂2] (5)
Where 𝜏 represents the luminescence decay time in presence of oxygen, 𝜏0 the luminescence decay time in absence of oxygen, KSV is the Stern-Volmer constant (quantifies quenching
efficiency and therefore sensitivity of the sensor) and [O2] is the Oxygen content.
The oxygen-meter uses a blue-green light source for excitation, modulated with a frequency of 4.5 kHz to illuminate the sensor. An optical polymer fiber is used as signal transducer and leads the emission light to a photodiode. [28]
Gas barrier test for empty bottles
Take a previously coated bottle and place it, along with the special cap, in a polyethylene bag and flush it with nitrogen, letting the bag inflate and deflate a couple of times, in order to pull the oxygen out of the bottle. While still in the bag, put the cap on the bottle.
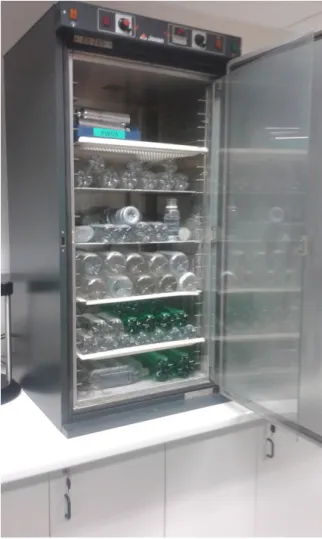
The bottle should then be placed in an oven at 30ºC and twice a week, using the sensor, the variation of O2 should be measured.
Figure 21 – Oven where the bottles are placed to be measured twice a week.
Gas barrier test for filled bottles
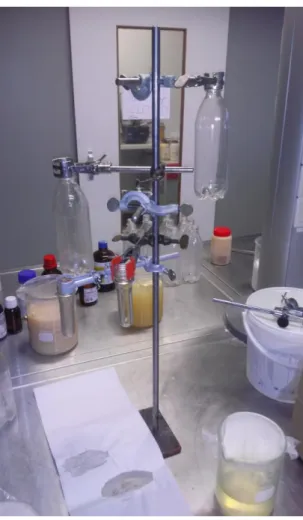
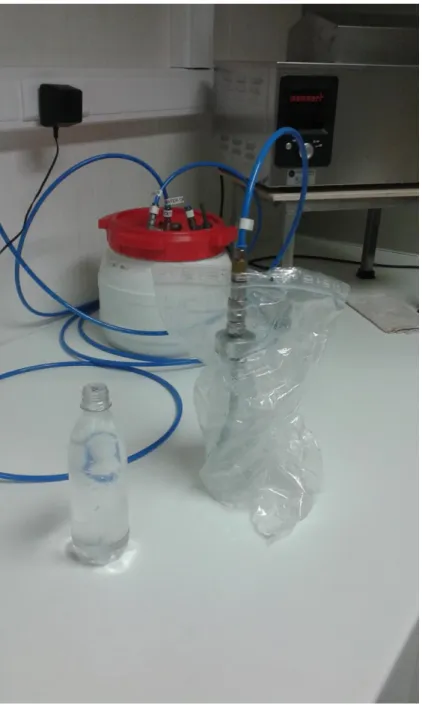
Take a previously coated bottle and fill it with demineralized water and flush it with nitrogen for about 10 minutes to take out the oxygen from the water. Slowly remove the flushing equipment from the bottle and quickly put the special cap on it.
Figure 22 – Bottles being flushed with nitrogen.
Water Vapor Test
This method is used to measure the loss of water in a coated bottle.
Fill completely with water a previously coated bottle, close it tightly and measure the weight. Place the bottle in a ventilated oven at 40ºC and keep measuring the weight twice a week to evaluate the water loss.
Aluminum Scales
As previously explained, the measurement of the bottles is a process that needs to be followed for at least a couple of weeks, so, if there’s a need for more immediate results, it’s not the best solution.
So, to make this process quicker, instead of coating bottles, a thin layer of coating is applied to an aluminum scale, and put in the oven overnight to dry. When the polymer is completely dry, it’s possible to peel it off the aluminum.
Now, this thin film, is placed in a testing bloc, that consists of two blocs. The top one, with oxygen pressurized at 2 bar, and the bottom one with nitrogen at atmospheric pressure. The testing bloc has an incorporated sensor, which will measure the percentage of oxygen.
3.2 Results and Discussion
3.2.1 Gas Barrier Test
The recorded variation of oxygen was plotted against time in days, whereupon a linear regression was applied to the data points. To analyze the effects that each coating has on the barrier properties, the slope of the linear regression was compared to the reference bottles. This analysis, however, only holds meaning if the slope of the reference is higher than the slope of the coated bottles, meaning that the coated bottle is better than the uncoated ones. In the beginning of this test, three uncoated bottles were placed in the oven and measured twice a week to be used as a reference. Two months later, the same procedure was used for three more bottles, to be sure that the values measured during that period were similar for all the six bottles and if it was correct to use them as a reference. Since the values all fall in the same value range, the first three bottles were verified as reference bottles, and were all combined into one slope, to make the analysis easier.
Below, in figure 24, the evolution of the oxygen increase for bottles coated with 3 layers of PVOH6, with a first and last layer of VAC is represented. These bottles were coated by a previous student but were not measured until this date.
The layers of VAC hold a big importance. The first layer, demonstrated in previous experiments made by other students, increases the adhesion of the PVOH6 to the bottle, and the last layer, protects the PVOH6 from outside moisture.
Figure 24 – Oxygen barrier test results for empty bottles with 3 layers of PVOH6.
Table 3 shows the slope value for each bottle.
Table 3 – Calculated slopes for the PVOH6 coating analyzed in the oxygen barrier test.
Bottle Slope(%as/day)
Reference 0,0097
PVOH6(x3) 1 0,0034
PVOH6(x3) 2 0,0005
PVOH6(x3) 3 0,0004
Analyzing Figure 24 and the information provided in the Table 3, it’s easily deducted that the PVOH6, when compared to the reference bottles, leads to much lower values. In fact, if we take the first bottle as an anomaly, the other two bottles give rates 20 times lower than the reference. 0,000 0,100 0,200 0,300 0,400 0,500 0,600 0,700 0,800 0,900 0,000 20,000 40,000 60,000 80,000 100,000 Ox yge n Incre as e (%O 2 ) Time (days) PVOH6(x3) 1 PVOH6(x3) 2 PVOH6(x3) 3 Reference Average
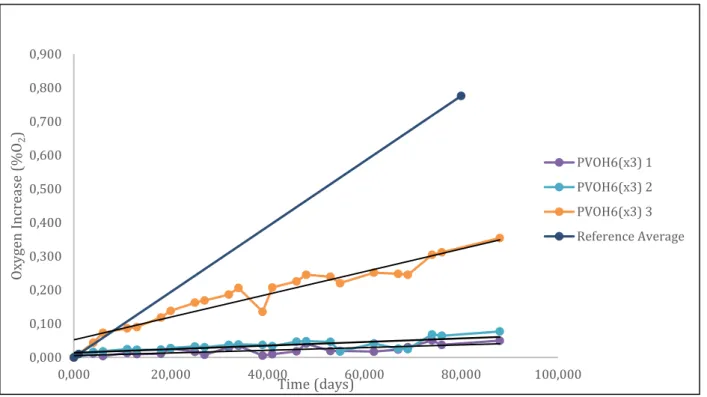
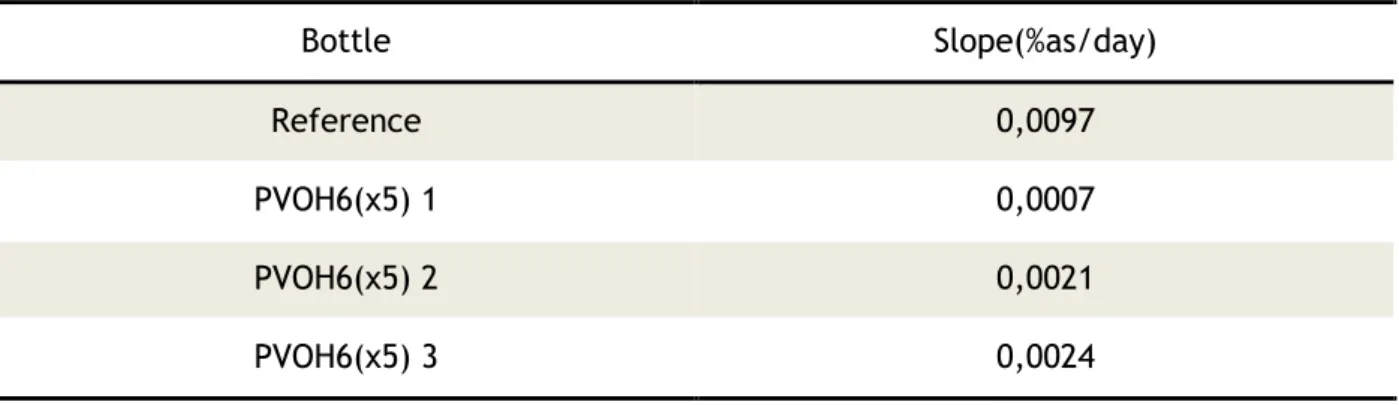
Three other bottles were coated with PVOH6 but this time five layers were applied, and the result of the measurement is presented at Figure 25.
Figure 25 - Oxygen barrier test results for empty bottles with 5 layers of PVOH6.
In the Table 4, the correspondent slopes are represented.
Table 4 - Calculated slopes for the PVOH6 coating analyzed in the oxygen barrier test.
Bottle Slope(%as/day)
Reference 0,0097
PVOH6(x5) 1 0,0007
PVOH6(x5) 2 0,0021
PVOH6(x5) 3 0,0024
Once again, the results given by the PVOH6 bottles, are better than the reference. This time, if we consider the first bottle as an anomaly, since the other two bottles display similar results, the oxygen increase is 4 times lower.
0,000 0,100 0,200 0,300 0,400 0,500 0,600 0,700 0,800 0,900 0,000 20,000 40,000 60,000 80,000 100,000 Ox yge n Incre as e (%O 2 ) Time (days) PVOH6(x5) 1 PVOH6(x5) 2 PVOH6(x5) 3 Reference Average
The results of the bottles with more layers, in theory, should be better, however, in the case of PVOH, multilayering has the opposite effect. As the layers increase, the reaction between them and the water that stays in the middle of each layer, tears holes in the coating walls, thus the oxygen barrier values decrease.
The results given by the bottles coated with PVOH6 are, without a doubt, exceptional. However the PVOH6, and in fact all the PVOH, have a serious limitation. PVOH is highly reactive, and in a multilayer system, as the number of layers increase, the appearance of the bottle decreases. The coating starts to show a strange pattern similar to a spider web. This effect is magnified when the final layer of VAC is applied.
Other bottles were coated with different types of PVOH, PVOH4, PVOH5 and PVOH7, however the results were not satisfactory, since the slopes were higher than the slopes of the average bottles, which makes these coatings worse than the reference. These results can be found in the appendix.
Bottles coated with only one layer of PEC don’t show any significant improvement in the oxygen barrier properties (see Appendix), however, the same can’t be said for bottles with three layers. Multilayer, has a clear effect in bottles coated with Pectin.
Different drying methods were used for PEC. Drying the bottles with the hairdryer and leaving the bottles to dry at room temperature, between each layer, showed to be the best ones. The outcome of the other two methods, standard method and five days in the oven, can be seen in Appendix.
In Figure 26, the results for the oxygen barrier are presented for PEC that was dried using the hairdryer.
Figure 26 - Oxygen barrier test results for empty bottles with 3 layers of Pectin, dried with a hairdryer.
In Table 5 the slopes computed are shown.
Table 5 - Calculated slopes for the Pectin coating analyzed in the oxygen barrier test.
Bottle Slope(%as/day)
Reference 0,0097
PEC(x3) HD1 0,0016
PEC(x3) HD2 0,0011
PEC(x3) HD3 0,0006
Analyzing the table above and figure 26, it can be seen that the oxygen rate for the bottles with Pectin, is much lower than the reference. Once again, if we take out the bottle that falls out of range, PEC gives rates about 6 to 8 times lower than the uncoated bottles.
0,000 0,100 0,200 0,300 0,400 0,500 0,600 0,700 0,000 20,000 40,000 60,000 80,000 Ox yge n Incre as e (%O 2 ) Time (days) PEC(x3) HD1 PEC(x3) HD2 PEC(x3) HD3 Average Reference
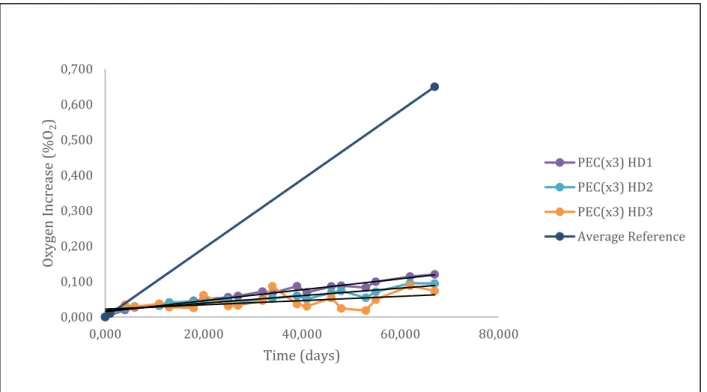
On Figure 27, bottles coated with PEC are shown again, but this time they were left at room temperature for 5 days to dry, between each layer.
Figure 27 - Oxygen barrier test results for empty bottles with 3 layers of Pectin, dried with at room temperature.
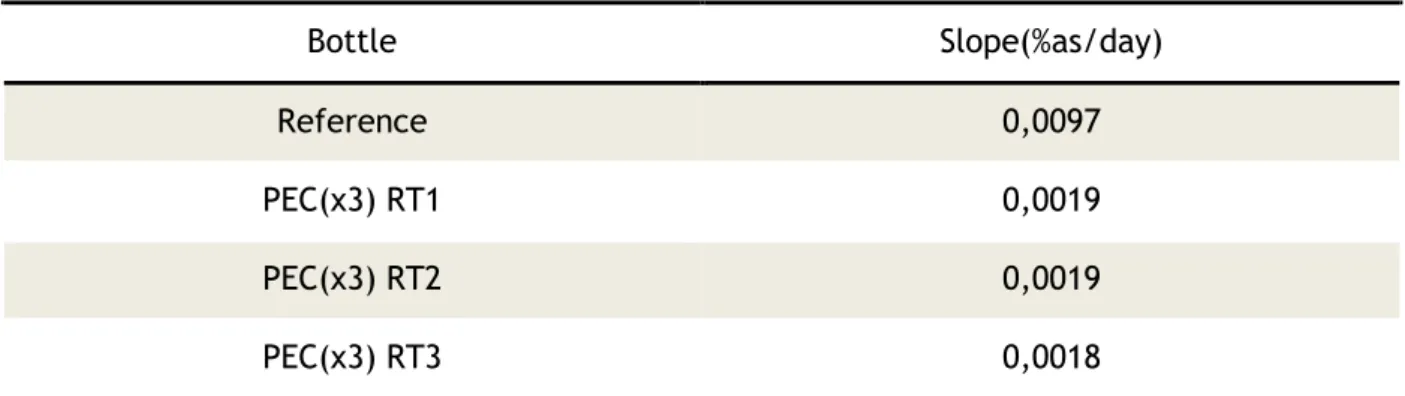
Table 6, presents the slopes calculated for each bottle.
Table 6 - Calculated slopes for the Pectin coating analyzed in the oxygen barrier test.
Bottle Slope(%as/day)
Reference 0,0097
PEC(x3) RT1 0,0019
PEC(x3) RT2 0,0019
PEC(x3) RT3 0,0018
In Figure 27 and Table 6, it’s possible to deduct that PEC leads to a five times lower rate of oxygen concentration increase when compared to the reference bottle.
0,000 0,100 0,200 0,300 0,400 0,500 0,600 0,700 0,000 10,000 20,000 30,000 40,000 50,000 60,000 70,000 80,000 O xyge n In cr ea se (%O 2 ) Time (days) PEC(x3) RT1 PEC(x3) RT2 PEC(x3) RT3 Average Reference
Pectin results are promising without any doubt, however, it has limitations.
Multilayering plays an important factor. One layer, does not improve the barrier properties, and three layers, in an industrial scale is not viable. Pectin is also very viscous increasing the drying times considerably between each layer.
During this project, other coatings were used, but the results, were not good. EVOH, Whey and a mixture of VAC and PEC, all gave results very similar to the reference or worse (see Appendix A).
3.2.2 Water vapor test
As previously described, both PVOH and EVOH have bad water barriers, mainly due to the hydroxyl groups, which was confirmed by tests done by previous students (see Appendix B). PVDC, however, has a good moisture barrier, so, for this test, bottles were coated with PVDC and filled with water to evaluate if there was any improvement in the water barrier.
The bottles were measured for a couple of months, and the weight evolution can be seen in the following table.
Table 7 – Evolution of the weight overtime for both the reference bottles and the bottles coated with PVDC.
Coating Reference 1 Reference 2 PVDC 1 PVDC 2
Initial Weight (g) 27,69 27,58 28,68 28,75 Total Weight (g) 531,21 530,61 531,55 531,56 2 days (g) 531,03 530,44 531,50 531,50 6 days (g) 530,62 530,03 531,38 531,34 14 days (g) 529,72 529,27 531,07 530,99 42 days (g) 526,97 526,55 530,07 529,81 56 days (g) 525,40 524,95 529,40 529,10 84 days (g) 522,88 522,41 528,35 527,88
112 days (g) 518,74 518,19 526,62 525,87
140 days (g) 515,74 515,15 525,31 524,45
168 days (g) 512,66 512,04 523,93 522,86
The results are presented in ppm and the concentration decrease in based on the following equation:
(𝑚 − 𝑚𝑡)
𝑚𝑤
× 106 (5)
Where m is the total mass of the bottle, weight of the bottle plus water and cap, mt is the mass
of the bottle over time and mw is the initial mass of water.
Finally, in figure 28, we can see the evolution of the water vapor transmission of PVDC in comparison with the uncoated bottles.
Figure 28 – Water vapor barrier test results for bottles coated with PVDC.
-5000 0 5000 10000 15000 20000 25000 30000 35000 40000 0 50 100 150 200 C on ce n tr ation de cr ea se ( pp m) Time (days) Reference 1 Reference 2 PVDC 1 PVDC 2
Table 8 – Calculated slopes for the coatings analyzes in the water vapor test. Slope (ppm/day) Reference 1 221,70 Reference 2 222,85 PVDC 1 91,478 PVDC 2 104,27
Analyzing the table and figure above, it’s clearly that PVDC shows a significant improvement, around 2 times better than the reference
PVDC on its own has a good water barrier, as previously explained, however, it doesn’t have a good adhesion to PET. So adding VAC as a primer, allows a bigger amount of PVDC coating to remain in the bottle, improving the moisture barrier properties.
3.2.3 Aluminum Scales
For this test, PEC and PVOH6 were mixed with a combination of different wetting agents, in order to improve the good results already obtained, and to upgrade the global looks of the final bottles, which at this point is one of the most important parameters.
From all the different combinations developed, it was clearly that there was no evident effect in the Pectin. As for the PVOH6, the mixtures that showed an improvement in the appearance and also had a good adhesion to the aluminum scale, were the wetting agent A and the wetting agent B. The results for these bottles can be found in figure 29.
Figure 29 – Evolution of the oxygen increase.
Analyzing the results, it’s clear that the results of the wetting agent A don’t show any improvement, in comparison to the reference PET.
The wetting agent B on the other hand, when compared to PET displayed a large improvement. As it’s perceptible by looking at figure 29, the values obtained are very similar to the ones obtained for Nylon reference.
Preforms testing
Since the results obtained on bottles, for Pectin and PVOH6 were so promising, the next step was to apply the same coating on the preforms and blow them into bottles.
Throughout the duration of this project, lots of preforms were coated, however, the final appearance of the bottles were far from being acceptable.
The exception, were the preforms coated with PVOH6 but without the final layer of VAC. These bottles were then filled with water to be tested for the oxygen barrier. However, as previously explained, PVOH6 has a bad water barrier, and as soon as there’s contact between the coating and the water, the layer starts to come off, so, there was the necessity to coat the bottles with a layer of VAC.
0 0,1 0,2 0,3 0,4 0,5 0,6 0,7 0 5 10 15 20 Ox yge n in cr ea se ( %O 2 ) Time (days) Wetting agent A Wetting agent B MXD6 PVOH4 PET
The results were not satisfactory, and a possible explanation, could be that, since the PVOH6 is so reactive, the layer of VAC made some tears in the coating. The results can be found in the Appendix.
4 Conclusions and future work
During this project various coatings were tested with the clear objective to increase the barrier properties of PET. To analyze this effects, different methods were used.
Regarding the gas barrier test on empty bottles, from all the coatings tested, the PVOH6 and the Pectin showed serious improvements in comparison to the reference. For Pectin it was clear that the increase of layers had a significant effect on the results, as for the PVOH6, the increase of layers has a contrary effect.
However, even though the results were good, there are still some problems that need to be addressed in the near future. Applying 5 and even 3 layers, excluding the primary and the final layer, is simply not feasible in an industrial scale. The time and material consumed for just one bottle is not economically viable. So a solution in this department must be found. The other big problem presented, and this is more related to the PVOH, is the final looks of the bottle. There’s no market for a bottle that, in spite of having great barrier properties, doesn’t display a pristine look. Finding an alternative to VAC as a final layer or mix the solution of PVOH with a wetting agent so that the reactions between layers are not so prominent is the way to go. The good results displayed by the PVOH6, for the oxygen barrier, were confirmed later by the use of the aluminum scales. The improvement, when compared to the PET reference is very significant, and the values obtained are similar to ones given by Nylon.
Since the results obtained for PVOH6 and Pectin were promising, the next step was to apply the same coatings to a preform and blow them into bottles, to be analyzed. Throughout this project, various preforms were coated and blown into bottles, however, the appearance of the coatings on the bottles, were far from being optimal, and they were put aside. The exception was made to the preforms coated with PVOH6 but without a final layer of VAC, since, after being blown, the looks were the final bottle were very interesting.
These bottles were tested for the oxygen barrier, but this time, they were filled with water. The results, however, were far from being good. As explained previously, the PVOH6 is highly reactive, and since the last layer of VAC was applied only after the bottles were blown, there’s the possibility of tears in the coating, which would explain the bad results.
For the water vapor test, the best results were given by PVDC. The results were better than the reference, however they were far from being outstanding. In the future, these results have to be improved, and a way must be found, to approximate these values, to the ones obtained with polypropylene, which is 16 times better than the reference.
References
[1] - Wikipedia - (http://en.wikipedia.org/wiki/Polyethylene_terephthalate, accessed on November 17th).
[2] - DMT And Terephthalic Acid, Polyester, PET Resin, PBT Resin – Lecture 6 – (http://nptel.ac.in/courses/103107082/module8/lecture6/lecture6.pdf, accessed on November 17th).
[3] – PETRA: An introduction to PET – (http://www.petresin.org/news_introtoPET.asp, accessed on September 28th).
[4] – IFT: Rules of food packaging and Environmental Issues – (http://www.ift.org/knowledge-
center/read-ift-publications/science-reports/scientific-status-summaries/food-packaging.aspx, accessed on November 14th).
[5] – NAPCOR PET Basics.
[6] – State of Qatar PET production study.
[7] – NSF – Packaging hygiene for bottled water and beverage consumption -
(http://www.foodsafetydubai.com/resources/contentfiles/Prev-Conference/Talk_2_Dagmar_Engel_MacDonald_Skript.pdf, accessed on December 7th).
[8] – Conoplat: Molding – (http://www.conaplat.com.ar/pet/what_is_blow_moulding.htm, accessed on December 28th).
[9] – Valorlux – (http://valorlux.lu/en/plastics, accessed on October 25th).
[10] – GOVI – (http://www.govi.com/en, accessed on January 12th).
[11] – Siracusa V. “Food Packaging Permeability Behaviour: A Report”, International Journal of Polymer Science, 2012, Article ID 302029, 11 pages, 2012.
[12] – Dhoot S. N. “Sorption and Transport of Gases and Organic Vapors in Poly(Ethylene therephtalate)”, PhD Thesis, 5-45, University of Texas, Austin, Texas, 2004.
[13] – Khumar P. “Effect of Package ConFiguretion on Barrier Properties and Sensory Perception of Flavor”, Master Thesis, Michigan State University, East Lansing, Michigan, 2007.
[14] – Herman F. M. “Encyclopedia of Polymer Science and Technology”, 3rd edition, John Wiley
and Sons, 2007.
[15] – Deilmann M., Halfmann H., Awakowicz P. “Silicon Oxyde Permeation Barrier Coating and Plasma Sterilization of PET Bottles and Foils”, Bochum University, 2006.
[16] – Stewart M., Dhoot S. N., Freeman B. “Encyclopedia of Polymer Science and Technology”, John Wiley and Sons, 2002.
[17] – Finnigan B. “Barrier Polymers”, The Wiley Encyclopedia of Packaging Technology” [18] – Disadvantages of Synthetic Fibers – (http://www.edurite.com/kbase/disadvantages-of-synthetic-fibers, accessed on December 17th).
[19] – Wikipedia – (http://en.wikipedia.org/wiki/Polyvinyl_alcohol, accessed on December 17th).
[20] – Polyvinyl Alcohol (PVA): Chemical and Technical Assessment – First draft prepared by S. K. Saxena, FAO, 2004.
[21] – Mokwena K. K., Tang J. “Ethylene Vinyl Alcohol: a Review of Barrier Properties for Packaging Shelf Stable Foods”, Food Science and Nutrition, 2012.
[22] – Giles G. A., Bain R. D., “Materials and Development of Plastics Packaging for the Consumer Market”, Sheffield Academy Press Ltd, 2000.
[23] – University of Alabama – (http://www.technologyed.org/alabama/natural-polymers/, accessed on January 10th).
[24] – Malviya R., Srivastava P. “Sources of Pectin, Extraction and its Explanations in Pharmaceutical Industry – An Overview”, Indian Journal of Natural Products and Resources, 2011.
[25] – Alavi S., Thomas S., Sandeep K. P., Kalarikkal N., Varghese J., Yaragalla S. “Polymers for Packaging Applications”, Taylor and Francis Group, 2015.
[26] – Schmid M., Bugnicourt E., Wild F., Cinelli P., Lazzeri A., Noller K. “Properties of Whey-Protein-Coated Films and Laminates as Novel Sustainable Food Packaging Materials with Excellent Barrier Properties”.
[27] – Schmid M. “Whey Protein Based Barrier Coatings”
[28] – Huber Ch., Nguyen T.A., Krause Ch., Humele H., Stangelmeyer A. “Oxygen Ingress Measurements into PET Bottles using Optical-Chemical Sensor Technology”
Appendix: Gas Barrier Results
In this section, all the results for the oxygen barrier test that were not presented in section 3.2.2 are shown.
Figure 30 - Oxygen barrier test results for bottles with one layer of whey type B.
-0,050 0,000 0,050 0,100 0,150 0,200 0,250 0,300 0,000 5,000 10,000 15,000 20,000 25,000 Ox yge n in cr ea se ( %O 2 ) Time (days) Whey B1 Whey B2 Whey B3 Reference Average
Figure 31 - Oxygen barrier test results for bottles with one layer of whey type A.
Figure 32 - Oxygen barrier test results for bottles with one layer of EVOH1.
0,000 0,050 0,100 0,150 0,200 0,250 0,300 0,000 5,000 10,000 15,000 20,000 25,000 Ox yge n in cr ea se ( %O 2 ) Time (days) Whey A1 Whey A2 Whey A3 Reference Average 0,000 0,050 0,100 0,150 0,200 0,250 0,300 0,350 0,00 2,00 4,00 6,00 8,00 10,00 12,00 14,00 16,00 Ox yge n in cr ea se ( %O 2 ) Time (days) EVOH1(x1) 1 EVOH1(x1) 2 EVOH1(x1) 3 Reference Average
Figure 33 - Oxygen barrier test results for bottles with three layers of EVOH1.
Figure 34- Oxygen barrier test results for bottles with one layer of EVOH2.
0,000 0,050 0,100 0,150 0,200 0,250 0 2 4 6 8 10 12 14 16 Ox yge n in cr ea se ( %O 2 ) Time (days) EVOH1(x3) 1 EVOH1(x3) 2 EVOH1(x3) 3 Average Reference 0,000 0,050 0,100 0,150 0,200 0,250 0,300 0,350 0,400 0,000 5,000 10,000 15,000 20,000 25,000 30,000 35,000 Ox yge n in cr ea se ( %O 2 ) Time (days) EVOH2(x1) 1 EVOH2(x1) 2 Average Reference
Figure 35 - Oxygen barrier test results for bottles with three layer of EVOH2. 0,000 0,020 0,040 0,060 0,080 0,100 0,120 0,000 2,000 4,000 6,000 8,000 10,000 12,000 Ox yge n in cr ea se ( %O 2 ) Time (days) EVOH2(x3) 1 EVOH2(x3) 2 EVOH2(x3) 3 Average Reference 0,000 0,020 0,040 0,060 0,080 0,100 0,120 0,000 2,000 4,000 6,000 8,000 10,000 12,000 Ox yge n in cr ea se ( %O 2 ) Time (days) PEC(x1) 1 PEC(x1) 2 PEC(x1) 3 Reference Average
Figure 36 - Oxygen barrier test results for bottles with one layer of Pectin.
Figure 37 - Oxygen barrier test results for bottles with three layer of Pectin using the standard method. -0,010 0,040 0,090 0,140 0,190 0,240 0,290 0 5 10 15 20 25 30 Oxyge n in cr ea se ( % O2 ) Time (days) PEC(x3) SM1 PEC(x3) SM2 PEC(x3) SM3 Average Reference
Figure 38 - Oxygen barrier test results for bottles with three layer of Pectin dried in the oven.
Figure 39- Oxygen barrier test results for bottles with a mixture of PEC and VAC.
0,000 0,050 0,100 0,150 0,200 0,250 0,300 0 5 10 15 20 25 30 Ox yge n in cr ea se ( %O 2 ) Time (days) PEC(x3) O1 PEC(x3) O2 PEC(x3) O3 Average Reference 0,000 0,020 0,040 0,060 0,080 0,100 0,120 0,140 0,160 0,180 0,000 2,000 4,000 6,000 8,000 10,000 12,000 14,000 16,000 Ox yge n in cr ea se ( %O 2 ) Time (days) PEC+VAC 1 PEC+VAC 2 PEC+VAC 3 Average Reference