A
rti
g
o
*e-mail: [email protected]
MANUFACTURE OF NANOSIZED APATITE COATINGS ON TITANIUM WITH DIFFERENT SURFACE TREATMENTS USING A SUPERSATURATED CALCIFICATION SOLUTION
Adrian Paz Ramosa, Gabriel O. Ybarrab, Leonardo M. Pazosb, María B. Parodib, Laura Rodríguezb, Mónica López
Hernándezc and Jesús E. González Ruízd,*
aDepartment of Chemistry, Université de Montréal, Succursale Centre-Ville, Montréal – Québec, Canada bNational Institute of Industrial Technology, General Paz Avenue 5445, San Martin – Buenos Aires, Argentina cNational Center for Scientiic Research, 25 Avenue and 158st, 11300 – Havana, Cuba.
dDepartment of Ceramic and Metallic Materials, Biomaterials Center, Universidad Avenue and G, 10400 – Havana, Cuba.
Recebido em 16/02/2016, aceito em 24/06/2016, publicado na web em 30/08/2016
The biomimetic method is used for the deposition of calcium phosphate coatings (Ca – P) on the surface of different biomaterials. However, the application of this method requires long exposure times in order to obtain a suitable layer thickness for its use in medical devices. In this paper, we present a fast approach to obtain apatite coatings on titanium, using a combination of supersaturated calciication solution (SCS) with chemical modiication of the titanium surface. Also, it was evaluated the effect of four different surface treatments on the apatite deposition rate. Commercially pure titanium plates were activated by chemical or thermochemical treatments. Then, the activated samples were immersed in a solution with high content of calcium and phosphate ions at 37 °C for 24 h, mimicking the physiological conditions. The coatings were studied by Fourier transform infrared spectroscopy (FTIR), X-ray diffraction (XRD), scanning electron microscopy (SEM) and energy dispersive X-ray spectroscopy (EDX). The use of SCS solutions allowed the formation of crystalline hydroxyapatite coatings within a period of 24 h with a thickness between 1 and 5.3 μm. Besides, precipitates of hydroxyapatite nanoparticles with a globular coniguration, forming aggregates with submicrometer size, were found in SCS solutions.
Keywords: Coatings, thin ilms, biomaterials, ceramics.
INTRODUCTION
Titanium and its alloys are among the most widely used metallic materials in the manufacture of implants due to its excellent mecha-nical properties, low speciic weight, high corrosion resistance and excellent biocompatibility.1-6 However, its osseointegration is slow,6 affecting the life quality of patients. Several works have shown that changes in the topography, surface energy and phase composition on the titanium surface can signiicantly inluence its rate of osseoin-tegration.7-11 The biomimetic method has been widely used in the past decades because it is possible to obtain coatings with a phase composition analogous to the inorganic component of the bone.12 In addition, this technique does not require special facilities and high temperatures for its implementation, it enables the treatment of porous surfaces and also the possibility to incorporate bioactive agents and proteins.13-15 Unfortunately, the length of the processes has limited the extension of this method to the treatment of dental implants and prostheses made of titanium and its alloys.16
The behavior of calcium phosphate coatings in vivo depends largely on its crystallinity, elemental and phase composition.17,18 The biomimetic method allows to modify those parameters from the ionic composition of the solution, the ion content of the pre-cursor employed and their relationship. Several works described the formation of apatite coatings, which are completely or partially constituted by octacalcium phosphate (OCP), dicalcium phosphate (DCP), hydroxyapatite (HA), hydroxycarbonate apatite (HCA) or carbonated apatite (CA).19-24 Also, calcium phosphate coatings with different degree of crystallinity were reported.25
Among the alternatives to shorten the exposure time are the use of solutions with high content of calcium and phosphate ions
and the incorporation of magnesium salts into these solutions.19,26-28 Furthermore, it has been shown that the surface roughness, chemical composition and phases present in the surfaces can enhance the rate of apatite coating formation. Acid etching and their combination with heat treatments (thermochemical treatments) are used for the surface modiication of titanium, because they modify its elemental and phase composition, but also the topography and wettability.29-31 In addition, this treatment improves the in vitro and in vivo behavior of titanium and its alloys.9,29,32 Within the chemical procedures used to activate the surface of titanium and its alloys are treatments that enhance the formation of oxides or hydroxides,30,31,33 and others which enable the formation of titanates (treatments in sodium hydroxide or calcium-ion solutions).16,34-36
The aim of this study is to determine the effect of four treatments of surface activation applied to the commercially pure titanium on the deposition of apatite coatings in a supersaturated calciication solution.
EXPERIMENTAL
Sample preparation
Twenty plates of commercially pure titanium (Ti – cp) of 15 × 5 × 1 mm in size were polished using silicon carbide (SiC) paper of 120, 240, 400 and 600 grit. After polishing, the samples were cleaned in an ultrasonic bath with distilled water and then activated by four chemical and (or) thermochemical treatments (Table 1).
Ca-P coating formation
supersaturated calciication solution (SCS). The masses of salts and ion concentrations of SCS were equal to those employed by Li et al. (Table 2).21 After the activation treatment, the titanium plates were tied with a cotton thread and immersed vertically into 500 mL of SCS solution at 37 ºC for 24 h, with a stirring rate of 80 rev. min-1. A Ti plate representing each surface treatment was immersed into the solution in each experimental run. After exposure, the samples were carefully washed with distilled water and dried at 60 ºC for 2 h. At the end of the deposition process, the solution was centrifuged and iltered. Finally, the precipitates were collected and dried at 60 oC for 2 h. All experiments have been repeated at least 3 times in order to ensure the data reproducibility.
Characterization
The pH value was measured during the solutions preparation and at the coating process with a Pracitronic MV870 pHmeter. The functional groups of the coatings were determined by Fourier transfor-med infrared (FTIR) spectroscopy on a Nicolet Magna 550 Series II. Besides, the coatings were investigated using a Philips PW1730 X-ray diffractometer (XRD) with a CuKα target. The phase identiication was made using the PCPDFWIN database, v. 2.4 ICDD PDF-2/2003.
The size and morphology of the particles obtained in solution were characterized by transmission electron microscopy (TEM), in a Philips CM10 microscope, using an acceleration voltage of 80 kV. The dimensions of the particles were determined by digital image analysis using the software ImageJ.
The morphology of the coatings was characterized by scanning electron microscopy (SEM) using a Philips SEM 505 microscope for low magniication and a Zeiss microscope FESEM Supra 40 for increases greater than 5000x. In addition, it was identiied their ele-mental composition using an energy dispersive X-ray spectroscopy (EDX) coupled to SEM. The statistical processing of results was performed in Statgraphics software, using a multi-sample compari-son test (Multiple Range Tests) and analysis of variance (ANOVA).
RESULTS AND DISCUSSION
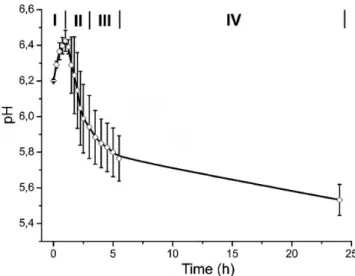
Figure 1 shows the behavior of the average pH value of the
solution, which was characterized by four different stages. In the irst stage (I in Figure 1), it was observed a signiicant increase in pH values up to a maximum at around one hour of exposure (6.44 ± 0.06). Subsequently, it was observed a rapid decrease in pH values of 5.8 ± 0.06, between 1.5 and 3 h (stage II, Figure 1). Then, between 3 and 5.5 h, the values decreased slowly (stage III) and inally the reduction was even slower to reach a value of 5.58 ± 0.09 at 24 h (stage IV). It is important to notice that during stage II, it was observed the formation of precipitates, consisting of tiny white particles on the surface of the samples and in the solutions.
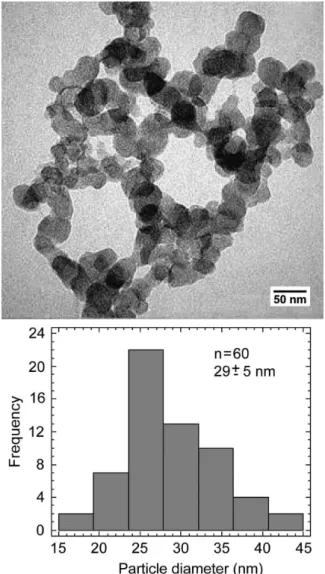
The study by TEM of the particles formed in solution showed a globular coniguration and an average diameter of 29 ± 5 nm (Figure 2). In addition, the nanoparticles formed a cluster with irre-gular shape and size generally less than 1 μm (Figure 2).
FTIR results of the precipitates showed the main groups of hydroxyapatite (Figure 3). At 1040 and 1091 cm-1 was observed the most important band of hydroxyapatite, the antisymmetric vibration of calcium phosphates υ3as (PO43-). At 952 cm-1 was revealed the symmetrical vibration, while at 561 and 606 cm-1 was observed the antisymmetric vibration υ4as (PO43-). Also, at 3400 cm-1 was observed a broad band of water, produced by the absorption of humidity by the samples during the deposition process. In addition, it was observed a band at 635 cm-1, corresponding to the out-of-plane bending (ρ) of the structural OH- group and a signal located at 1643 cm-1, from water adsorption (Figure 3).
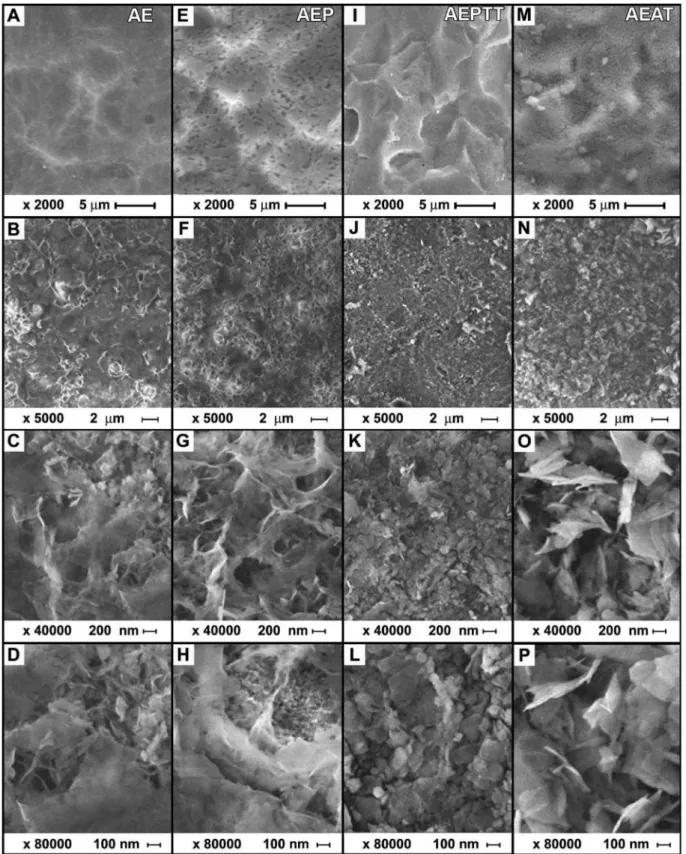
The morphology of the activated titanium surface using the four variants is presented in Figure 4 A, E, I and M. As a result of acid treatment, it was obtained a surface with several micropores, with size between 3 and 15 μm. Subsequent treatments in hydrogen peroxide and (or) thermochemical did not signiicantly affect the topography of the surfaces (Figure 4 E, I). On the samples with alkali treatment (AEAT) were observed not only the pores generated by acid etching (Figure 4 M), but also additional nanopores evenly distributed across the surface (not shown).
The topography of titanium samples after treatment in SCS showed signiicant variations (Figure 4 B, F, J and N). The pores and ridges formed during the activation treatments disappeared in all cases. Higher-magniication micrographs of the samples soaked in SCS showed coatings with dense and microporous zones (Figure 4 C, G, O, D, H and P). An exception of this behavior was observed in the samples under thermochemical treatment (AEPTT), in which a majority of dense coating was formed (Figure 4 K and L). This last co-ating was constituted by nanoparticles with a globular coniguration, Table 1. Treatments used for the surface activation
Treatment Treatment details
Acid etching (AE) Acid etching in HF 2.75 M - HNO3 3.94 M, v/v 1:1 at room temperature for 2 min.
Oxidation 1 (AEP) Acid etching + treatment in H2O2 8.8 M - HCl 0.1 M v/v 1:1 at 80 oC for 30 min.
Oxidation 2 (AEPTT) Acid etching + oxidation 1 + thermochemical treat-ment at 400 oC for 1 h in air.
Oxidation 3 (AEAT) Acid etching + treatment in 10 M NaOH at 80 °C for 24 h.
Table 2. Masses of salts and ion concentration in 500 mL of supersaturated calciication solution (SCS)
Masses of salts (mg) in 500 mL of SCS CaCl2 NaH2PO4 NaHCO3
555 150 63
Ion concentration (mM) Na+ Ca2+ Cl- H
2PO4- HCO3
-4 10 20 2.5 1.5
with a size between 11 and 82 nm and an average diameter of 34 ± 15 nm. In that area, it was observed that the nanoparticles formed some clusters with a maximum length of 245 ± 126 nm. Furthermore, it could be found some plate-like shape particles on the coating with a perpendicular orientation to the surface and a length of 170 ± 84 nm.
The samples activated by AE, AEP and AEAT variants exhibited a combination of dense and microporous zones (Figure 4 C, G, O, D, H and P). Those microporous zones were constituted by several plate--like shape particles, oriented perpendicularly to the surfaces. The length of the particles changed depending on the activation treatment (AE = 133 ± 54 nm, AEP = 358 ± 149 nm and AEAT = 378 ± 197 nm), while the maximum size of the pores was in the submicron scale.
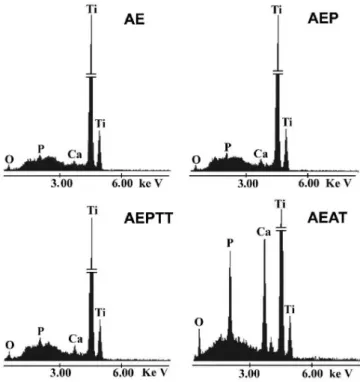
The elemental composition analysis by EDX showed that the coatings are constituted of calcium, phosphorus, oxygen, and also revealed the titanium from the substrate (Figure 5). Additionally, in the samples activated by AEAT variant was observed a greater intensity in the characteristic peaks of calcium and phosphorus compared with the other samples (Figure 5). Besides, the spectra do not reveal the presence of other elements.
The FTIR spectra of the coatings showed the signals correspon-ding to hydroxyapatite (Figure 6). The comparison between the FTIR spectra of coating and precipitates shows that there is no difference on the presence and location of the signals, which indicates that the compositions of both materials are presumably the same.
The XRD patterns corroborate the formation of the apatite coatings. The relection peaks with interplanar distances of 3.46, 2.79, 2.67 and 1.84 Å (2θ = 25.74, 32.11, 33.77 and 49.39o) were assigned to crystalline apatite (Ca10(PO4)6(OH)2) (Figure 7). Also, at the interplanar distances of 2.57, 2.36 and 2.25 Å (2θ = 34.97, 38.20
and 40.03o) the titanium substrate was revealed.
Cross-section micrographs of the deposits corroborate that all samples were uniformly coated and that the layer thicknesses were between 1 and 5.3 μm (Figure 8). The greater coating thicknesses were obtained using both the AEPTT and AEAT treatments. In addition, it was observed that the greatest thicknesses are generally found in the porous areas, generated during the acid treatment (Figure 8).
The pH curves of the SCS solution have four well differentiated stages (Figure 1). The pH increase in the irst stage is related to the reaction of H+ ions with HCO
3- (generated by the dissociation of NaHCO3), according to equation 1.21 During this period, it must be generated some apatite nuclei, which enhances the ilm growth according to the mechanism described by Barrere et al.19 In the limit of stages 1 and 2, after reaching the maximum pH value, there is a sharp inlection in the curve (Figure 1). This phenomenon is caused by the combination of high ionic strength with a high pH value, which promotes the supersaturation of the solution. This causes a strong reaction between Ca2+ ions and OH- (equation 2) and the apatite precipitation in the solution and on the activated titanium surface. A similar behavior is reported when using solutions with an ionic con-centration ive times superior to the simulated body luid (SBF x 5).19,25 In addition, the rapid consumption of OH- during stage 2 causes the rapid drop of pH values (Figure 1). At this stage Habibovic reported a signiicant increase in thickness of the calcium phosphate layer.20
H+ + HCO
3-→ CO2 + H2O (1)
10 Ca2+ + 6 PO
43- + 2 OH-→ Ca10(PO4)6(OH)2 (2) The inlection of the pH curve may be explained by the precipita-tion of HA, according to equaprecipita-tion (2). Due to the decreased amount of OH- ions in the solution, a pH drop was observed. The tendency observed in stages 3 and 4 can be related to the ilm growth. In those stages the pH values decrease becomes slower until the end of the process. This behavior should be linked to the slow consumption of Ca2+ and PO
43- ions in the solution as a result of the coating process and the formation of particles in the solution during the previous stages. The approach employed allows the formation of hydroxyapatite nanoparticles in the solution and on the titanium surface activated
Figure 2. TEM image and particle size distribution of the precipitates formed
in SCS solution
Figure 4. SEM images of the surface modification on titanium (A, E, I, M) and apatite layers obtained on titanium (B, C, D, F, G, H, J, K, L, N, O, P) after soaking in SCS for 24 h
by chemical and thermochemical methods. The morphology of the nanoparticles obtained in the solution (globular) differs from the shape of short rods obtained by Han et al.37 The combination of nanoparticle size (34 ± 15 nm) with the globular shape can result in a high speciic surface area, an issue that promotes their bioreactivity.
The morphology and dimensions of the nanoparticles obtained in solution and on the coatings formed on the surface activated by AEPTT variant were similar. However, the high-magniication
nucleation rate while those with a plate-like shape are formed by a homogeneous nucleation. Both processes probably occurred at the end of precipitation (end of stage 2, Figure 1) as a result of low ionic concentration in the solution.
Micrographs of apatite coatings deposited on the four surfaces studied showed no cracks (Figure 4 A, E, I and M), a common defect reported in coatings formed in solutions with high concentrations of calcium and phosphate ions.19,26,27 The absence of cracks in the coat-ing should have a positive impact on their mechanical performance. FTIR analysis reveals that the coatings obtained on titanium and the nanoparticles formed in solution must be constituted by apatite crystals, a result conirmed by XRD. In addition, EDX tests conirm that the coatings are formed by calcium, phosphorus and oxygen. The presence of the maximum intensity peak at 2 = 25.74o is attributed to a preferential orientation in the c-axis (diffraction plane 002) of
Figure 5.EDX spectra of the surface of the apatite layers obtained on titanium
soaked in SCS for24 h
Figure 6.FTIR spectra of apatite layers obtained on titanium soaked in
SCS for 24 h
Figure 7.XRD patterns of titanium substrate and apatite coating formed on
titanium (AEPTT) after soaking in SCS for 24 h
Figure 8.Cross-section micrographs (SEM) of the coatings obtained on
the crystals and it was previously reported by Li and Muller.21,39 The sharp peaks observed in the XRD pattern conirm that the coatings are formed of HA with a crystalline structure. This result must be related to the low content of NaHCO3 used in the solution.
Obtaining nanostructured crystalline hydroxyapatite should have positive inluence on the stability and mechanical properties of the developed coating in vivo. It is known that the cellular response depends on the chemical composition of the substrate, but also on their solubility, crystallinity and microstructure. Previous studies17,40 have shown an increase in cell amount and mineralized extracellular matrix on crystalline substrates, compared with amorphousCa-P coatings. This fact was related with the cell-surface interaction. In contrast with crystallineCa-Pcoatings, amorphous coatings should be constantly dissolving and re-precipitating, which can decrease the number of cells attached on the surface, and ultimately decrease the bone formation.17The low dissolution rate of crystalline Ca-P coatings might also reduce the risk of implant loosening. Finally, the nanotopography of the obtained coatings should promote the cell response and enhance the osteogenic activity,41 which could positively contribute to the implant success.
CONCLUSIONS
Nanostructured apatite coatings were obtained on titanium plates, activated by four different treatments. The coatings completely cover the treated surfaces in 24 hours. In addition, they were constituted of crystalline hydroxyapatite, showing a combination of dense and high microporosity areas. All layer thicknesses were found between 1 and 5.3 μm, while the greater layer thickness was obtained with the acid etching and subsequent alkali treatment (AEAT). Furthermore, it was observed the formation of hydroxyapatite nanoparticles with a glob-ular coniguration in the solution. The application of the biomimetic method under the above-mentioned conditions allows the formation of a suitable layer of bone-like apatite in a very short time. This fact should extend the use of this method in the coating of implantable devices, with the aim to increase their bioactivity.
ACKNOWLEDGEMENTS
The authors wish to express their thanks to the Chancellery and the Ministry of Science and Technology of the Republic of Argentina for his contribution to this work through projects FOAR 5714 and CU/08/13. They also thank the National Institute of Industrial Technology (Argentina) and the Center of Biomaterials of the Polytechnic University of Valencia (Spain) for their assistance in conducting the tests.
REFERENCES
1. Chen, X.; Li, Y.; Du, J.; Hodgson, P. D.; Acta Biomater. 2009, 5, 1808. 2. Ciobanu, G.; Carja, G.; Ciobanu, O.; Sandu, I.; Sandu, A.; Micron 2009,
40, 143.
3. Fleck, C.; Eiler, D.; Int. J. Fatigue 2010, 32, 929.
4. Kodama, A.; Bauer, S.; Komatsu, A.; Asoh, H.; Ono, S.; Schmuki, P.;
Acta Biomater. 2009, 5, 2322.
5. Kim, W. G.; Choe, H. C.; Thin Solid Films 2011, 519, 7045.
6. Vanzillotta, P. S.; Sader, M. S.; Bastos, I. N.; Soares, G. A.; Dent. Mater.
2006, 22, 275.
7. Lakstein, D.; Kopelovitch, W.; Barkay, Z.; Acta Biomater. 2009, 5, 2258.
8. Junker, R.; Dimakis, A.; Thoneick, M.; Jansen, J. A.; Clin. Oral Im-plants. Res. 2009, 20, 185.
9. He, F. M.; Yang, G. L.; Li, Y. N.; Wang, X. X.; Zhao, S. F.; Int. J. Oral Maxillofac. Surg. 2009,38, 677.
10. Buser, D.; Nydegger, T.; Oxland, T.; Cochran, D. L.; Schenk, R. K.; Hirt, H. P.; Snétivy, D.; Nolte, L. P.; J. Biomed. Mater. Res. 1999, 45, 75. 11. Braceras, I.; De Maeztu, M. A.; Alava, J. I.; Gay-Escoda, C.; Int. J. Oral
Maxillofac. Surg. 2009, 38, 274.
12. Le Guehennec, L.; Goyenvalle, E.; Lopez-Heredia, M.-A.; Weiss, P.; Amouriq, Y.; Layrolle, P.; Clin. Oral Implants Res. 2008, 19, 1103. 13. Yu, X.; Wei, M.; J. Biomater. Nanobiotechnol. 2011, 2, 28.
14. Leonor, I.; Alves, C.; Azevedo, H. S.; Reis, R.; Mater. Sci. Eng., C 2009,
29, 913.
15. Habibovic, P.; Barrère, F.; De Groot, K.; In Learning from Nature How to Design New Implantable Biomaterialsis: From Biomineralization Fundamentals to Biomimetic Materials and Processing Routes; Springer: 2005, p 105.
16. Zheng, C. Y.; Li, S. J.; Tao, X. J.; Hao, Y. L.; Yang, R.; Zhang, L.; Mater. Sci. Eng., C 2007, 27, 824.
17. Dekker, R. J.; de Bruijn, J. D.; Stigter, M.; Barrere, F.; Layrolle, P.; van Blitterswijk, C. A.; Biomaterials 2005, 26, 5231.
18. Nagano, M.; Nakamura, T.; Kokubo, T.; Tanahashi, M.; Ogawa, M.;
Biomaterials 1996, 17, 1771.
19. Barrère, F.; Ph.D. thesis, University of Twente, Netherlands, 2002. 20. Habibovic, P.; Li, J.; van der Valk, C. M.; Meijer, G.; Layrolle, P.; van
Blitterswijk, C. A.; de Groot, K.; Biomaterials 2005, 26, 23.
21. Li, F.; Feng, Q. L.; Cui, F. Z.; Li, H. D.; Schubert, H.; Surf. Coat. Tech-nol. 2002, 154, 88.
22. Mihranyan, A.; Forsgren, J.; Strømme, M.; Engqvist, H.; Langmuir
2009, 25, 1292.
23. Song, W. H.; Jun, Y. K.; Han, Y.; Hong, S. H.; Biomaterials 2004, 25,
3341.
24. Lin, D.-Y.; Wang, X.-x., Colloids Surf. B 2011, 82, 637.
25. Barrere, F.; van Blitterswijk, C. A.; de Groot, K.; Layrolle, P.; Biomateri-als 2002, 23, 2211.
26. Chen, X.; Li, Y.; Hodgson, P. D.; Wen, C.; Mater. Sci. Eng., C 2009, 29, 165.
27. Pasinli, A.; Yuksel, M.; Celik, E.; Sener, S.; Tas, A. C.; Acta Biomater.
2010, 6, 2282.
28. Qu, H.; Wei, M.; J. Biomed. Mater. Res., B 2008, 87, 204.
29. Yoneyama, Y.; Matsuno, T.; Hashimoto, Y.; Satoh, T.; Dent. Mater. 2013, 32, 115.
30. Wang, X. X.; Hayakawa, S.; Tsuru, K.; Osaka, A.; J. Biomed. Mater. Res. 2001, 54, 172.
31. Karthega, M.; Nagarajan, S.; Rajendran, N.; Electrochim. Acta 2010, 55,
2201.
32. Daw, A. E.; Kazi, H. A. A.; Colombo, J. S.; Rowe, W. G.; Williams, D. W.; Waddington, R. J.; Thomas, W.; Moseley, R. J. Biomater. Appl.
2013, 1, 17.
33. Yang, W.; Huang, H.; Thin Solid Films 2010, 518, 7545.
34. Jonasova, L.; Muller, F. A.; Helebrant, A.; Strnad, J.; Greil, P.; Bioma-terials 2004, 25, 1187.
35. Kizuki, T.; Takadama, H.; Matsushita, T.; Nakamura, T.; Kokubo, T.;
Acta Biomater. 2010, 6,2836.
36. Rakngarm, A.; Miyashita, Y.; Mutoh, Y.; J. Mater. Sci.: Mater. Med.
2008, 19, 1953.
37. Han, Y.; Wang, X.; Li, S.; J. Nanopart. Res. 2009, 11, 1235.
38. Lu, X.; Zhao, Z.; Leng, Y.; Mater. Sci. Eng., C 2007, 27, 700. 39. Muller, F. A.; Muller, L.; Caillard, D.; Conforto, E.; J. Cryst. Growth
2007, 304, 464.
40. Chou, L.; Marek, B; Wagner, W.R; Biomaterials 1999, 20, 977.