ISSN: 1809-4430 (on-line) www.engenhariaagricola.org.br
1 Universidade Estadual do Paraná/ UNESPAR, Paranavaí – PR, Brasil.
2 Universidade Estadual de Maringá/ UEM, Maringá – PR, Brasil.
4 Universidade do Estado do Mato Grosso/ UNEMAT, Tangará da Serra – MT, Brasil.
Received in: 5-4-2017 Accepted in: 4-18-2018
Doi: http://dx.doi.org/10.1590/1809-4430-Eng.Agric.v38n4p606-615/2018
APPLICATION EFFECT OF DIFFERENT RATES OF WASTEWATER FROM GELATIN
PRODUCTION IN THE CHEMICAL ATTRIBUTES OF THE SOIL
Caroline Silvano
1, Paulo S. L. Freitas
2, Roberto Rezende
2, Liliane S. Mioto
3*, Rivanildo Dallcort
43*Corresponding author. Universidade Estadual de Maringá/ UEM, Maringá - PR, Brasil. E-mail: liliscabora@hotmail.com
KEYWORDS
fertirrigation,
leaching, sodium, soil
fertility.
ABSTRACT
The gelatin industry wastewater has nutrients in its composition, allowing its use in
agriculture as an alternative to disposal and recycling of this residue. However, high
application rates can cause the accumulation of elements such as sodium in the soil, and
generate negative impacts on the environment. This study aimed to evaluate the effects
of the application of rates up to 600 m
3ha
-1of gelatin industry wastewater in soil columns,
on soil chemical attributes in five depths. The experiment was conducted in a greenhouse,
in PVC tube columns (0.20 m diameter) filled with distroferric Red Nitosol soil, of very
clayey texture. The treatments consisted of increasing rates of wastewater equivalent to
0, 150, 300, 450 and 600 m
3ha
-1, with a single application, at the soil surface and without
incorporation. The application of the gelatin industry wastewater resulted no negative
effects on soil chemical properties to a depth of 60 cm. The application of the levels of
wastewater increased the concentration of sodium in the soil, but without causing
problems with sodicity.
INTRODUCTION
Skin and bones of cattle or swine are rich in protein and can be used in the manufacturing of gelatin as raw material. In this process, large amounts of wastewater, also called gelatin industry wastewater (GIW) are generated. The chemical composition of GIW, shows potential for application on agricultural soils as a source of nutrients for crops.
A gelatin industry can produce up to 14 tons of gelatin and approximately 600 m3 per day of residue
(Taniguchi, 2010). From an economic point of view, the application of this residue is viable in areas near to the industry. Thus the disposal of high rates of GIW in the soil is common on small areas surrounding the industries. The problem associated with application of GIW is the absence technical criteria, due to the lack of studies the development of appropriate legislation regulating the reuse, that can alter the chemical and physical properties of the soil (Bonini et al., 2014).
Previous studies showed that the gelatin industry residue as potential for use in agriculture as a source of nitrogen to crops, increasing the productivity and its application in a controlled manner, causes no negative impacts on soil fertility (Taniguchi, 2010; Guimarães et al., 2012). Taniguchi (2010) also observed that the application
of up to 500 m3 h-1 of sludge from gelatin industry do not
resulted in leaching of N-NO3- and Na+ in a clayey soil,
showing the low potential of groundwater contamination of sludge from gelatin industry, under these conditions.
On other hand, Guimarães et al. (2012) found that the application of up to 500 m3 ha-1 of sludge from gelatin
industry increase the base saturation content in the soil in values greater than the effective Cation Exchange Capacity (CEC), indicating that most of the cations added by the sludge remain in solution and could be lost by leaching.
The main limitation of the gelatin residue use in soil is the high concentration of sodium. However, authors such as Taniguchi (2010) and Guimarães et al. (2012) found no impairment of soil fertility and nor reduction of plant growth, even at the highest rate of sludge from gelatin industry (500 m3 ha-1 which is equivalent to adding of 0.012
cmolc dm-3 of sodium).
The present study aimed to evaluate the effects of the application of increasing rates (0-600 m3 ha-1) of gelatin
industry wastewater (GIW) in soil columns under greenhouse conditions, on the chemical attributes of five layers of soil, 0-0.05,0.05-0.10, 0.10-0.20, 0.20-0.40 and 0.40-0.60 m deep.
MATERIAL AND METHODS
The experiment was conducted in a greenhouse at the Irrigation Technical Center (CTI) of the State University of Maringá (UEM), located in the city of Maringá, PR (23º23'57'' S, 51º57'05'' W, 542 m altitude) from September to November of 2012.
Soil sample was selected, from an area of the CTI/UEM with no record of organic residue application. The soil is classified as distroferric Red Nitosol, of very clayey texture at the 0-0.20 m layer, with 230 g kg-1 of sand,
60 g kg-1 silt and 710 g kg-1 clay, according to
characterization made by Salvestro et al., 2012.
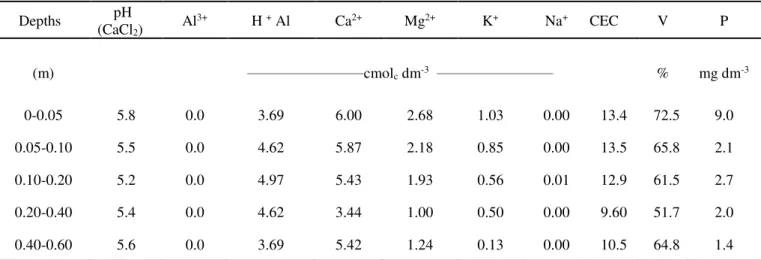
The soil samples were collected in layers of 0-0.05, 0.05-0.10, 0.10-0.20, 0.20-0.40 and 0.40-0.60 m.. After sampling, the soil samples of each layer were dried, crumbled, sieved (4 mm mesh) and homogenized. The initial soil chemical analyzes of each soil layer (Table 1) were performed by the Soil Fertility Laboratory of the Agronomy Department/UEM, according to methods proposed by Embrapa (1997).
TABLE 1. Soil chemical characterization of the soil, sampled at different depths.
Depths (CaClpH
2) Al
3+ H + Al Ca2+ Mg2+ K+ Na+ CEC V P
(m) ________________________cmol
c dm-3 ________________________ % mg dm-3
0-0.05 5.8 0.0 3.69 6.00 2.68 1.03 0.00 13.4 72.5 9.0
0.05-0.10 5.5 0.0 4.62 5.87 2.18 0.85 0.00 13.5 65.8 2.1
0.10-0.20 5.2 0.0 4.97 5.43 1.93 0.56 0.01 12.9 61.5 2.7
0.20-0.40 5.4 0.0 4.62 3.44 1.00 0.50 0.00 9.60 51.7 2.0
0.40-0.60 5.6 0.0 3.69 5.42 1.24 0.13 0.00 10.5 64.8 1.4
pH: hydrogen potential, Al3+: aluminum, H+Al: potential acidity, Ca2+: cation calcium, Mg2+: cation magnesium, K+: cation potassium, Na+:
cation sodium, CEC: cation exchange capacity, V: percentage saturation per base, P: phosphorus
The soil columns were made of Polyvinyl chloride (PVC) tubes of 0.20 m diameter, 0.70 m height. On the bottom of the column a nylon screen was installed (1 mm mesh) under a filter media layer (Bidim) to hold the soil, but to allow water to low. To minimize preferential flow of the liquid effluent in the column, PVC glue and sand were applied on the inner surface. After 24 hours, the columns were then filled with five layers of soil (0-0.05, 0.05-0.10, 0.10-0.20, 0.20-0.40 and 0.40-0.60 m), which were deposited gradually, reestablishing the original soil bulk density of the soil by compaction. Subsequently, 5.0 L of deep-well water was applied in each soil column to accommodate the soil.
To ensure the same volume of liquid in all the experimental units (600 m3 ha-1), deep-well water was also
added in sufficient amount to complete the liquid volume in each soil column. To facilitate the infiltration of the residue and water in the soil, the application was carried out in a gradual and uniform manner. The basic volume was 150 m3
ha-1, so that the highest rate (600 m3 ha-1) was equivalent to
four GIW applications, divided into four consecutive days (26, 27, 28 and 29 of September/2012). Seven days after GIW application (06 of October/2012), corn seeds (Zea mays L.) AG1051 hybrid – Agroceres for silage, were sown in the experimental units.
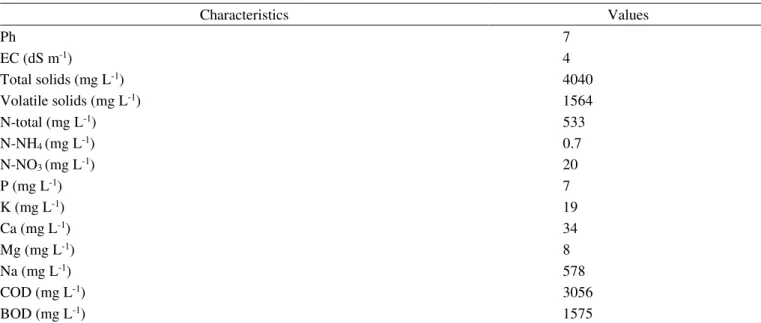
TABLE 2. Average physicochemical characteristics of the gelatin industry wastewater used in the experiment.
Characteristics Values
Ph 7
EC (dS m-1) 4
Total solids (mg L-1) 4040
Volatile solids (mg L-1) 1564
N-total (mg L-1) 533
N-NH4 (mg L-1) 0.7
N-NO3 (mg L-1) 20
P (mg L-1) 7
K (mg L-1) 19
Ca (mg L-1) 34
Mg (mg L-1) 8
Na (mg L-1) 578
COD (mg L-1) 3056
BOD (mg L-1) 1575
pH: hydrogen potential, EC: electric conductivity, N-total: Nitrogen-total, N-NH4 : Nitrogen-ammonium, N-NO3: Nitrogen-nitrate, P:
phosphorus, K: potassium, Ca: calcium, Mg: magnesium, Na: sodium, COD: Chemical oxygen demand, BOD: biochemical oxygen demand.
Soil sampling was conducted on December 2nd,
2012, 63 days after the application of GIW rates. Destructive samples were taken from the five layers of soil in columns: 0-0.05, 0.05-0.10, 0.10-0.20, 0.20-0.40 and 0.40-0.60 m.
The soil samples were sent to the Soil Fertility Analysis Laboratory at the State University of Maringá (UEM) - Maringá - PR. pH in CaCl2, Al3+, potential acidity
(H + Al), Ca2+, Mg2+, K+, Na+, CEC, V and P were evaluated
in the five layers of soil, in accordance to the methodologies described by Embrapa (1997).
The collection of the aerial part of the corn plants was carried out on 11/29/2012, 50 days after the emergence of the plants and 60 days after the application of the GIW rates, cutting the corn plants close to the soil. The plant material was placed in an oven with forced air circulation at a temperature of 65 ° C, until constant weight, to obtain the dry matter.
The ESP index, indicative of the proportion of sodium adsorbed in the soil cation exchange complex, was calculated using the following equation:
ESP= CECNa ×100 (1)
Where,
ESP – exchangeable sodium percentage, %; Na – Exchangeable sodium content, cmolc dm-3 and
CEC - Cation Exchange Capacity, cmolc dm-3
Statistical analysis was performed by analysis of variance, the data were submitted to ANOVA using the F test (p <0.05). For the chemical attributes of the soil in each of the depths sampled, the t test was performed to compare means at a 5% probability level. The chemical attributes as a function of the GIW rates were submitted to polynomial regression analysis (p < 0.05).
RESULTS AND DISCUSSION
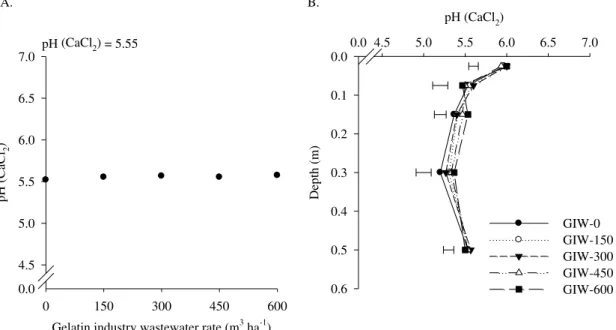
The application of increasing rates of wastewater from gelatin industry (GIW) had no effect on soil pH in CaCl2 (Figure 1A), in all sampled layers of soil (Figure 1B).
pH (CaCl2)
0.0 4.5 5.0 5.5 6.0 6.5 7.0
Dep
th
(m
)
0.0
0.1
0.2
0.3
0.4
0.5
0.6
GIW-0 GIW-150 GIW-300 GIW-450 GIW-600
Gelatin industry wastewater rate (m3 ha-1)
0 150 300 450 600
pH
(CaCl
2
)
0.0 4.5 5.0 5.5 6.0 6.5
7.0 pH (CaCl2) = 5.55
A. B.
FIGURE 1. Average values of soil pH in CaCl2, (A) due to the application of gelatin industry wastewater (GIW) in rates: 0
(GIW-0), 150 (GIW-150), 300 (GIW-300), 450 (GIW-450) and 600 m3 h-1 (GIW-600), (B) and in the 0-0.05, 0.05-0.10,
0.10-0.20, 0.20-0.40 and 0.40-0.60 m soil layers. The horizontal bars indicate the minimum significant difference, according to the t test (p < 0.05).
These results disagree with the results of other studies, Francisco et al. (2015) verified that soil pH decreased as vinasse volumes increased (0, 231, 347, 462 and 578 m3 ha-1) in an Oxisol and by Condé et al. (2013)
which also verified the increase of acidity in the deeper layers with application of liquid swine manure (0, 50, 100, 150 m3.ha. year -1) in a dystrophic Oxisol.
Fortes Neto et al. (2013) verified pH increase after fertilized in the soil with increasing rates of domestic wastewater (0, 30, 60 and 90 m3 ha-1) in dystrophic yellow
Argisol; Guimarães et al. (2012) observed significant effect the pH of the soil with application increasing rates of sludge from gelatin industry (0, 100, 200, 300, 400, and 500 m3 ha -1) in two Ultisols (loamy sand and sandy clay) and an Oxisol
(clay). The authors justify the increase in the soil pH due to the high pH of the sludge, as a result of the gelatin production process, wherein the raw material (scrapings and trimmings of bovine leather) is treated with sodium hydroxide and lime to collagen extraction.
Organic materials contain phenolic, carboxylic and enolic groups, which may consume protons due to the association of H+ of the soil with these anions, resulting in
the increase in soil pH (Naramabuye & Haynes, 2007). In the present study, the lack of effect for pH was due to the absence of these proton consumer compounds in sufficient quantity to cause a significant impact on soil acidity. These results of the present study agree with Taniguchi (2010), which also did not observe effect of the application increasing rates of sludge from gelatin industry (0; 100; 200; 300; 400 and 500 m3 ha-1) in soil pH, Cabral et al. (2014)
with the application of liquid swine manure (0, 150, 300, 450, 600 and 750 m3 ha-1) and Andrade Filho et al. (2013)
with wastewater from domestic sources (dilutions of the domestic effluent (25% - T1, 50% - T2, 75% - T3 and 100% of wastewater - T4 and supply water + soil mineral fertilization - T5) in a latossol.
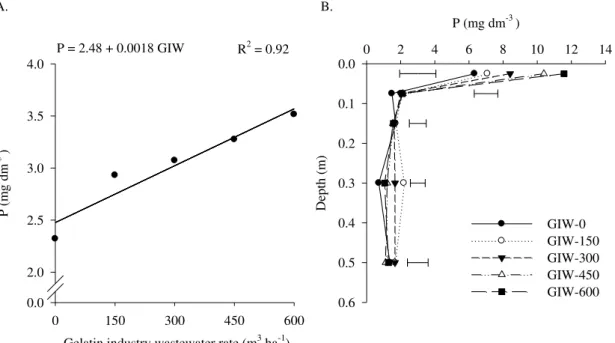
The application of increasing rates of GIW influenced soil phosphorus concentrations, and it was possible to adjust a linear regression model (Figure 2A). There was an increase of 51% in the soil P content, applying 600 m3 ha-1 (3.51 mg dm-3), when compared to the control
treatment (2.32 mg dm-3), without the application of GIW.
Gelatin industry wastewater rate (m3 ha-1)
0 150 300 450 600
P (m
g
dm
-3 )
0.0 2.0 2.5 3.0 3.5 4.0
P = 2.48 + 0.0018 GIW R2 = 0.92
P (mg dm-3 )
0 2 4 6 8 10 12 14
Depth
(m
)
0.0
0.1
0.2
0.3
0.4
0.5
0.6
GIW-0 GIW-150 GIW-300 GIW-450 GIW-600
A. B.
FIGURE 2. Response of soil P average concentration as function of application the GIW, (A) in rates: 0 0), 150 (GIW-150), 300 (GIW-300), 450 (GIW-450) and 600 m3 h-1 (GIW-600), (B) and in the 0-0.05, 0.05-0.10, 0.10-0.20, 0.20-0.40 and
0.40-0.60 m soil layers. The horizontal bars indicate the minimum significant difference, according to the t test (p <0.05). Increments of P in the soil were observed in studies
with the application of sludge from gelatin industry (Guimarães et al., 2012) municipal solid waste leachate (Silva et al., 2011), domestic wastewater (Barreto et al., 2013), cassava wastewater (Duarte et al., 2013), liquid swine (Maggi et al., 2013; Souza et al., 2013; Trevisan et al., 2013), effluent from UASB reactor and series of filter (Nascimento & Fideles Filho, 2015), and alkaline effluent from a pharmaceutical industry (Esper Neto et al., 2016).
Regarding the levels of P in depth, it was observed that the effects of the application of GIW were restricted mainly to the superficial soil layer (0-0.05 m), since there was no migration of the nutrient to the lower layers of the soil profile (Figure 2B). The same observations was obtained by Esper Neto et. al. (2016) recorded P increments basically in the surface soil layer.
The non-movement of the P along the soil profile is justified by the fact that the Nitosol with clay texture (710 g kg-1 of clay) used in the present study is weathered, with a
predominance of clay from kaolinite, gibbsite, goethite and hematite types, presenting high degree of P specific
adsorption, which restrict the movement of this nutrient in the soil profile (Souza et al., 2006). This result is very important from an environmental point of view, as it highlights the low risk of contamination of groundwater by P, element directly involved (and limiting) in the eutrophication process.
Changes in P levels, in depth, have been associated with the use of wastewater for long periods or in high rates (Scherer et al., 2010), indicating the importance of the added amount of P in the movement of this element in the soil profile. Therefore, the low amount of P in the GIW (single application), the soil characteristic (high fixation capacity), the method of application (surface application) and the rates used are the probable causes of low migration of this nutrient in the soil used in this study.
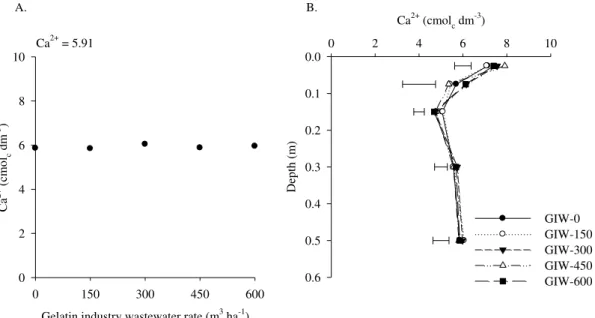
There were no detectable levels of exchangeable aluminum (Al3+) in all treatments, making it unnecessary
the statistical analysis of this element (data not shown). The application of increasing rates of GIW also had no significant effects on the average values of Ca2+ (Figure
Ca2+ (cmolc dm-3)
0 2 4 6 8 10
Dep
th
(m
)
0.0
0.1
0.2
0.3
0.4
0.5
0.6
GIW-0 GIW-150 GIW-300 GIW-450 GIW-600
Gelatin industry wastewater rate (m3 ha-1)
0 150 300 450 600
Ca
2+ (
cm
ol dmc
-3 )
0 2 4 6 8 10 Ca
2+
= 5.91
A. B.
FIGURE 3. Response of soil Ca2+ average concentration as function of application the GIW, (A) in rates: 0 0), 150
(GIW-150), 300 (GIW-300), 450 (GIW-450) and 600 m3 h-1 (GIW-600), (B) and in the 0-0.05, 0.05-0.10, 0.10-0.20, 0.20-0.40 and
0.40-0.60 m soil layers. The horizontal bars indicate the minimum significant difference, according to the t test (p <0.05). Theresults of the present study differ from those
reported by Trevisan et al. (2013) which verified a linear reduction of Ca2+ with the application of swine wastewater.
Similarly, Guimarães et al. (2012), found significant effect of Ca2+, with the increasing application of sludge from
gelatin industry. The clayey soil used by Guimarães et al. (2012) showed a low concentration of Ca2+ (1.4 cmolc dm -3, at the 0-0.20 m layer). According to Serrat et al. (2006),
in relation to the soil of the present study which combined with high concentrations of the element in the applied residue composition (> 1000 mg L-1), allowed significant
increases in Ca2+ levels of the soil, especially in higher rates.
In the present study the soil already had high concentration of Ca2+ at the initial condition (5.43 to 6.0
cmolc dm-3, for the first 0.20 m of depth, as shown in Table
1), according to Serrat et al. (2006) and applied GIW contained lower Ca2+ concentration (33.62 mg L-1)
compared to the sludge from gelatin industry by Guimarães et al. (2012), even at higher doses (600 m3 ha-1), was not
enough to cause significant changes in Soil Ca2+ contents.
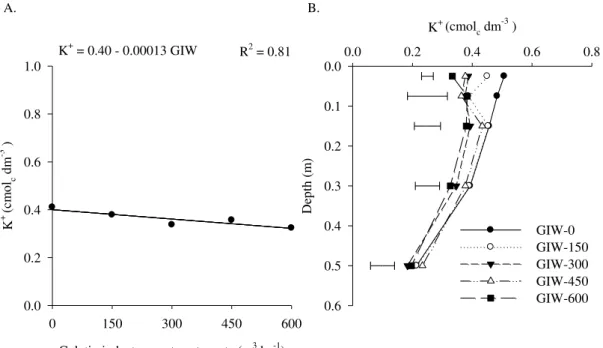
The application of increasing rates of GIW significantly reduced the average concentrations of Mg2+
and K+ in the soil, (Figures 4A and 5A, respectively). It is
likely that reduction of Mg2+ and K+ was due to increase in
Na+ concentration from the application of GIW (Figure 6A),
which may have caused the release of these adsorbed cations from the soil exchange complex, as observed by Pereira et al. (2011) with domestic wastewater application into soil. It is reported that the decrease in Mg2+ and K+
levels, with increasing rates of GIW, was restricted to the superficial soil layer (Figures 4B and 5B, respectively), where there was a higher Na+ concentration (Figure 6B),
and therefore, increased release of these cations to the soil solution.
)
2.0 2.5 3.0 Mg
2+
= 1.94 + 0.00023 GIW R2 = 0.88
Mg2+ (cmolc dm-3 )
0 1 2 3 4
0.0
0.1
0.2
Gelatin industry wastewater rate (m3 ha-1)
0 150 300 450 600
K
+ (cm
olc dm
-3 )
0.0 0.2 0.4 0.6 0.8
1.0 K
+ = 0.40 - 0.00013 GIW
R2 = 0.81
K+ (cmol
c dm -3 )
0.0 0.2 0.4 0.6 0.8
Dep
th (
m
)
0.0
0.1
0.2
0.3
0.4
0.5
0.6
GIW-0 GIW-150 GIW-300 GIW-450 GIW-600
A. B.
FIGURE 5. Response of soil K+ average concentration as function of application the GIW, (A) in rates: 0 0), 150
(GIW-150), 300 (GIW-300), 450 (GIW-450) and 600 m3 h-1 (GIW-600), (B) and in the 0-0.05, 0.05-0.10, 0.10-0.20, 0.20-0.40 and
0.40-0.60 m soil layers. The horizontal bars indicate the minimum significant difference, according to the t test (p <0.05). Even with the reduction of soil Mg2+ and K+ levels
with the application of increasing rates of GIW, losses were not observed in soil fertility, since even the lowest concentrations of Mg2+ and K+ (0.32 cmolc dm-3 and 1.82
cmolc dm-3 respectively) found at the highest applied rates
(600 m3 ha-1), are still high and adequate level, according
to Serrat et al. (2006) (> 0.8 cmolc dm-3 of Mg2+, > 0.30
cmolc dm-3 of K+).
There was significant and increasing accumulation in the average levels of Na+ with the increase in GIW rates
(Figure 6A), and in all layers of the availed soil (Figure 6B). The Na+, in addition to being in high concentration in the
GIW (578 mg L-1, Table 2), can be easily leached to deeper
layers due to its low affinity characteristic in the soil exchange complex, remaining mainly in the soil solution (Leal et al., 2009).
Gelatin industry wastewater rate (m3 ha-1)
0 150 300 450 600
Na
+ (
cm
olc dm
-3 )
0.0 0.2 0.4 0.6 0.8 1.0
Na+ = 0.23 + 0.0004 GIW R2 = 0,99
Na+ (cmol
c dm -3 )
0.0 0.1 0.2 0.3 0.4 0.5 0.6 0.7 0.8
Dep
th
(m
)
0.0
0.1
0.2
0.3
0.4
0.5
0.6
GIW-0 GIW-150 GIW-300 GIW-450 GIW-600
A. B.
FIGURE 6. Response of soil Na+ average concentration as function of application the GIW, (A) in rates: 0 0), 150
(GIW-150), 300 (GIW-300), 450 (GIW-450) and 600 m3 h-1 (GIW-600), (B) and in the 0-0.05, 0.05-0.10, 0.10-0.20, 0.20-0.40 and
Increases in Na+ concentration in the soil were also
reported by Guimarães et al. (2012), working with the application of sludge from gelatin industry to the soil, and studies with the use of other residual waters, such as wastewater from domestic sources (Leal et al., 2009; Pereira et al., 2011; Mendes et al., 2016), liquid swine manure (Prior et al., 2013; Homen et al., 2014); cassava wastewater (Duarte et al., 2013) vinasse (Bonini et al., 2014) and tannery wastewater (Matos et al., 2014). According to Leal et al. (2009) excess of salts in the soil, especially Na+, can
increase the salinity and sodicity, resulting in deterioration
of the physical properties of the soil, which, added to the toxic and osmotic effects of these ions, lead to reduction of crop yield.
Even in the upper soil layer (0-0.5 m) and at the highest rate of GIW (600 m3 h-1), where the highest content
of Na+ in soil was observed (0.68 cmolc dm-3), and
exchangeable sodium percentage (ESP) value (5.27% - Table 3) remained below the 15% limit, considered the soil sodicity indicator (Leal et al., 2009; Duarte et al., 2013; Prior et al., 2013).
TABLE 3. Exchangeable sodium percentage (ESP) in the 0-0.5, 0.05-0.10, 0.10-0.20, 0.20-0.40 and 0.40-0.60 m of soil, due to the different gelatin industry wastewater (GIM) application rates.
ESP (%)
Depth (m) Rate of GIW (m3 ha-1 )
0 150 300 450 600
0-0.05 3.55 4.07 4.12 4.03 5.27
0.05-0.10 2.57 3.36 3.95 4.85 5.27
0.10-0.20 1.46 2.64 3.36 4.25 4.58
0.20-0.40 0.85 1.31 1.53 2.28 2.44
0.40-0.60 0.41 0.45 0.45 0.65 0.74
Duarte et. al. (2013) concluded that the use of cassava wastewater did not cause soil salinization after a single application of the residue doses, as occurred in the present study. Similarly Mendes et al. (2016) observed that with the application of domestic wastewater to the soil, there was an increase in ESP values, changing from 0.23% to 3.51% at the end of the experiment, without causing problems with sodicity.
Furthermore, in the study conducted by Leal et al. (2009) with sewage effluent, soil sodification occurred over time (ESP > 15%), and this condition is more related to the continuous use of the effluent than the actual applied amount. Therefore, it is noteworthy that the continuous
application of residual waters on the soil with high concentrations of sodium should be done cautiously since there may result, in long term, in soil salinization and/or sodification.
Dry matter (aerial part) of maize plants at 50 days increased of the GIW rate, adjusting for regression to the first degree polynomial function (Figure 7). The average dry matter (aerial part) of maize plants varied from 41.17 to 51.43 g per column at rates of 0 and 600 m3 ha-1
respectively. Similar results were observed by Taniguchi (2010), who found a positive effect of the application sludge from gelatin industry on maize dry matter production.
g co
lu
nm
-1 ) 60 65
CONCLUSIONS
1. The gelatin industry wastewater (GIW), applied up to the rate of 600 m3 ha-1, once superficially and without
incorporation, on columns containing Nitosol cultivated with maize for silage, did not resulted negative effects on soil chemical properties, to a depth of 0.60 m.
2. The application of the GIW contributed to the increase of the phosphorus and decrease of the magnesium and potassium in the soil solution.
3. With respect to Na+, the most abundant element in
GIW, increase in levels occurred throughout the assessed soil profile, without causing sodicity.
4. Dry matter of maize plants increased of the GIW rate.
REFERENCES
Andrade Filho J, Sousa Neto ON, Dias NS, Nascimento IB, Medeiros JF, Cosme CR (2013) Atributos químicos de solo fertirrigado com água residuária no semiárido brasileiro. Irriga,18(4):661-674.
APHA - American Public Health Association, AWWA - American Water Works Association, WEF - Water Environment Federation (2012) Standard Methods for examination of water and wastewater. Washington, American Public Health Association, 22nd. 1360 p.
Barreto AN, Nascimento JJVR, Medeiros EP, Nóbrega JA, Bezerra JRC (2013) Changes in chemical attributes of a Fluvent cultivated with castor bean and irrigated with wastewater. Revista Brasileira de Engenharia Agrícola e Ambiental 17(5):480-486. DOI:
http://dx.doi.org/10.1590/S1415-43662013000500003 Bonini MA, Sato LM, Bastos RG, Souza CF (2014) Alterações nos atributos químicos e físicos de um Latossolo vermelho irrigado com água residuária e vinhaça. Revista Biociências 20(1):78-85.
Cabral JR, Freitas PSL, Rezende R, Muniz AS, Bertonha A (2014) Changes in chemical properties of distrophic Red Latosol as result of swine wastewater application. Revista Brasileira de Engenharia Agrícola e Ambiental 18(2):210-216. DOI:
http://dx.doi.org/10.1590/S1415-43662014000200012
Condé MS, Almeida Neto OB, Homem BGC, Ferreira IM, Silva MD (2013) Impacto da fertirrigação com água residuária da suinocultura em um latosso vermelho-amarelo. VÉRTICES 15(2):161-178. DOI:
http://dx.doi.org/10.5935/1809-2667.20130024 Duarte AS, Rolim MM, Silva EFF, Pedrosa EMR, Albuquerque FS (2013) Alterações dos atributos físicos e químicos de um Neossolo após aplicação de doses de manipueira. Revista Brasileira de Engenharia Agrícola e Ambiental17(9):938-946. DOI:
http://dx.doi.org/10.1590/S1415-43662013000900005 EMBRAPA - Empresa Brasileira de Pesquisa Agropecuária. Centro Nacional de Pesquisa de Solos (1997) Manual de métodos de análise de solo. Rio de Janeiro, 2 ed. rev. atual. 212 p.
Esper Neto M, Batista MA, Inoue TT, Bertonha A, Costa ACS (2016) Soil chemical attributes of a dystroferric red latossol (oxisol) treated with na alcaline efluente from a pharmaceutical industry. Semina: Ciências Agrárias 37(5):3037-3046. DOI: http://dx.doi.org/10.5433/1679-0359.2016v37n5p3037
Fortes Neto P, Veiga PGA, Fortes NLP, Targa MS, Gadioli JL, Peixoto PHM (2013) Alterações químicas do solo e produção de aveia fertilizada com água residuária do tratamento de esgoto sanitário. Revista Ambiente & Água 8(supl):71-83. DOI:http://dx.doi.org/10.4136/1980-993X Francisco JP, Folegatti MV, Silva LBD, Silva JGB (2015) Monitoramento da condutividade elétrica e pH da solução do solo sob diferentes doses de aplicação de vinhaça. Engenharia na agricultura 23(6):552-561.
Guimarães RCM, Cruz MCP, Ferreira ME, Taniguchi CAK (2012) Chemical properties of soils treated with biological sludg e from gelatin industry. Revista Brasileira de Ciência do Solo 36(2):653-660. DOI:
http://dx.doi.org/10.1590/S0100-06832012000200034 Homen BGC, Almenida Neto OB, Condé MS, Silva MD, Ferreira IM (2014) Efeito do uso prolongado de água residuária da suinocultura sobre as propriedades químicas e físicas de um Latossolo Vermelho-Amarelo. Científica 42(3):299-309. DOI: http://dx.doi.org/10.15361/1984-5529.2014v42n3p299-309
Leal RMP, Herpin U, Fonseca AF, Firme LP, Montes CR, Melfi AJ (2009) Sodicity and Salinity in a Brazilian Oxisol cultiveted with Sugarcane irrigated with wastewater. Agricultural Water Management 96(2):307-316. DOI: http://dx.doi.org/10.1016/j.agwat.2008.08.009 Maggi CF, Freitas PSL, Sampaio SC, Dieter J (2013) Impacts of the application of swine wastewater in percolate and in soil cultivated with soybean. Engenharia Agrícola 33(2):279-290. DOI:
http://dx.doi.org/10.1590/S0100-69162013000200007 Matos AT, Martins PO, Lo Monaco PAV (2014) Alterações químicas no solo após fertirrigação do capim Mombaça com água residuária de curtume. Engenharia na agricultura 22(2):128-137.
Mendes PEF, Bastos RG, Souza CF (2016) Efluente tratado na agricultura: aspectos agronômicos e sanitários no cultivo do rabanete. Revista Brasileira de Agricultura Irrigada 10(1):428-438. DOI:
https://dx.doi.org/10.7127/rbai.v10n100347
Naramabuye FX, Haynes RJ (2007) The liming effect of five organic manures when incubated with an acid soil. Journal of Plant Nutrition and Soil Science 170:615-622. DOI: https://dx.doi.org/10.1002/jpln.200700056
Pereira BFF, Ele ZL, Silva MS, Herpin U, Nogueira SF, Montes CR, Melfi AJ (2011) Reclaimed wastewater: Impact on soil–plant system under tropical conditions. Journal of Hazardous Materials 192(1):54-61. DOI: http://dx.doi.org/10.1016/j.jhazmat.2011.04.095
Prior M, Sampaio SC, Nóbrega LHP, Opazo MAU, Dieter J, Pegoraro T (2013) Combined pig slurry and mineral fertilization for corn cultivation. Brazilian Archives of Biology and Technology 56(2):337-348. DOI: http://dx.doi.org/10.1590/S1516-89132013000200020 Salvestro AC, Freitas PSL, Rezende R, Dallacort R, Vieira CV (2012) Permanent wilting point of bean cultivated in dystricnitosols and rhodicferralsols. International Journal of Food, Agriculture and Environment 10(1):462-466. Scherer EE, Nesi CN, Massotti Z (2010) Atributos químicos do solo influenciados por sucessivas aplicações de dejetos suínos em áreas agrícolas da Região Oeste Catarinense. Revista Brasileira de Ciência do Solo 34(4):1375-1383. DOI: http://dx.doi.org/10.1590/S0100-06832010000400034
Serrat BM, Krieger K, Motta ACV (2006) Considerações sobre interpretação de análise de solos In: Lima MR (ed). Manual de diagnóstico da fertilidade e manejo dos solos agrícolas. Curitiba, UFPR/Setor de Ciências Agrárias, p 125-142.
Silva DF, Matos AT, Pereira OG, Cecon PR, Batista RO, Moreira DA (2011) Alteração química de solo cultivado com capim Tifton 85 (Cynodon spp.) e fertirrigado com percolado de resíduo sólido urbano. Acta Scientiarum. Technology 33(3):243-251. DOI:
http://dx.doi.org/10.4025/actascitechnol.v33i3.6124 Souza JAR, Moreira DA, Matos AT, Rodrigues ASL (2013) Effect of irrigation with wastewater from swine in the chemical properties of a latossol. African Journal of Agricultural Research 8(41):5166-5173. DOI:
http://dx.doi.org/10.5897/AJAR2013.7078
Souza RF, Faquin V, Torres PRF, Baliza DP (2006) Calagem e adubação orgânica: Influência na adsorção de fósforo em solos. Revista Brasileira de Ciência do Solo 30(6):975-983. DOI: http://dx.doi.org/10.1590/S0100-06832006000600007
Taniguchi CAK (2010) Mineralização do lodo biológico de indústria de gelatina, atributos químicos de solo e uso fertilizante para produção de milho. Tese Doutorado, Jaboticabal, Universidade Estadual Paulista.