CERN-EP-2018-013 2018/06/05
CMS-TOP-16-014
Measurements of differential cross sections of top quark
pair production as a function of kinematic event variables
in proton-proton collisions at
√
s
=
13 TeV
The CMS Collaboration
∗Abstract
Measurements of differential tt production cross sections are presented in the single-lepton decay channel, as a function of a number of kinematic event variables. The measurements are performed with proton-proton collision data at√s = 13 TeV, col-lected by the CMS experiment at the LHC during 2016, with an integrated luminosity of 35.9 fb−1. The data are compared to a variety of state-of-the-art leading-order and next-to-leading-order tt simulations.
Published in the Journal of High Energy Physics as doi:10.1007/JHEP06(2018)002.
c
2018 CERN for the benefit of the CMS Collaboration. CC-BY-4.0 license ∗See Appendix D for the list of collaboration members
1 Introduction
In 2016 the CERN LHC collided protons at √s = 13 TeV, resulting in a data set recorded by the CMS experiment [1], with an integrated luminosity of 35.9 fb−1. Approximately 30 million top quark-antiquark pairs (tt) are present in this data set, which allows detailed studies of the production properties of tt events to be performed.
Measurements of kinematic distributions in tt events are important for verifying current theo-retical models of tt production and decay. As tt production and top quark decay can be a sig-nificant source of background events in many searches for physics beyond the standard model, for example in searches for supersymmetric models with top-quark-like signatures, it is impor-tant that tt production be well understood and modeled. In addition to physics beyond the standard model, a good understanding of tt production is necessary for measurements of rare standard model processes, such as tt production in association with a W, Z, or Higgs boson. In this paper, we present measurements of differential tt production cross sections, as a function of kinematic event variables that do not require the reconstruction of the tt system. Events are considered when the final state includes exactly one isolated lepton (` = e or µ) with large transverse momentum pTand at least four jets, of which at least two are tagged as originating
from a bottom (b) quark. The kinematic event variables are the jet multiplicity (Njets), the scalar
sum of the jet pT (HT), the scalar sum of the pT of all particles (ST), the transverse momentum
imbalance (pmissT ), the magnitude of the pTof the leptonically decaying W boson (pWT ), and the
magnitudes of the pTand pseudorapidity of the lepton (p`Tand|η`|).
The measurements of the differential tt production cross sections are presented at particle level, i.e. with respect to generated “stable” particles (with a mean lifetime longer than 30 ps), in a phase space that closely resembles that accessible by the CMS detector (the visible phase space). This avoids the influence of large theoretical uncertainties that would be introduced by extrapolating the measurements to a larger phase space, or by presenting the measurements at parton level.
Several measurements of the differential tt production cross sections as a function of the prop-erties of the tt system and of the jet activity in tt events have been performed at the LHC, at 7 and 8 TeV [2–6], and 13 TeV [7–10]. Measurements with respect to kinematic event variables in tt events have been performed with the CMS detector at 7 and 8 TeV [11].
2 The CMS detector
The central feature of the CMS apparatus is a superconducting solenoid of 6 m internal di-ameter, providing a magnetic field strength of 3.8 T. Within the solenoid volume are a silicon pixel and strip tracker, a lead tungstate crystal electromagnetic calorimeter (ECAL), and a brass and scintillator hadron calorimeter, each composed of a barrel and two endcap sections. For-ward calorimeters extend the η coverage provided by the barrel and endcap detectors. Muons are measured in gas-ionization detectors embedded in the steel flux-return yoke outside the solenoid. A more detailed description of the CMS detector, together with a definition of the coordinate system used and the relevant kinematic variables, can be found in Ref. [1].
Events of interest are selected using a two-tiered trigger system [12]. The first level, composed of custom hardware processors, uses information from the calorimeters and muon detectors to select events at a rate of around 100 kHz within a time interval of less than 4 µs. The second level, known as the high-level trigger (HLT), consists of a farm of processors running a version of the full event reconstruction software optimized for fast processing, and reduces the event
rate to around 1 kHz before data storage.
3 Signal sample and background simulation
Two independent tt samples are simulated with the POWHEG (v2) generator [13–16], which utilizes next-to-leading-order (NLO) matrix-element calculations. One sample uses PYTHIA
(v8.212) [17, 18] with the CUETP8M2T4 tune [19] for the simulation of the parton shower and hadronization. The second has parton showering and hadronization performed byHERWIG++ (2.7.1) [20] using the tune EE5C [21].
Two additional independent simulated tt samples are produced with theMG5 aMC@NLO(v2.2.2)
generator [22]. In the first, MG5 aMC@NLO is used to generate events at leading-order (LO)
accuracy with up to three additional partons, andPYTHIA is employed with the CUETP8M1 tune [23] for parton showering and hadronization. The MLM jet-parton matching algorithm [24] is used in this sample, referred to asMG5 aMC@NLO-LO. In the second,MG5 aMC@NLO simu-lates events to NLO accuracy with up to two additional partons, where parton showering and hadronization are performed usingPYTHIAwith the CUETP8M2T4 tune. The FxFx jet-parton matching algorithm [25] is used, and this sample is referred to asMG5 aMC@NLO-NLO. It is
im-portant to compare multiple tt generators in order to find the current most suitable description of top quark production and decay, and to identify any discrepancies in the models.
In all simulated tt samples, the top quark mass is set to 172.5 GeV. The NNPDF30 nlo as 0118 parton distribution function (PDF) set is used for the NLO samples while the NNPDF30 lo as 0130 set is used for the LO samples [26]. When comparing with reconstructed data, a cross section of 832+−2029(scale)±35(PDF+αS)pb is used to normalize the tt samples,
where αSis the strong coupling constant. This tt cross section is calculated to
next-to-next-to-leading-order (NNLO) accuracy in quantum chromodynamics (QCD) including resummation of next-to-next-to-leading logarithmic soft-gluon terms with TOP++ (v2.0) [27–33]. The scale
uncertainty in this tt cross section comes from the independent variation of the factorization and renormalization scales.
The dominant background processes to tt production, i.e. the production of single top quarks and the production of vector bosons in association with jets, are also simulated. Single top quark processes are generated with POWHEG interfaced with PYTHIA, and are normalized to
cross sections that are calculated to NLO precision [34, 35]. Separate samples are generated for t- and s-channel production [36, 37]. The sample of single top quarks in association with a W boson is produced withPOWHEG(v1) [38]. In this sample, the diagram removal scheme [39] is used to avoid double counting of Feynman diagrams in the production of single top quarks in association with a W boson at NLO and top quark pair production. Samples of W and Z boson production with leptonic final states, in association with jets (V+jets), are generated with MG5 aMC@NLO-LO. Separate samples are generated with exactly one, two, three, and four additional jets to ensure a large sample of events that are likely to mimic the signature of tt production. These samples are normalized to their NNLO cross sections [40].
In addition, QCD multijet events are generated withPYTHIA for matrix-element calculations, parton shower simulation, and hadronization. To obtain a large sample of QCD multijet events that are likely to mimic the signature of tt production in the single-lepton decay channel, only events with large electromagnetic activity or containing a muon are generated. These samples are normalized to their LO cross sections and are used to create transfer factors from a control region to the signal region for a QCD background estimate based on data in the control region. The CMS detector response for all simulated samples is modeled using GEANT4 [41].
4 Event reconstruction and selection
Parallel selection paths are defined to target tt events that decay to final states containing an electron (e+jets) or a muon (µ+jets). The HLT in the e+jets channel requires at least one isolated electron candidate with pT > 32 GeV and|η| < 2.1. The corresponding requirements in the µ+jets channel are at least one isolated muon candidate with pT >24 GeV and|η| <2.4.
Offline reconstruction and selection uses the particle-flow (PF) algorithm [42] to reconstruct and identify each individual particle with an optimized combination of information from the subdetectors of CMS. In the e+jets channel, electron candidates are required to satisfy pT > 34 GeV and |η| < 2.1. Electron candidates whose energy deposition in the ECAL is
in the transition region between the barrel and endcap regions of the ECAL are not consid-ered due to less efficient electron reconstruction. Electron candidates must also satisfy several identification criteria [43] to suppress the rate of jets and converted photons that are identi-fied incorrectly as electron candidates. In addition, electron candidates must be isolated. To calculate the isolation, a cone of size∆R = √(∆η)2+ (∆φ)2 = 0.3 is constructed around the electron direction, where φ is the azimuthal angle. The sum of the pT of all PF candidates
within this cone is calculated, excluding the lepton candidate and is corrected for the effects of additional proton-proton collisions within the same or nearby bunch crossings. The relative isolation variable Irelis defined as the ratio of this sum to the electron pT, and is required to be
less than 6%.
In the µ+jets channel, muon candidates are required to satisfy pT > 26 GeV and |η| < 2.4.
Similarly to the electron candidates, muon candidates must satisfy additional identification criteria [44]. Muon candidates must be isolated, satisfying Irel < 15% where Irel is defined as for electrons, but with a cone of size∆R=0.4.
For both electron and muon candidates, the lepton must be associated with the primary in-teraction vertex of the event. The primary inin-teraction vertex is defined as the reconstructed vertex associated with the largest sum of p2T from physics objects that have been defined us-ing information from the trackus-ing detector, includus-ing jets, the associated missus-ing transverse momentum, which was taken as the negative vector sum of the pT of those jets, and charged
leptons.
The trigger, reconstruction and identification efficiencies for both electrons and muons are mea-sured in data, and corrected in simulation to match those seen in data. The efficiencies are calculated using the tag-and-probe method [45] from events containing a Z boson. The total lepton correction factors are between 0.95 and 1.
Jets are clustered from PF candidates with the anti-kTalgorithm [46] implemented in the FAST
-JETpackage [47], with a distance parameter of 0.4. The jet momentum is determined as the
vector sum of the pTof all PF candidates in the jet. A correction is applied to jet energies to take
into account the contribution from additional proton-proton interactions using the charged hadron subtraction method [48]. The measured energy of each jet is corrected for known vari-ations in the jet energy response as a function of the measured jet η and pT. The jet energy
resolution (JER) is corrected in simulation to match that seen in data. Jets are required to satisfy pT >30 GeV and|η| <2.4. Jets closer than∆R=0.4 to identified isolated leptons are removed,
as they are likely to have originated from the lepton itself.
The combined secondary vertex algorithm [49, 50] is used to identify jets originating from a b quark. The threshold of the algorithm is chosen such that the identification efficiency (in simulation) of genuine b quark jets is ≈70%, and the probability to mistag a light quark or gluon jet is ≈1%. The identification efficiency of b quark jets in simulation is corrected to
match that seen in data.
The distribution of the number of additional proton-proton interactions in simulation is cor-rected to match data. Events must contain exactly one high-pT, isolated electron or muon.
Events are vetoed if they contain an additional isolated lepton candidate with pT >15 GeV and
|η| < 2.4. Events must also contain at least four jets, at least two of which are required to be
identified as originating from a b quark.
5 Cross section measurement
As stated in Section 1, the differential tt production cross sections are measured as a function of the kinematic event variables: Njets, HT, ST, pmissT , pTW, p`T and|η`|. The Njets variable is the
total number of jets in the event with pT > 30 GeV and |η| < 2.4. The variable HT is the
scalar sum of the pT of these jets. The quantity pmissT is defined as the magnitude of ~pTmiss,
the transverse projection of the negative vector sum of the momenta of all reconstructed PF candidates in an event. The p`Tand|η`|variables are magnitudes of the transverse momentum
and the pseudorapidity of the lepton in the event, respectively. The variable ST is the sum
of HT, pmissT , and pT`. The variable pWT is the magnitude of the transverse momentum of the
leptonically decaying W boson, which is constructed from~p`Tand~pmiss
T .
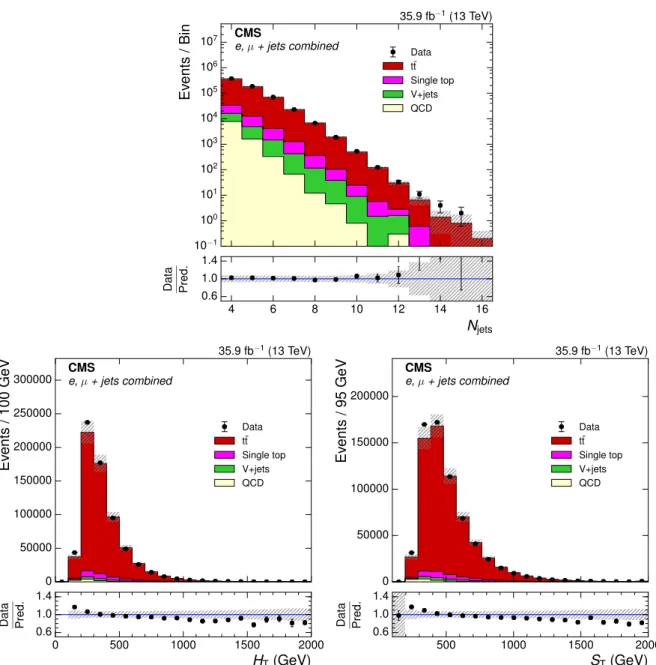
The distributions of these variables measured in data are shown in Figs. 1 and 2, and are com-pared to the sum of signal and background events from simulation. A total of 662 381 events are measured in data, of which 92.1% are predicted from thePOWHEG+PYTHIAsimulation to be tt events. Single top quark production and V+jets production contribute 4.4% and 2.1% to the total number of events, respectively, as estimated from simulation. The component of multijet QCD events is estimated from control regions in the data, and comprises approximately 1.4% of the total number of events. The control regions are designed to obtain data samples that are enriched in QCD multijet events that are kinematically similar to the signal region, but with lit-tle contamination from tt, single top quark, and V+jets events. In the e+jets channel, the control region is obtained by inverting the isolation criterion on electron candidates. In the µ+jets chan-nel, the control region is obtained by requiring muon candidates to satisfy 0.15 < Irel < 0.30.
In the control regions for both channels, the number of b-tagged jets is also required to be ex-actly zero. The contribution of tt, single top quark and V+jets events to the control regions (≈15–20%) is estimated from simulation with all corrections and subtracted from the data. The ratio of the number of multijet QCD events in the control region to that in the signal region (the transfer factor), both predicted from simulation, is then used to scale the normalization of the data control region to obtain the multijet QCD estimate in the signal region. Other sources of background are negligible, and are not considered in this measurement. The level of agreement between the total event count of data and simulation, within 0.2% , indicates that the total cross section is compatible to that stated in Section 3.
Previous measurements [2–8] report that the top quark pT spectrum in data is softer than that
predicted by NLO simulation. This effect can be seen in some of the distributions in Figs. 1 and 2, where distributions correlated with the top quark pT are also softer in data than those
predicted by the simulation.
5.1 Particle level and visible phase space definitions
The results are presented at particle level, i.e. with respect to the stable particles produced in simulation by the event generator, before detector interactions are modeled. The generator-level definitions for the particles and visible phase space are based on the RIVET
frame-10−1 100 101 102 103 104 105 106 107 Ev ents
/Bin CMSe, µ + jets combined
35.9 fb−1(13 TeV) Data t¯t Single top V+jets QCD 4 6 8 10 12 14 16 Njets 0.6 1.0 1.4 Data Pred. 0 50000 100000 150000 200000 250000 300000 Ev ents /100
GeV CMSe, µ + jets combined
35.9 fb−1(13 TeV) Data t¯t Single top V+jets QCD 0 500 1000 1500 2000 HT(GeV) 0.6 1.0 1.4 Data Pred. 0 50000 100000 150000 200000 Ev ents /95
GeV CMSe, µ + jets combined
35.9 fb−1(13 TeV) Data t¯t Single top V+jets QCD 500 1000 1500 2000 ST(GeV) 0.6 1.0 1.4 Data Pred.
Figure 1: The distributions of Njets, HT and ST after full event selection. The tt simulation
is normalized to the NNLO prediction. The ratio of the number of events in data to that in simulation is shown below each of the distributions, with the statistical uncertainty in the data shown by the vertical uncertainty bars. The statistical uncertainty in the number of simulation events and the uncertainties in the modeling in simulation are shown by the hatched band.
0 20000 40000 60000 80000 100000 120000 140000 160000 Ev ents /15
GeV CMSe, µ + jets combined
35.9 fb−1(13 TeV) Data t¯t Single top V+jets QCD 0 100 200 300 400 500 pmiss T (GeV) 0.6 1.0 1.4 Data Pred. 0 50000 100000 150000 200000 250000 300000 Ev ents /54
GeV CMSe, µ + jets combined
35.9 fb−1(13 TeV) Data t¯t Single top V+jets QCD 0 100 200 300 400 500 600 700 800 pW T (GeV) 0.6 1.0 1.4 Data Pred. 0 20000 40000 60000 80000 100000 120000 140000 Ev ents /10
GeV CMSe, µ + jets combined
35.9 fb−1(13 TeV) Data t¯t Single top V+jets QCD 50 100 150 200 250 300 350 p` T(GeV) 0.6 1.0 1.4 Data Pred. 0 50000 100000 150000 Ev ents
/Bin CMSe, µ + jets combined
35.9 fb−1(13 TeV) Data t¯t Single top V+jets QCD 0.0 0.5 1.0 1.5 2.0 |η`| 0.6 1.0 1.4 Data Pred.
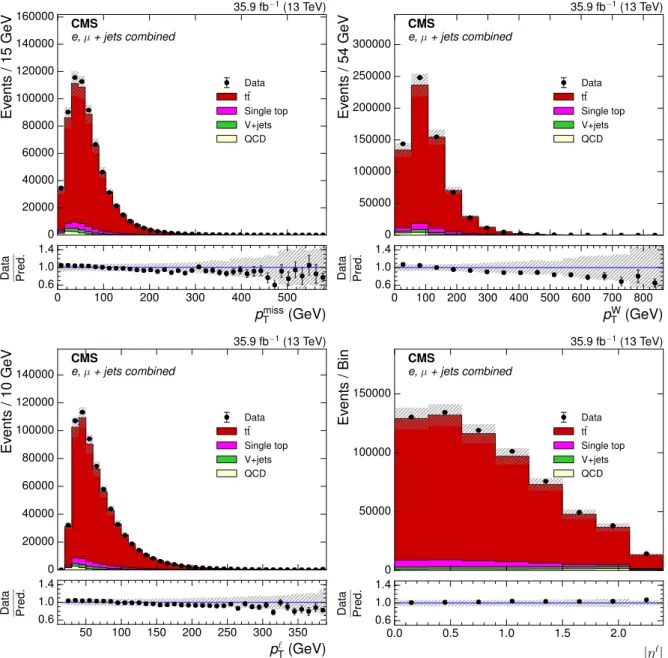
Figure 2: The distributions of pmiss
T , pWT , p
`
Tand|η
`
|after full event selection. The tt simulation is normalized to the NNLO prediction. The ratio of the number of events in data to that in simulation is shown below each of the distributions, with the statistical uncertainty in the data shown by the vertical uncertainty bars. The statistical uncertainty in the number of simulation events and the uncertainties in modeling in simulation are shown by the hatched band.
work [51], following the prescriptions adopted in Ref. [52]. Generated electrons and muons not originating from a hadron or a quark are used to define electrons and muons at particle level. Photons that are near the lepton are assumed to have radiated from it, and are clustered together with the anti-kTalgorithm with a distance parameter of 0.1.
Particle-level jets are constructed by clustering all stable particles, excluding the lepton, with the anti-kTalgorithm using a distance parameter of 0.4. To determine if a particle-level jet
orig-inated from a b quark, b hadrons are included in the clustering of jets, but with the magnitude of the four-momentum of the b hadron scaled to a negligible value. The b hadrons can then be clustered into jets without affecting the kinematic properties of the jet. A jet with a b hadron among its constituents is considered to have originated from a b quark. The particle-level pmissT is calculated from all stable visible particles.
The differential tt production cross sections are measured in a visible phase space, which is chosen to be the same for both e+jets and µ+jets channels, and to closely resemble the criteria used to select events in data. Particle-level objects are used to define the common visible phase space of tt events for both e+jets and µ+jets channels, all within |η| < 2.4, which requires
exactly one electron or muon with pT > 26 GeV, and no additional electrons or muons with
pT > 15 GeV. The event must also contain at least three particle-level jets with pT > 30 GeV,
and one jet with pT>20 GeV. Two of these particle-level jets must also be tagged as originating
from a b quark. The HT, ST, and Njets variables are calculated at the particle level with respect
to all particle-level jets with pT > 20 GeV and |η| < 2.4. This choice of particle-level phase
space is made to obtain the largest possible data sample, and the uncertainty in the resulting extrapolation makes only a small contribution to the uncertainty in the final results.
The yield of tt events for each bin in data is obtained by subtracting the contribution of each background process. The contribution of tt events that satisfy the selection criteria, but do not enter the visible phase space at particle level, is estimated from simulation and also subtracted from the data. This amounts to approximately 7% of all tt events and are predominately those in which one of the jets fails the particle-level jet selection, but passes the reconstructed jet selection because of the resolution of the detector. No selection is applied on the decay channel of the top quarks, so the phase space does not exclusively contain semileptonic (electron or muon) tt events. In particular, there are contributions from events where one top quark decays to a tau lepton and subsequently to an electron or muon, or where both top quarks decay leptonically but one lepton is not within the acceptance.
5.2 Unfolding and cross section calculation
For each kinematic event variable the yield of tt events in each bin is unfolded to correct for the detector acceptance, efficiency, and bin-to-bin migrations stemming from the detector res-olution to obtain the yield of tt events in the visible phase space at the particle level. The bin widths are chosen to give a low level of bin-to-bin migration, and are always greater than the detector resolution.
A response matrix, constructed using thePOWHEG+PYTHIAsample, relates the kinematic event
distributions at reconstruction level to those at particle level. The response matrix also includes efficiency and acceptance corrections. Unfolding is performed by inverting the response ma-trix, based on a least-squares fit with Tikhonov regularization, implemented in the TUNFOLD
software framework [53]. Regularization dampens nonphysical fluctuations in the unfolded tt yields, and the regularization parameter is chosen by minimizing the average global statistical correlation between the bins of each variable. The typical regularization parameters are found to be of order 10−4−10−3, and significantly lower for the|η`|variable.
The yields of tt events are unfolded separately in the e+jets and µ+jets channels and then com-bined after unfolding, giving the total number of tt events at particle level in the visible phase space, Ntt. The normalized differential cross section with respect to each variable, X, can then be calculated using 1 σttvis dσtti dX = 1 ∑jN j tt Ntti ∆Xi, (1)
where σttvisis the total tt production cross section in the visible phase space, σtti is the tt produc-tion cross secproduc-tion in bin i, Ntti(j)is the number of tt events in bin i(j)after unfolding, and∆Xi is the width of bin i. The absolute differential cross section can be calculated as
dσtti dX =
Ntti
L∆Xi, (2)
whereLis the integrated luminosity of the data.
6 Systematic uncertainties
Sources of systematic uncertainties are evaluated and propagated to the final result by recalcu-lating the response matrix with a modified tt simulation and/or by modifying the background predictions.
The uncertainty in the integrated luminosity of the data is estimated to be ±2.5% [54]. The uncertainty in the number of additional inelastic interactions in the same or nearby bunch crossings is estimated by varying the total proton-proton inelastic cross section by±4.6% [55]. This cross section is used in determining the distribution of additional inelastic interactions in data, which is used to correct the simulation.
The uncertainty in the efficiency of the b quark jet identification and mistagging rate in the sim-ulation is taken as the uncertainty in the pT, |η|, and flavor-dependent correction factors [50].
The uncertainties in the lepton trigger, reconstruction, and identification correction factors are similarly propagated to the final results.
The uncertainties in the jet energy scale (JES) and JER are estimated as functions of jet pT and
|η|[48]. The uncertainty in the JES is also propagated into the calculation of pmissT . Additional
uncertainties in the pT of electrons, muons, tau leptons and other unclustered PF candidates,
that are used in the calculation of pmiss
T , are considered and found to be negligible.
The uncertainties in the normalization of the single top quark and V+jets background sources are based on measurements performed in [56–58] and take into account an extrapolation to the current analysis phase space. They are estimated to be±30% and±50% respectively and typically result in a normalization uncertainty that is negligible. The uncertainty in the nor-malization and shape of the multijet QCD background is estimated by using alternative control regions containing conversion electrons in the e+jets channel and muons with Irel > 0.3 in the
µ+jets channel. This effectively varies the total normalization of the multijet QCD background
by up to 60%, and also the shape of the contribution by up to±30% in any one bin, but is found to result in a negligible uncertainty after unfolding, except at large|η`|.
Uncertainties in the top quark mass are estimated by using simulated tt samples where the top quark mass has been varied up and down by 1 GeV, which is comparable to the uncertainty in the measured top quark mass [59].
The uncertainty from the PDF used in the tt simulation is estimated by considering 100 inde-pendent replicas of NNPDF30 nlo as 0118. The RMS of the uncertainties originating from the variation of each replica is taken as the PDF uncertainty. The uncertainty resulting from using the NNPDF30 nlo as 0118 set derived with varied values of αSis combined in quadrature with
the PDF uncertainty.
The uncertainty arising from the mismodeling of the top quark pT spectrum is estimated by
reweighting the pT distribution in simulation to match that measured by the previous
mea-surements [7, 8]. The reweighting varies the yield of simulated tt events in the bins of the measurement by up to 20%, and results in a negligible uncertainty in the measured cross sec-tion.
Several sources of uncertainty for the modeling of the parton shower in the simulated
POWHEG+PYTHIAsample are considered.
The uncertainty originating from the parton shower scale used when simulating the initial-state radiation is estimated by varying the scale up and down by a factor of two. Similarly the uncertainty originating from the scale for final-state radiation, which is constrained by mea-surements made at the LEP collider [60], is estimated by varying the scale up and down by a factor of√2. The renormalization and factorization scales used in the matrix-element calcula-tions are also varied independently by factors of 0.5 and 2. An additional variation is performed where both scales are varied simultaneously by the same factors. The shower scale uncertainty is defined as the envelope of the parton shower scale uncertainties and the matrix-element scale uncertainties.
The systematic uncertainty in matching the matrix-element to the parton shower is determined by varying the parameter hdamp, which regulates the high-pT radiation by damping real
emis-sion generated inPOWHEG, within its uncertainties. The parameter is set to hdamp = 1.58+−0.660.59
multiplied by the mass of the top quark in the CUETP8M2T4 tune [19]. The parameters control-ling the underlying event in the CUETP8M2T4 tune are also varied to estimate the uncertainty in this source [19].
The uncertainty in the modeling of the momentum transfer from b quarks to b hadrons is esti-mated by reweighting the tuned quantity xb = pT(B)/pT(b jet)for each particle-level b-tagged
jet within its uncertainties, where pT(B) is the transverse momentum of the b hadron, and pT(b
jet) is the transverse momentum of the particle-level b-tagged jet. The difference when using an alternative model (the Peterson model [61]) for the fragmentation of b quarks is also included as an additional uncertainty. The energy response of b jets is sensitive to the single-lepton branching fractions of b hadrons, and the uncertainty originating from the choice of branch-ing fractions in the POWHEG+PYTHIA simulation is estimated by reweighting the branching fractions to those reported in Ref. [59].
The effects of any mismodeling of the color reconnection in the simulation are estimated by comparing the cross sections obtained with samples including and excluding the effects of color reconnection on the decay products of the top quarks (Early resonance decays). A com-parison to two samples obtained with alternative models of color reconnection are also in-cluded, one where QCD color rules are considered in the simulation of the color reconnection (QCD-based) [62], and another where gluons can be moved to different color strings during the simulation of the color reconnection (Gluon move) [63].
The statistical uncertainty arising from the finite size of thePOWHEG+PYTHIAsample, which is used to construct the nominal response matrix, is propagated to the final measurement. This uncertainty is negligible.
Each source of systematic uncertainty is summarised for each variable in Table 1, where the minimum and maximum relative uncertainty in the normalized differential cross section (over all bins) are shown. The minimum and maximum of the total relative uncertainty over all bins are also shown. Sources of uncertainties in the calculation of pmiss
T do not affect some
distribu-tions, and are indicated in the table by —. The dominant uncertainty in the measurement of the normalized cross sections comes from the uncertainty in the JES. Other significant uncer-tainties come from the theoretical modeling of tt production in simulation, in particular from the uncertainty in the shower scale for final-state radiation. A similar table for the absolute differential cross section uncertainties is shown in Appendix C. The uncertainty in the JES is also significant in the measurements of the absolute cross sections, however the uncertainty in the final-state radiation scale becomes dominant. The total uncertainty from all sources in the normalized cross section is typically below 5% in each bin, and can be as large as 21%. For the measurements of the absolute cross section, the total uncertainty is typically 10%, and can be as large as 22%.
T able 1: The upper and lower bounds, in %, fr om each sour ce of systematic uncertainty in the normalised dif fer ential cr oss section, over all bins of the measur ement for each variable. The bounds of the total relative uncertainty ar e also shown. Relative uncertainty sour ce ( % ) Njets HT ST p miss T p W T p ` T | η ` | b quark tagging ef ficiency 0.1 – 0.8 0.2 – 1.1 0.2 – 1.5 0.1 – 1.2 0.1 – 1.7 0.1 – 1.9 0.1 – 0.5 Electr on ef ficiency 0.1 – 0.2 0.1 – 0.7 0.1 – 0.9 0.1 – 0.7 0.1 – 1.4 0.3 – 2.1 0.1 – 0.8 Muon ef ficiency 0.1 – 0.3 0.1 – 0.2 0.1 – 0.3 0.1 – 0.2 0.1 – 0.6 0.1 – 1.0 0.1 – 0.1 JER 0.1 – 0.6 0.1 – 0.7 0.2 – 1.8 0.6 – 5.8 0.2 – 2.1 0.1 – 0.2 < 0.1 JES 0.1 – 5.5 2.1 – 13.6 2.1 – 15.9 2.1 – 7.1 0.5 – 4.9 0.1 – 2.0 0.1 – 0.2 Electr on transverse momentum in p miss T — — 0.1 – 0.3 0.1 – 0.9 0.1 – 0.6 — — Muon transverse momentum in p miss T — — 0.1 – 0.9 0.1 – 3.5 0.1 – 0.9 — — T au transverse momentum in p miss T — — 0.1 – 1.4 0.1 – 1.2 0.1 – 1.4 — — Uncluster ed transverse momentum in p miss T — — 0.1 – 1.7 0.2 – 1.9 0.1 – 1.0 — — QCD bkg cr oss section 0.1 – 0.5 0.1 – 1.0 0.1 – 1.7 0.2 – 0.6 0.1 – 0.8 0.1 – 4.5 0.2 – 2.9 QCD bkg shape 0.1 – 0.1 0.1 – 0.7 0.1 – 1.0 0.1 – 0.1 0.1 – 1.5 0.1 – 4.7 0.1 – 1.5 Single top quark cr oss section 0.1 – 0.4 0.1 – 2.1 0.1 – 4.4 0.1 – 4.9 0.1 – 7.1 0.1 – 6.0 < 0.1 V+jets cr oss section 0.1 – 0.3 0.1 – 2.5 0.1 – 3.7 0.1 – 2.0 0.1 – 3.6 0.1 – 5.4 0.1 – 1.5 PDF 0.1 – 0.3 0.1 – 0.3 0.1 – 0.6 0.1 – 0.3 0.1 – 0.4 0.1 – 0.4 < 0.1 Color reconnection (Gluon move) 0.1 – 2.8 0.1 – 4.0 0.1 – 11.7 0.2 – 0.9 0.1 – 1.0 0.2 – 4.8 0.1 – 0.4 Color reconnection (QCD-based) 0.1 – 2.0 0.1 – 4.2 0.1 – 6.6 0.4 – 4.2 0.1 – 3.5 0.1 – 7.6 0.1 – 1.2 Color reconnection (Early resonance decays) 0.2 – 3.9 0.1 – 7.1 0.1 – 4.1 0.1 – 1.6 0.1 – 3.8 0.1 – 5.0 0.1 – 1.0 Fragmentation 0.1 – 0.4 0.1 – 0.5 0.1 – 0.5 0.1 – 0.6 0.1 – 0.6 0.1 – 0.4 < 0.1 hdamp 0.3 – 3.8 0.1 – 3.1 0.2 – 2.9 0.1 – 2.3 0.1 – 2.7 0.1 – 2.8 0.2 – 1.2 T op quark mass 0.2 – 1.0 0.1 – 3.1 0.2 – 3.5 0.1 – 4.0 0.2 – 1.1 0.2 – 4.5 0.1 – 0.6 Peterson fragmentation model 0.1 – 1.3 0.1 – 0.6 0.1 – 0.9 0.1 – 1.1 0.1 – 1.0 0.1 – 1.3 < 0.1 Shower scales 0.4 – 4.3 0.5 – 4.5 0.5 – 4.9 0.2 – 2.4 0.3 – 3.5 0.1 – 4.5 0.1 – 0.7 B hadr on decay semileptonic branching fraction 0.1 – 0.1 0.1 – 0.1 0.1 – 0.1 < 0.1 < 0.1 < 0.1 < 0.1 T op quark pT 0.1 – 0.7 0.1 – 0.9 0.1 – 1.0 0.1 – 0.8 0.1 – 0.9 0.1 – 1.3 < 0.1 Underlying event tune 0.1 – 2.7 0.1 – 5.5 0.2 – 4.4 0.1 – 5.4 0.2 – 2.6 0.2 – 6.1 0.1 – 0.9 Simulated sample size 0.1 – 1.6 0.1 – 1.6 0.1 – 1.9 0.1 – 2.2 0.1 – 1.4 0.1 – 1.7 0.1 – 0.4 Additional interactions 0.1 – 0.4 0.1 – 1.0 0.1 – 1.7 0.1 – 1.5 0.1 – 0.9 0.1 – 1.0 < 0.1 Integrated luminosity < 0.1 < 0.1 < 0.1 < 0.1 < 0.1 < 0.1 < 0.1 T otal 0.6 – 9.6 2.7 – 14.1 2.8 – 17.4 2.9 – 11.7 0.8 – 12.6 0.7 – 13.4 0.7 – 4.4
7 Cross section results
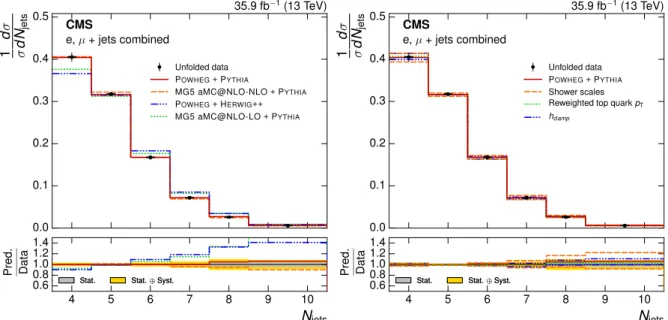
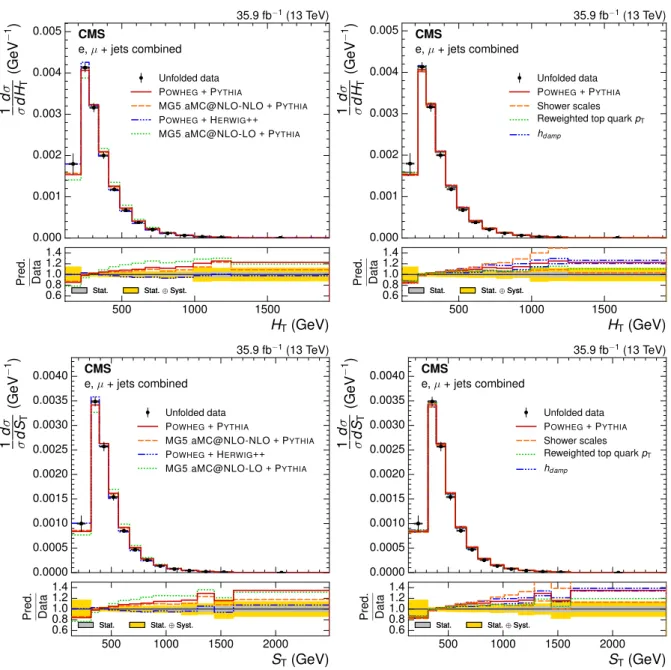
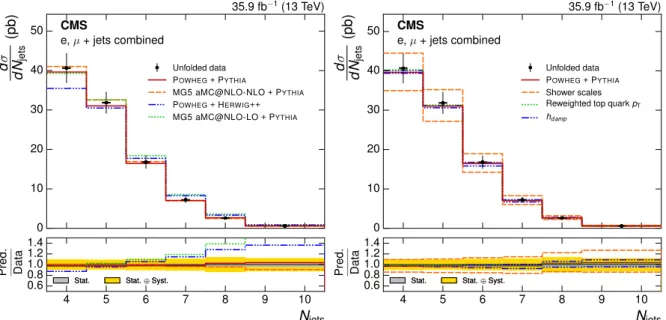
The normalized differential tt production cross section with respect to Njets is shown in Fig. 3,
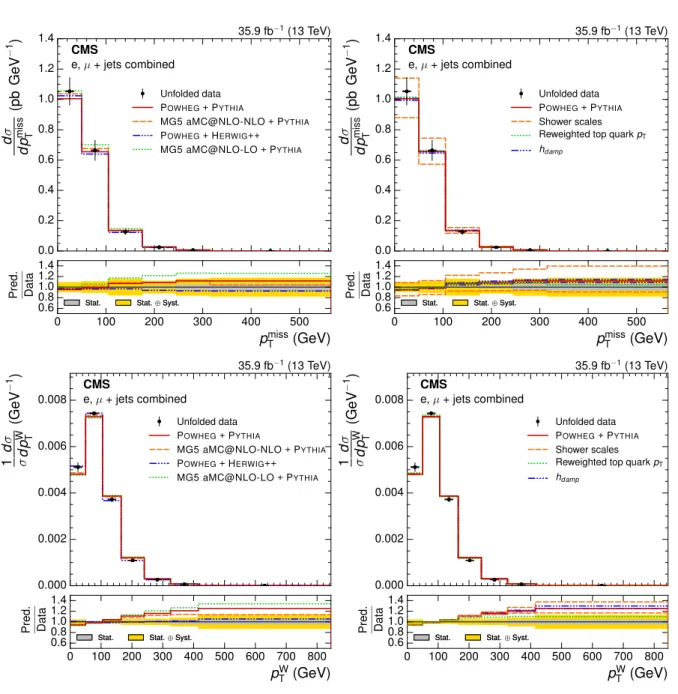
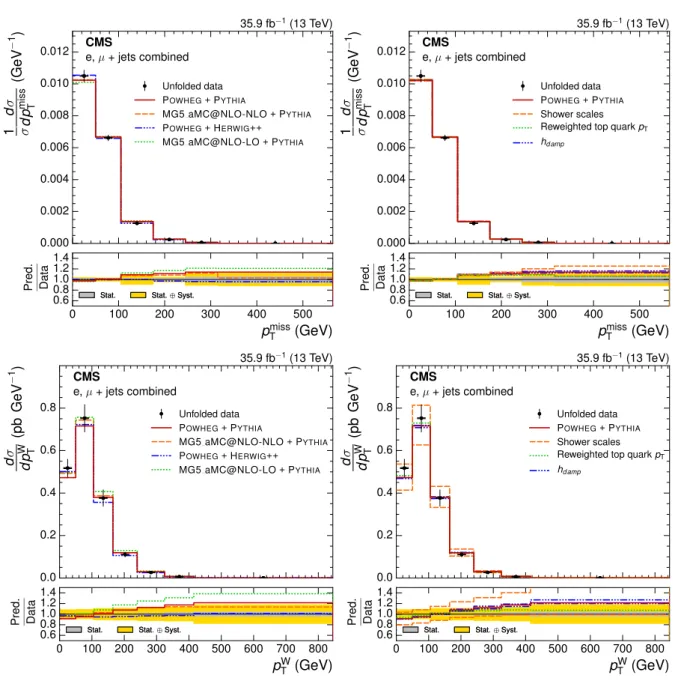
with respect to HT and ST in Fig. 4, with respect to pmissT and pWT in Fig. 5 and with respect
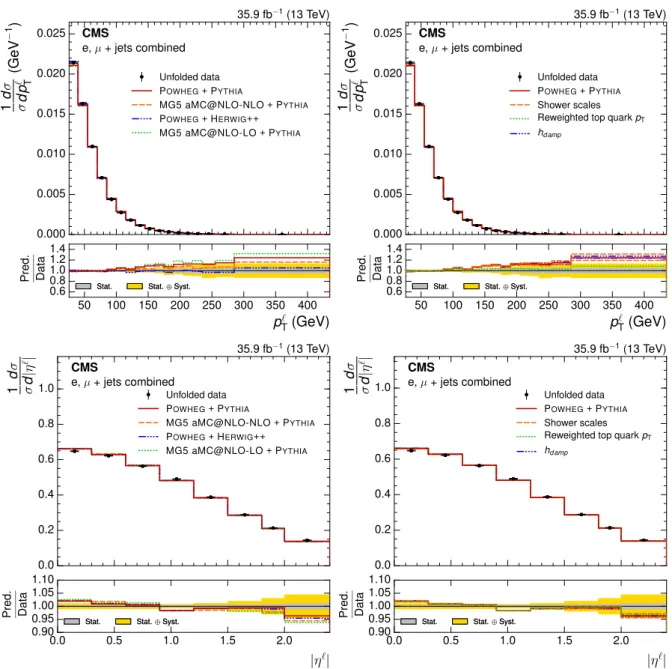
to p`
T and |η`| in Fig. 6. Tabulated results are listed in Appendix A. Measurements of the
absolute differential tt production cross sections are shown in Figs. 7, 8, 9 and 10, and tab-ulated in Appendix B. In each figure, the measured cross section is compared with the pre-dictions from several combinations of matrix-element and parton shower generators, namely
POWHEG+PYTHIA,POWHEG+HERWIG++,MG5 aMC@NLO-NLO, andMG5 aMC@NLO-LO. Each measured cross section is also compared to the POWHEG+PYTHIAgenerator after varying the shower scales and the hdampparameter used in generating the sample within their
uncertain-ties, and also after reweighting the top quark pTas described in Section 6.
The level of agreement between the measured and predicted differential cross sections are de-termined through a χ2 test, where the full covariance matrix, including the correlations be-tween the statistical and systematic uncertainties in each bin of the measurements, is taken into account. The results, including the p-value of each test, are shown in Tables 2 and 3.
The predictions of thePOWHEG+PYTHIAmodel are consistent with data for the Njets, pmissT , ST,
and p`Tdistributions. In particular, the prediction of the Njetsdistribution has a χ2per degree of
freedom of 2/5 for the normalized and 2.2/6 for the absolute cross section measurement. The jet multiplicity from previous 8 TeV measurements was used in deriving the CUETP8M2T4 tune [19], and this confirms that the tune continues to accurately describe the jet multiplicity on a larger data set with a higher √s. On the other hand, tensions are observed for the HT,
pWT and|η`|variables. An additional χ2calculation between thePOWHEG+PYTHIAmodel and unfolded data is performed, where the theoretical uncertainties within the generator, described in Section 6, are included, as well as in the unfolded data. The correlations between the uncer-tainties in the prediction of the generator and the unfolded data are taken into account. The result of this test demonstrates that the theoretical uncertainties in thePOWHEG+PYTHIAmodel
cover the differences between thePOWHEG+PYTHIAmodel and the unfolded data in the phase
space analyzed.
The POWHEG+HERWIG++ and MG5 aMC@NLO-NLO models are broadly consistent with the
unfolded data, even without including the theoretical uncertainties in the χ2test, with the ex-ception of NjetsinPOWHEG+HERWIG++ and|η`|inMG5 aMC@NLO-NLO. Without these uncer-tainties, theMG5 aMC@NLO-LOmodel is not compatible with any kinematic event distribution
in the unfolded data presented here.
The effect of the regularization in the unfolding procedure is investigated by unfolding with-out regularization, which typically results in a small change in the χ2. When unfolding without regularization, the largest changes in χ2for the normalized cross sections are for the HT
dis-tribution with theMG5 aMC@NLO-NLOmodel, where the χ2 per degree of freedom increases from 11/12 to 12/12, and for the pmissT distribution in thePOWHEG+PYTHIA model (including the model theoretical uncertainties), where the χ2per degree of freedom decreases from 2.9/5 to 2.1/5. The effects on the χ2 for all other variables and models are small. The χ2 does not
change for the p`
Table 2: Results of a goodness-of-fit test between the normalized cross sections in data and several models, with values given as χ2/number of degrees of freedom (ndf)
POWHEG+PYTHIA With MC theoretical uncertainties
χ2/ndf p-value χ2/ndf p-value Njets 2 / 5 0.85 1.5 / 5 0.91 HT 26 / 12 <0.01 4.8 / 12 0.97 ST 22 / 12 0.04 4.2 / 12 0.98 pmissT 11 / 5 0.06 2.9 / 5 0.72 pWT 16 / 6 0.01 2.5 / 6 0.87 p`T 24 / 16 0.09 14 / 16 0.63 |η`| 19 / 7 <0.01 15 / 7 0.04
POWHEG+HERWIG++ MG5 aMC@NLO-NLO+PYTHIA MG5 aMC@NLO-LO+PYTHIA
χ2/ndf p-value χ2/ndf p-value χ2/ndf p-value
Njets 38 / 5 <0.01 9.5 / 5 0.09 78 / 5 <0.01 HT 23 / 12 0.03 11 / 12 0.52 160 / 12 <0.01 ST 21 / 12 0.04 11 / 12 0.57 110 / 12 <0.01 pmissT 1.3 / 5 0.93 5.9 / 5 0.31 23 / 5 <0.01 pWT 0.81 / 6 0.99 8.9 / 6 0.18 30 / 6 <0.01 p`T 11 / 16 0.82 16 / 16 0.44 37 / 16 <0.01 |η`| 19 / 7 <0.01 24 / 7 <0.01 30 / 7 <0.01
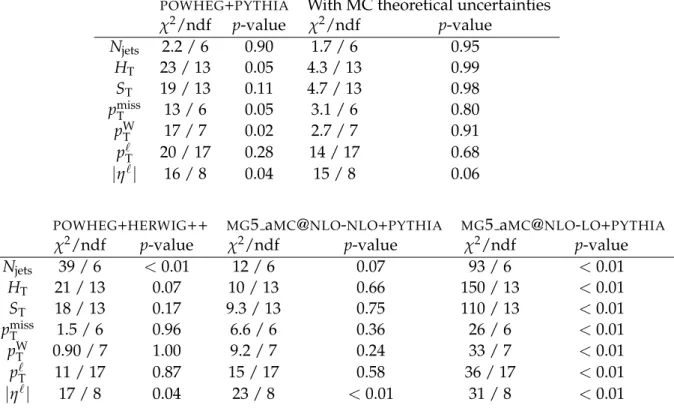
Table 3: Results of a goodness-of-fit test between the absolute cross sections in data and several models, with values given as χ2/number of degrees of freedom (ndf)
POWHEG+PYTHIA With MC theoretical uncertainties
χ2/ndf p-value χ2/ndf p-value Njets 2.2 / 6 0.90 1.7 / 6 0.95 HT 23 / 13 0.05 4.3 / 13 0.99 ST 19 / 13 0.11 4.7 / 13 0.98 pmissT 13 / 6 0.05 3.1 / 6 0.80 pWT 17 / 7 0.02 2.7 / 7 0.91 p`T 20 / 17 0.28 14 / 17 0.68 |η`| 16 / 8 0.04 15 / 8 0.06
POWHEG+HERWIG++ MG5 aMC@NLO-NLO+PYTHIA MG5 aMC@NLO-LO+PYTHIA
χ2/ndf p-value χ2/ndf p-value χ2/ndf p-value
Njets 39 / 6 <0.01 12 / 6 0.07 93 / 6 <0.01 HT 21 / 13 0.07 10 / 13 0.66 150 / 13 <0.01 ST 18 / 13 0.17 9.3 / 13 0.75 110 / 13 <0.01 pmissT 1.5 / 6 0.96 6.6 / 6 0.36 26 / 6 <0.01 pWT 0.90 / 7 1.00 9.2 / 7 0.24 33 / 7 <0.01 p`T 11 / 17 0.87 15 / 17 0.58 36 / 17 <0.01 |η`| 17 / 8 0.04 23 / 8 <0.01 31 / 8 <0.01
0.0 0.1 0.2 0.3 0.4 0.5 1 σ d σ d
Njets CMSe, µ + jets combined
35.9 fb−1(13 TeV) Unfolded data POWHEG+ PYTHIA MG5 aMC@NLO-NLO + PYTHIA POWHEG+ HERWIG++ MG5 aMC@NLO-LO + PYTHIA 4 5 6 7 8 9 10 Njets 0.6 0.8 1.0 1.2 1.4 Pred. Data
Stat. Stat. ⊕ Syst. Stat. Stat. ⊕ Syst.
0.0 0.1 0.2 0.3 0.4 0.5 1 σ d σ d
Njets CMSe, µ + jets combined
35.9 fb−1(13 TeV)
Unfolded data
POWHEG+ PYTHIA
Shower scales
Reweighted top quark pT
hdamp 4 5 6 7 8 9 10 Njets 0.6 0.8 1.0 1.2 1.4 Pred. Data
Stat. Stat. ⊕ Syst. Stat. Stat. ⊕ Syst.
Figure 3: Normalized Njets differential tt cross section, compared to different tt simulations in
the left plot, and compared to thePOWHEG+PYTHIAsimulation after varying the shower scales, and hdampparameter, within their uncertainties, in the right plot. The vertical bars on the data
represent the statistical and systematic uncertainties added in quadrature. The bottom panels show the ratio of the predictions to the data.
0.000 0.001 0.002 0.003 0.004 0.005 1 σ d σ d HT (GeV − 1 ) CMS e, µ + jets combined 35.9 fb−1(13 TeV) Unfolded data POWHEG+ PYTHIA MG5 aMC@NLO-NLO + PYTHIA POWHEG+ HERWIG++ MG5 aMC@NLO-LO + PYTHIA 500 1000 1500 HT(GeV) 0.6 0.8 1.0 1.2 1.4 Pred. Data
Stat. Stat. ⊕ Syst. Stat. Stat. ⊕ Syst.
0.000 0.001 0.002 0.003 0.004 0.005 1 σ d σ d HT (GeV − 1 ) CMS e, µ + jets combined 35.9 fb−1(13 TeV) Unfolded data POWHEG+ PYTHIA Shower scales Reweighted top quark pT
hdamp 500 1000 1500 HT(GeV) 0.6 0.8 1.0 1.2 1.4 Pred. Data
Stat. Stat. ⊕ Syst. Stat. Stat. ⊕ Syst.
0.0000 0.0005 0.0010 0.0015 0.0020 0.0025 0.0030 0.0035 0.0040 1 σ d σ d ST (GeV − 1 ) CMS e, µ + jets combined 35.9 fb−1(13 TeV) Unfolded data POWHEG+ PYTHIA MG5 aMC@NLO-NLO + PYTHIA POWHEG+ HERWIG++ MG5 aMC@NLO-LO + PYTHIA 500 1000 1500 2000 ST(GeV) 0.6 0.8 1.0 1.2 1.4 Pred. Data
Stat. Stat. ⊕ Syst. Stat. Stat. ⊕ Syst.
0.0000 0.0005 0.0010 0.0015 0.0020 0.0025 0.0030 0.0035 0.0040 1 σ d σ d ST (GeV − 1 ) CMS e, µ + jets combined 35.9 fb−1(13 TeV) Unfolded data POWHEG+ PYTHIA Shower scales Reweighted top quark pT
hdamp 500 1000 1500 2000 ST(GeV) 0.6 0.8 1.0 1.2 1.4 Pred. Data
Stat. Stat. ⊕ Syst. Stat. Stat. ⊕ Syst.
Figure 4: Normalized HT (upper) and ST (lower) differential tt cross sections, compared to
different tt simulations in the left plots, and compared to the POWHEG+PYTHIA simulation
after varying the shower scales, and hdamp parameter, within their uncertainties, in the right plots. The vertical bars on the data represent the statistical and systematic uncertainties added in quadrature. The bottom panels show the ratio of the predictions to the data.
0.0 0.2 0.4 0.6 0.8 1.0 1.2 1.4 d σ d p miss T (pb GeV − 1 ) CMS e, µ + jets combined 35.9 fb−1(13 TeV) Unfolded data POWHEG+ PYTHIA MG5 aMC@NLO-NLO + PYTHIA POWHEG+ HERWIG++ MG5 aMC@NLO-LO + PYTHIA 0 100 200 300 400 500 pmiss T (GeV) 0.6 0.8 1.0 1.2 1.4 Pred. Data
Stat. Stat. ⊕ Syst. Stat. Stat. ⊕ Syst.
0.0 0.2 0.4 0.6 0.8 1.0 1.2 1.4 d σ d p miss T (pb GeV − 1 ) CMS e, µ + jets combined 35.9 fb−1(13 TeV) Unfolded data POWHEG+ PYTHIA Shower scales Reweighted top quark pT
hdamp 0 100 200 300 400 500 pmiss T (GeV) 0.6 0.8 1.0 1.2 1.4 Pred. Data
Stat. Stat. ⊕ Syst. Stat. Stat. ⊕ Syst.
0.000 0.002 0.004 0.006 0.008 1 σ d σ d p W T (GeV − 1 ) CMS e, µ + jets combined 35.9 fb−1(13 TeV) Unfolded data POWHEG+ PYTHIA MG5 aMC@NLO-NLO + PYTHIA POWHEG+ HERWIG++ MG5 aMC@NLO-LO + PYTHIA 0 100 200 300 400 500 600 700 800 pW T (GeV) 0.6 0.8 1.0 1.2 1.4 Pred. Data
Stat. Stat. ⊕ Syst. Stat. Stat. ⊕ Syst.
0.000 0.002 0.004 0.006 0.008 1 σ d σ d p W T (GeV − 1 ) CMS e, µ + jets combined 35.9 fb−1(13 TeV) Unfolded data POWHEG+ PYTHIA Shower scales Reweighted top quark pT
hdamp 0 100 200 300 400 500 600 700 800 pW T (GeV) 0.6 0.8 1.0 1.2 1.4 Pred. Data
Stat. Stat. ⊕ Syst. Stat. Stat. ⊕ Syst.
Figure 5: Normalized pmissT (upper) and pWT (lower) differential tt cross sections, compared to different tt simulations in the left plots, and compared to thePOWHEG+PYTHIAsimulation after
varying the shower scales, and hdamp parameter, within their uncertainties, in the right plots. The vertical bars on the data represent the statistical and systematic uncertainties added in quadrature. The bottom panels show the ratio of the predictions to the data.
0.000 0.005 0.010 0.015 0.020 0.025 1 σ d σ d p ` T (GeV − 1 ) CMS e, µ + jets combined 35.9 fb−1(13 TeV) Unfolded data POWHEG+ PYTHIA MG5 aMC@NLO-NLO + PYTHIA POWHEG+ HERWIG++ MG5 aMC@NLO-LO + PYTHIA 50 100 150 200 250 300 350 400 p` T(GeV) 0.6 0.8 1.0 1.2 1.4 Pred. Data
Stat. Stat. ⊕ Syst. Stat. Stat. ⊕ Syst.
0.000 0.005 0.010 0.015 0.020 0.025 1 σ d σ d p ` T (GeV − 1 ) CMS e, µ + jets combined 35.9 fb−1(13 TeV) Unfolded data POWHEG+ PYTHIA Shower scales Reweighted top quark pT
hdamp 50 100 150 200 250 300 350 400 p` T(GeV) 0.6 0.8 1.0 1.2 1.4 Pred. Data
Stat. Stat. ⊕ Syst. Stat. Stat. ⊕ Syst.
0.0 0.2 0.4 0.6 0.8 1.0 1 σ d σ d| η `| CMS e, µ + jets combined 35.9 fb−1(13 TeV) Unfolded data POWHEG+ PYTHIA MG5 aMC@NLO-NLO + PYTHIA POWHEG+ HERWIG++ MG5 aMC@NLO-LO + PYTHIA 0.0 0.5 1.0 1.5 2.0 |η`| 0.90 0.95 1.00 1.05 1.10 Pred. Data
Stat. Stat. ⊕ Syst. Stat. Stat. ⊕ Syst.
0.0 0.2 0.4 0.6 0.8 1.0 1 σ d σ d| η `| CMS e, µ + jets combined 35.9 fb−1(13 TeV) Unfolded data POWHEG+ PYTHIA Shower scales Reweighted top quark pT
hdamp 0.0 0.5 1.0 1.5 2.0 |η`| 0.90 0.95 1.00 1.05 1.10 Pred. Data
Stat. Stat. ⊕ Syst. Stat. Stat. ⊕ Syst.
Figure 6: Normalized pT` (upper) and |η`| (lower) differential tt cross sections, compared to
different tt simulations in the left plots, and compared to the POWHEG+PYTHIA simulation
after varying the shower scales, and hdamp parameter, within their uncertainties, in the right
plots. The vertical bars on the data represent the statistical and systematic uncertainties added in quadrature. The bottom panels show the ratio of the predictions to the data.
0 10 20 30 40 50 d σ d Njets (pb) CMSe, µ + jets combined 35.9 fb−1(13 TeV) Unfolded data POWHEG+ PYTHIA MG5 aMC@NLO-NLO + PYTHIA POWHEG+ HERWIG++ MG5 aMC@NLO-LO + PYTHIA 4 5 6 7 8 9 10 Njets 0.6 0.8 1.0 1.2 1.4 Pred. Data
Stat. Stat. ⊕ Syst. Stat. Stat. ⊕ Syst.
0 10 20 30 40 50 d σ d Njets (pb) CMSe, µ + jets combined 35.9 fb−1(13 TeV) Unfolded data POWHEG+ PYTHIA Shower scales
Reweighted top quark pT
hdamp 4 5 6 7 8 9 10 Njets 0.6 0.8 1.0 1.2 1.4 Pred. Data
Stat. Stat. ⊕ Syst. Stat. Stat. ⊕ Syst.
Figure 7: Absolute Njetsdifferential tt cross section, compared to different tt simulations in the
left plot, and compared to the POWHEG+PYTHIA simulation after varying the shower scales, and hdampparameter, within their uncertainties, in the right plot. The vertical bars on the data
represent the statistical and systematic uncertainties added in quadrature. The bottom panels show the ratio of the predictions to the data.
0.0 0.1 0.2 0.3 0.4 0.5 d σ d HT (pb GeV − 1 ) CMS e, µ + jets combined 35.9 fb−1(13 TeV) Unfolded data POWHEG+ PYTHIA MG5 aMC@NLO-NLO + PYTHIA POWHEG+ HERWIG++ MG5 aMC@NLO-LO + PYTHIA 500 1000 1500 HT(GeV) 0.6 0.8 1.0 1.2 1.4 Pred. Data
Stat. Stat. ⊕ Syst. Stat. Stat. ⊕ Syst.
0.0 0.1 0.2 0.3 0.4 0.5 d σ d HT (pb GeV − 1 ) CMS e, µ + jets combined 35.9 fb−1(13 TeV) Unfolded data POWHEG+ PYTHIA Shower scales Reweighted top quark pT
hdamp 500 1000 1500 HT(GeV) 0.6 0.8 1.0 1.2 1.4 Pred. Data
Stat. Stat. ⊕ Syst. Stat. Stat. ⊕ Syst.
0.0 0.1 0.2 0.3 0.4 d σ d ST (pb GeV − 1 ) CMS e, µ + jets combined 35.9 fb−1(13 TeV) Unfolded data POWHEG+ PYTHIA MG5 aMC@NLO-NLO + PYTHIA POWHEG+ HERWIG++ MG5 aMC@NLO-LO + PYTHIA 500 1000 1500 2000 ST(GeV) 0.6 0.8 1.0 1.2 1.4 Pred. Data
Stat. Stat. ⊕ Syst. Stat. Stat. ⊕ Syst.
0.0 0.1 0.2 0.3 0.4 d σ d ST (pb GeV − 1 ) CMS e, µ + jets combined 35.9 fb−1(13 TeV) Unfolded data POWHEG+ PYTHIA Shower scales Reweighted top quark pT
hdamp 500 1000 1500 2000 ST(GeV) 0.6 0.8 1.0 1.2 1.4 Pred. Data
Stat. Stat. ⊕ Syst. Stat. Stat. ⊕ Syst.
Figure 8: Absolute HT (upper) and ST (lower) differential tt cross sections, compared to
dif-ferent tt simulations in the left plots, and compared to thePOWHEG+PYTHIA simulation after
varying the shower scales, and hdamp parameter, within their uncertainties, in the right plots. The vertical bars on the data represent the statistical and systematic uncertainties added in quadrature. The bottom panels show the ratio of the predictions to the data.
0.000 0.002 0.004 0.006 0.008 0.010 0.012 1 σ d σ d p miss T (GeV − 1 ) CMS e, µ + jets combined 35.9 fb−1(13 TeV) Unfolded data POWHEG+ PYTHIA MG5 aMC@NLO-NLO + PYTHIA POWHEG+ HERWIG++ MG5 aMC@NLO-LO + PYTHIA 0 100 200 300 400 500 pmiss T (GeV) 0.6 0.8 1.0 1.2 1.4 Pred. Data
Stat. Stat. ⊕ Syst. Stat. Stat. ⊕ Syst.
0.000 0.002 0.004 0.006 0.008 0.010 0.012 1 σ d σ d p miss T (GeV − 1 ) CMS e, µ + jets combined 35.9 fb−1(13 TeV) Unfolded data POWHEG+ PYTHIA Shower scales Reweighted top quark pT
hdamp 0 100 200 300 400 500 pmiss T (GeV) 0.6 0.8 1.0 1.2 1.4 Pred. Data
Stat. Stat. ⊕ Syst. Stat. Stat. ⊕ Syst.
0.0 0.2 0.4 0.6 0.8 d σ d p W T (pb GeV − 1 ) CMS e, µ + jets combined 35.9 fb−1(13 TeV) Unfolded data POWHEG+ PYTHIA MG5 aMC@NLO-NLO + PYTHIA POWHEG+ HERWIG++ MG5 aMC@NLO-LO + PYTHIA 0 100 200 300 400 500 600 700 800 pW T (GeV) 0.6 0.8 1.0 1.2 1.4 Pred. Data
Stat. Stat. ⊕ Syst. Stat. Stat. ⊕ Syst.
0.0 0.2 0.4 0.6 0.8 d σ d p W T (pb GeV − 1 ) CMS e, µ + jets combined 35.9 fb−1(13 TeV) Unfolded data POWHEG+ PYTHIA Shower scales Reweighted top quark pT
hdamp 0 100 200 300 400 500 600 700 800 pW T (GeV) 0.6 0.8 1.0 1.2 1.4 Pred. Data
Stat. Stat. ⊕ Syst. Stat. Stat. ⊕ Syst.
Figure 9: Absolute pmissT (upper) and pWT (lower) differential tt cross sections, compared to different tt simulations in the left plots, and compared to the POWHEG+PYTHIA simulation
after varying the shower scales, and hdamp parameter, within their uncertainties, in the right plots. The vertical bars on the data represent the statistical and systematic uncertainties added in quadrature. The bottom panels show the ratio of the predictions to the data.
0.0 0.5 1.0 1.5 2.0 2.5 d σ d p ` T (pb GeV − 1 ) CMS e, µ + jets combined 35.9 fb−1(13 TeV) Unfolded data POWHEG+ PYTHIA MG5 aMC@NLO-NLO + PYTHIA POWHEG+ HERWIG++ MG5 aMC@NLO-LO + PYTHIA 50 100 150 200 250 300 350 400 p` T(GeV) 0.6 0.8 1.0 1.2 1.4 Pred. Data
Stat. Stat. ⊕ Syst. Stat. Stat. ⊕ Syst.
0.0 0.5 1.0 1.5 2.0 2.5 d σ d p ` T (pb GeV − 1 ) CMS e, µ + jets combined 35.9 fb−1(13 TeV) Unfolded data POWHEG+ PYTHIA Shower scales Reweighted top quark pT
hdamp 50 100 150 200 250 300 350 400 p` T(GeV) 0.6 0.8 1.0 1.2 1.4 Pred. Data
Stat. Stat. ⊕ Syst. Stat. Stat. ⊕ Syst.
0 20 40 60 80 100 120 d σ d| η `| (pb) CMSe, µ + jets combined 35.9 fb−1(13 TeV) Unfolded data POWHEG+ PYTHIA MG5 aMC@NLO-NLO + PYTHIA POWHEG+ HERWIG++ MG5 aMC@NLO-LO + PYTHIA 0.0 0.5 1.0 1.5 2.0 |η`| 0.8 0.9 1.0 1.1 1.2 Pred. Data
Stat. Stat. ⊕ Syst. Stat. Stat. ⊕ Syst.
0 20 40 60 80 100 120 d σ d| η `| (pb) CMSe, µ + jets combined 35.9 fb−1(13 TeV) Unfolded data POWHEG+ PYTHIA Shower scales Reweighted top quark pT
hdamp 0.0 0.5 1.0 1.5 2.0 |η`| 0.8 0.9 1.0 1.1 1.2 Pred. Data
Stat. Stat. ⊕ Syst. Stat. Stat. ⊕ Syst.
Figure 10: Absolute p`T (upper) and|η`|(lower) differential tt cross sections, compared to
dif-ferent tt simulations in the left plots, and compared to thePOWHEG+PYTHIA simulation after
varying the shower scales, and hdamp parameter, within their uncertainties, in the right plots.
The vertical bars on the data represent the statistical and systematic uncertainties added in quadrature. The bottom panels show the ratio of the predictions to the data.
8 Summary
Normalized and absolute differential tt production cross sections with respect to several kine-matic event variables are measured at the particle level in a visible phase space region. The results are based on proton-proton collision data at √s = 13 TeV, collected by the CMS ex-periment with an integrated luminosity of 35.9 fb−1. The total cross section is observed to be consistent with previous results and next-to-next-to-leading-order calculations, and the differential measurements are compared to several tt production models: POWHEG+PYTHIA,
POWHEG+HERWIG++,MG5 aMC@NLO-LO, andMG5 aMC@NLO-NLO.
ThePOWHEG+PYTHIAsimulation is found to be generally consistent with the data, with
resid-ual differences covered by theoretical uncertainties. The jet multiplicity distribution is partic-ularly well-modeled, having been tuned on LHC 8 TeV data. The POWHEG+HERWIG++ and
MG5 aMC@NLO-NLO models are shown to be consistent with data for most kinematic event variables, while theMG5 aMC@NLO-LOmodel does not provide an accurate description of any variable measured in the data.
It is expected that the results presented here will be useful for tuning tt generators and models in the future. To facilitate this, the measurements presented here have been implemented in the RIVET framework and will be available to the wider community.
Acknowledgments
We congratulate our colleagues in the CERN accelerator departments for the excellent perfor-mance of the LHC and thank the technical and administrative staffs at CERN and at other CMS institutes for their contributions to the success of the CMS effort. In addition, we grate-fully acknowledge the computing centers and personnel of the Worldwide LHC Computing Grid for delivering so effectively the computing infrastructure essential to our analyses. Fi-nally, we acknowledge the enduring support for the construction and operation of the LHC and the CMS detector provided by the following funding agencies: BMWFW and FWF (Aus-tria); FNRS and FWO (Belgium); CNPq, CAPES, FAPERJ, and FAPESP (Brazil); MES (Bulgaria); CERN; CAS, MoST, and NSFC (China); COLCIENCIAS (Colombia); MSES and CSF (Croatia); RPF (Cyprus); SENESCYT (Ecuador); MoER, ERC IUT, and ERDF (Estonia); Academy of Fin-land, MEC, and HIP (Finland); CEA and CNRS/IN2P3 (France); BMBF, DFG, and HGF (Ger-many); GSRT (Greece); OTKA and NIH (Hungary); DAE and DST (India); IPM (Iran); SFI (Ireland); INFN (Italy); MSIP and NRF (Republic of Korea); LAS (Lithuania); MOE and UM (Malaysia); BUAP, CINVESTAV, CONACYT, LNS, SEP, and UASLP-FAI (Mexico); MBIE (New Zealand); PAEC (Pakistan); MSHE and NSC (Poland); FCT (Portugal); JINR (Dubna); MON, RosAtom, RAS, RFBR and RAEP (Russia); MESTD (Serbia); SEIDI, CPAN, PCTI and FEDER (Spain); Swiss Funding Agencies (Switzerland); MST (Taipei); ThEPCenter, IPST, STAR, and NSTDA (Thailand); TUBITAK and TAEK (Turkey); NASU and SFFR (Ukraine); STFC (United Kingdom); DOE and NSF (USA).
Individuals have received support from the Marie-Curie program and the European Research Council and Horizon 2020 Grant, contract No. 675440 (European Union); the Leventis Foun-dation; the A. P. Sloan FounFoun-dation; the Alexander von Humboldt FounFoun-dation; the Belgian Federal Science Policy Office; the Fonds pour la Formation `a la Recherche dans l’Industrie et dans l’Agriculture (FRIA-Belgium); the Agentschap voor Innovatie door Wetenschap en Technologie (IWT-Belgium); the F.R.S.-FNRS and FWO (Belgium) under the ”Excellence of Sci-ence - EOS” - be.h project n. 30820817; the Ministry of Education, Youth and Sports (MEYS) of the Czech Republic; the Council of Science and Industrial Research, India; the HOMING
PLUS program of the Foundation for Polish Science, cofinanced from European Union, Re-gional Development Fund, the Mobility Plus program of the Ministry of Science and Higher Education, the National Science Center (Poland), contracts Harmonia 2014/14/M/ST2/00428, Opus 2014/13/B/ST2/02543, 2014/15/B/ST2/03998, and 2015/19/B/ST2/02861, Sonata-bis 2012/07/E/ST2/01406; the National Priorities Research Program by Qatar National Research Fund; the Programa Severo Ochoa del Principado de Asturias; the Thalis and Aristeia programs cofinanced by EU-ESF and the Greek NSRF; the Rachadapisek Sompot Fund for Postdoctoral Fellowship, Chulalongkorn University and the Chulalongkorn Academic into Its 2nd Century Project Advancement Project (Thailand); the Welch Foundation, contract C-1845; and the We-ston Havens Foundation (USA).
A Tabulated normalized differential tt production cross sections
Table 4: Results of the normalised differential cross sections with relative uncertainties in the combined channel with respect to Njets.
Njets dσ1 dNdσjets Stat. unc. Syst. unc.
(%) (%) 3.5–4.5 0.405 0.27 2.6 4.5–5.5 0.318 0.27 0.65 5.5–6.5 0.168 0.47 3.0 6.5–7.5 7.19×10⁻² 1.0 5.3 7.5–8.5 2.60×10⁻² 3.0 9.6 8.5–10.5 5.89×10⁻³ 3.9 7.8
Table 5: Results of the normalised differential cross sections with relative uncertainties in the combined channel with respect to HT.
HT dσ1 dHdσT Stat. unc. Syst. unc.
(GeV) (GeV−1) (%) (%) 110–220 1.80×10⁻³ 0.54 14 220–275 4.13×10⁻³ 0.37 2.7 275–340 3.16×10⁻³ 0.34 3.5 340–410 2.00×10⁻³ 0.49 4.1 410–485 1.18×10⁻³ 0.69 4.2 485–570 6.73×10⁻⁴ 0.89 4.9 570–660 3.75×10⁻⁴ 1.2 5.5 660–760 2.05×10⁻⁴ 1.5 5.2 760–870 1.15×10⁻⁴ 1.9 7.2 870–990 6.23×10⁻⁵ 2.5 5.6 990–1115 3.28×10⁻⁵ 3.6 13 1115–1250 1.79×10⁻⁵ 4.5 12 1250–1925 4.78×10⁻⁶ 3.3 12
Table 6: Results of the normalised differential cross sections with relative uncertainties in the combined channel with respect to ST.
ST dσ1 dSdσT Stat. unc. Syst. unc.
(GeV) (GeV−1) (%) (%) 136–315 9.99×10⁻⁴ 0.66 17 315–390 3.49×10⁻³ 0.37 2.8 390–475 2.57×10⁻³ 0.32 3.7 475–565 1.54×10⁻³ 0.49 4.6 565–665 8.52×10⁻⁴ 0.71 5.1 665–770 4.68×10⁻⁴ 1.0 5.5 770–885 2.54×10⁻⁴ 1.3 5.4 885–1010 1.34×10⁻⁴ 1.8 6.4 1010–1140 7.36×10⁻⁵ 2.5 6.1 1140–1285 3.98×10⁻⁵ 3.2 11 1285–1440 1.96×10⁻⁵ 4.6 9.9 1440–1615 1.16×10⁻⁵ 5.3 17 1615–2490 2.35×10⁻⁶ 4.6 14
Table 7: Results of the normalised differential cross sections with relative uncertainties in the combined channel with respect to pmissT .
pmiss
T dσ1 dpdσmiss
T Stat. unc. Syst. unc.
(GeV) (GeV−1) (%) (%) 0–50 1.05×10⁻² 0.16 3.7 50–105 6.62×10⁻³ 0.24 2.9 105–175 1.26×10⁻³ 0.75 9.1 175–245 2.43×10⁻⁴ 2.0 4.4 245–315 5.93×10⁻⁵ 4.5 11 315–565 7.63×10⁻⁶ 5.8 12
Table 8: Results of the normalised differential cross sections with relative uncertainties in the combined channel with respect to pWT .
pW
T dσ1 dpdσW
T
Stat. unc. Syst. unc.
(GeV) (GeV−1) (%) (%) 0–50 5.12×10⁻³ 0.36 3.9 50–105 7.44×10⁻³ 0.22 0.81 105–165 3.72×10⁻³ 0.37 3.2 165–240 1.09×10⁻³ 0.69 4.8 240–325 2.59×10⁻⁴ 1.4 5.4 325–415 6.32×10⁻⁵ 2.8 7.7 415–845 5.47×10⁻⁶ 4.1 13
Table 9: Results of the normalised differential cross sections with relative uncertainties in the combined channel with respect to p`T.
p`T dσ1 dpdσ` T
Stat. unc. Syst. unc.
(GeV) (GeV−1) (%) (%) 26–40 2.14×10⁻² 0.30 1.2 40–55 1.63×10⁻² 0.26 0.89 55–70 1.10×10⁻² 0.32 0.69 70–85 7.08×10⁻³ 0.41 1.0 85–100 4.40×10⁻³ 0.52 1.4 100–115 2.74×10⁻³ 0.68 1.8 115–130 1.79×10⁻³ 0.86 3.0 130–145 1.13×10⁻³ 1.1 2.6 145–160 7.21×10⁻⁴ 1.4 2.6 160–175 4.76×10⁻⁴ 1.9 4.2 175–190 3.31×10⁻⁴ 2.3 7.4 190–205 2.17×10⁻⁴ 3.0 6.3 205–220 1.51×10⁻⁴ 3.8 8.8 220–235 1.06×10⁻⁴ 4.7 9.6 235–255 7.28×10⁻⁵ 4.6 13 255–285 4.25×10⁻⁵ 4.5 11 285–435 9.45×10⁻⁶ 4.4 13
Table 10: Results of the normalised differential cross sections with relative uncertainties in the combined channel with respect to|η`|.
|η`| dσ1 ddσ|
η`| Stat. unc. Syst. unc.
(%) (%) 0.00–0.30 0.648 0.28 1.0 0.30–0.60 0.622 0.28 0.89 0.60–0.90 0.563 0.30 0.86 0.90–1.20 0.490 0.33 0.69 1.20–1.50 0.388 0.40 1.1 1.50–1.80 0.288 0.54 1.9 1.80–2.00 0.213 0.74 3.0 2.00–2.40 0.144 1.0 4.4
B Tabulated absolute differential tt production cross sections
Table 11: Results of the absolute differential cross sections with relative uncertainties in the combined channel with respect to Njets.
Njets dNdσjets Stat. unc. Syst. unc.
(pb) (%) (%) 3.5–4.5 40.6 0.33 9.3 4.5–5.5 31.9 0.29 8.7 5.5–6.5 16.8 0.47 9.9 6.5–7.5 7.22 1.0 11 7.5–8.5 2.60 3.0 13 8.5–10.5 0.591 3.9 12
Table 12: Results of the absolute differential cross sections with relative uncertainties in the combined channel with respect to HT.
HT dHdσT Stat. unc. Syst. unc.
(GeV) (pb GeV−1) (%) (%) 110–220 0.184 0.62 15 220–275 0.424 0.38 9.7 275–340 0.324 0.35 10 340–410 0.205 0.50 10 410–485 0.121 0.70 10 485–570 6.91×10⁻² 0.89 11 570–660 3.85×10⁻² 1.2 11 660–760 2.10×10⁻² 1.5 10 760–870 1.18×10⁻² 2.0 12 870–990 6.39×10⁻³ 2.5 11 990–1115 3.37×10⁻³ 3.6 16 1115–1250 1.84×10⁻³ 4.5 14 1250–1925 4.91×10⁻⁴ 3.3 16
Table 13: Results of the absolute differential cross sections with relative uncertainties in the combined channel with respect to ST.
ST dSdσT Stat. unc. Syst. unc.
(GeV) (pb GeV−1) (%) (%) 136–315 0.103 0.73 18 315–390 0.358 0.38 9.5 390–475 0.264 0.34 10 475–565 0.158 0.50 10 565–665 8.76×10⁻² 0.71 11 665–770 4.81×10⁻² 1.0 11 770–885 2.61×10⁻² 1.3 11 885–1010 1.38×10⁻² 1.8 11 1010–1140 7.56×10⁻³ 2.5 11 1140–1285 4.09×10⁻³ 3.2 15 1285–1440 2.02×10⁻³ 4.6 13 1440–1615 1.20×10⁻³ 5.3 20 1615–2490 2.42×10⁻⁴ 4.6 18
Table 14: Results of the absolute differential cross sections with relative uncertainties in the combined channel with respect to pmissT .
pmissT dpdσmiss
T Stat. unc. Syst. unc.
(GeV) (pb GeV−1) (%) (%) 0–50 1.05 0.21 8.8 50–105 0.664 0.28 10 105–175 0.126 0.76 15 175–245 2.44×10⁻² 2.0 11 245–315 5.96×10⁻³ 4.5 15 315–565 7.66×10⁻⁴ 5.8 17
Table 15: Results of the absolute differential cross sections with relative uncertainties in the combined channel with respect to pWT .
pW
T dpdσW
T
Stat. unc. Syst. unc.
(GeV) (pb GeV−1) (%) (%) 0–50 0.518 0.41 8.3 50–105 0.752 0.25 8.7 105–165 0.377 0.39 11 165–240 0.111 0.70 11 240–325 2.62×10⁻² 1.4 12 325–415 6.40×10⁻³ 2.8 13 415–845 5.54×10⁻⁴ 4.1 17
Table 16: Results of the absolute differential cross sections with relative uncertainties in the combined channel with respect to p`T.
p`
T dpdσ`
T Stat. unc. Syst. unc.
(GeV) (pb GeV−1) (%) (%) 26–40 2.16 0.39 9.5 40–55 1.64 0.28 9.2 55–70 1.11 0.33 9.1 70–85 0.715 0.41 8.8 85–100 0.443 0.53 8.9 100–115 0.277 0.68 8.7 115–130 0.181 0.86 9.0 130–145 0.114 1.1 8.6 145–160 7.28×10⁻² 1.4 8.8 160–175 4.80×10⁻² 1.9 9.0 175–190 3.34×10⁻² 2.3 11 190–205 2.19×10⁻² 3.0 9.8 205–220 1.52×10⁻² 3.8 12 220–235 1.07×10⁻² 4.7 13 235–255 7.34×10⁻³ 4.6 16 255–285 4.29×10⁻³ 4.5 14 285–435 9.53×10⁻⁴ 4.4 16
Table 17: Results of the absolute differential cross sections with relative uncertainties in the combined channel with respect to|η`|.
|η`| ddσ|
η`| Stat. unc. Syst. unc.
(pb) (%) (%) 0.00–0.30 65.5 0.31 8.9 0.30–0.60 62.9 0.30 8.8 0.60–0.90 56.9 0.32 8.8 0.90–1.20 49.5 0.35 9.0 1.20–1.50 39.2 0.43 9.1 1.50–1.80 29.1 0.57 9.5 1.80–2.00 21.6 0.76 10 2.00–2.40 14.6 1.1 11
C Tabulated minimum and maximum relative uncertainties for
ab-solute cross sections
T able 18: The upper and lower bounds, in %, fr om each sour ce of systematic uncertainty in the absolute dif fer ential cr oss section, over all bins of the measur ement for each variable. The bounds of the total relative uncertainty ar e also shown. Relative uncertainty sour ce ( % ) Njets HT ST p miss T p W T p ` T | η ` | b tagging ef ficiency 3.1 – 4.0 3.5 – 4.5 3.5 – 5.0 3.6 – 4.8 3.6 – 5.2 3.6 – 5.4 3.6 – 4.2 Electr on ef ficiency 1.6 – 1.9 1.6 – 2.3 1.4 – 2.5 1.6 – 2.4 1.2 – 3.0 1.0 – 3.5 1.0 – 2.1 Muon ef ficiency 2.0 – 2.5 2.2 – 2.5 2.2 – 2.6 2.3 – 2.6 2.3 – 2.9 2.2 – 3.3 2.1 – 2.3 JER 0.1 – 0.8 0.1 – 1.1 0.2 – 2.3 0.4 – 5.6 0.4 – 1.6 0.1 – 0.3 0.3 – 0.4 JES 1.4 – 9.2 4.3 – 12.8 4.3 – 15.1 2.2 – 10.9 2.2 – 7.8 1.8 – 4.1 3.8 – 4.1 Electr on transverse momentum in p miss T — — 0.1 – 0.3 0.1 – 0.9 0.1 – 0.6 — — Muon transverse momentum in p miss T — — 0.1 – 0.9 0.1 – 3.5 0.1 – 0.8 — — T au transverse momentum in p miss T — — 0.1 – 1.4 0.1 – 1.2 0.1 – 1.4 — — Uncluster ed transverse momentum in p miss T — — 0.1 – 1.7 0.2 – 1.9 0.1 – 1.0 — — QCD bkg cr oss section 0.1 – 0.9 0.1 – 1.6 0.1 – 2.3 0.1 – 0.8 0.1 – 1.3 0.1 – 5.0 0.1 – 3.6 QCD bkg shape 0.1 – 0.1 0.1 – 0.8 0.1 – 1.0 0.1 – 0.1 0.1 – 1.6 0.1 – 4.8 0.1 – 1.5 Single top quark cr oss section 1.1 – 1.7 1.1 – 3.5 1.1 – 5.8 1.3 – 6.3 1.1 – 8.4 1.3 – 7.4 1.4 – 1.5 V+jets cr oss section 0.7 – 1.1 0.6 – 3.4 0.5 – 4.6 0.7 – 2.9 0.7 – 4.5 0.6 – 6.3 0.6 – 2.5 PDF 0.1 – 0.3 0.1 – 0.4 0.1 – 0.6 0.1 – 0.3 0.1 – 0.4 0.1 – 0.5 < 0.1 Color reconnection (Gluon move) 0.2 – 2.8 0.2 – 4.1 0.1 – 11.8 0.2 – 1.0 0.1 – 1.1 0.2 – 4.7 0.1 – 0.5 Color reconnection (QCD-based) 0.2 – 2.1 0.1 – 4.3 0.1 – 6.7 0.3 – 4.6 0.3 – 3.8 0.1 – 7.9 0.1 – 1.7 Color reconnection (Early resonance decays) 0.1 – 3.9 0.1 – 7.1 0.1 – 4.1 0.1 – 1.4 0.1 – 3.8 0.1 – 5.0 0.1 – 1.1 Fragmentation 0.1 – 0.7 0.6 – 1.6 0.5 – 1.4 0.1 – 0.7 0.2 – 0.8 0.1 – 0.8 0.3 – 0.4 hdamp 0.1 – 3.5 0.2 – 3.1 0.1 – 3.0 0.6 – 2.1 0.2 – 3.2 0.4 – 3.4 0.5 – 2.0 T op quark mass 0.7 – 2.0 0.3 – 3.4 0.3 – 3.7 0.3 – 5.0 0.4 – 2.0 0.3 – 3.5 0.9 – 1.7 Peterson fragmentation model 0.3 – 2.0 1.6 – 2.7 1.9 – 3.2 1.1 – 2.6 1.3 – 2.6 1.2 – 2.9 1.5 – 1.5 Shower scales 2.7 – 6.5 2.6 – 6.4 3.0 – 7.0 4.0 – 6.6 4.6 – 6.2 3.9 – 6.2 4.9 – 5.6 B hadr on decay semileptonic branching fraction 0.2 – 0.3 0.1 – 0.3 0.1 – 0.3 0.2 – 0.3 0.2 – 0.3 0.2 – 0.3 0.2 – 0.3 T op quark pT 0.4 – 1.2 0.1 – 0.8 0.1 – 0.9 0.1 – 1.5 0.1 – 1.0 0.1 – 1.0 0.6 – 0.7 Underlying event tune 0.1 – 2.9 0.2 – 5.3 0.2 – 4.4 0.2 – 5.4 0.1 – 2.6 0.1 – 6.0 0.2 – 0.9 Simulated sample size 0.1 – 1.6 0.1 – 1.6 0.1 – 1.9 0.1 – 2.2 0.1 – 1.4 0.1 – 1.7 0.1 – 0.4 Additional interactions 0.1 – 0.3 0.1 – 0.7 0.1 – 1.3 0.3 – 1.3 0.1 – 0.6 0.1 – 0.8 0.1 – 0.3 Integrated luminosity 2.5 – 2.5 2.5 – 2.5 2.5 – 2.5 2.5 – 2.5 2.5 – 2.5 2.5 – 2.5 2.5 – 2.5 T otal 8.7 – 13.4 9.7 – 15.9 9.5 – 20.0 8.8 – 17.1 8.3 – 17.5 8.6 – 16.1 8.8 – 10.6
References
[1] CMS Collaboration, “The CMS experiment at the CERN LHC”, JINST 3 (2008) S08004, doi:10.1088/1748-0221/3/08/S08004.
[2] CMS Collaboration, “Measurement of differential top-quark pair production cross sections in pp collisions at√s =7 TeV”, Eur. Phys. J. C 73 (2013) 2339,
doi:10.1140/epjc/s10052-013-2339-4, arXiv:1211.2220.
[3] CMS Collaboration, “Measurement of the differential cross section for top quark pair production in pp collisions at√s =8 TeV”, Eur. Phys. J. C 75 (2015) 542,
doi:10.1140/epjc/s10052-015-3709-x, arXiv:1505.04480.
[4] CMS Collaboration, “Measurement of double-differential cross sections for top quark pair production in pp collisions at√s=8 TeV and impact on parton distribution functions”, Eur. Phys. J. C 77 (2017) 459, doi:10.1140/epjc/s10052-017-4984-5, arXiv:1703.01630.
[5] CMS Collaboration, “Measurement of the integrated and differential t¯t production cross sections for high-pT top quarks in pp collisions at√s=8 TeV”, Phys. Rev. D 94 (2016)
072002, doi:10.1103/PhysRevD.94.072002, arXiv:1605.00116.
[6] CMS Collaboration, “Measurement of the t¯t production cross section in the all-jets final state in pp collisions at√s =8 TeV”, Eur. Phys. J. C 76 (2015) 128,
doi:10.1140/epjc/s10052-016-3956-5, arXiv:1509.06076.
[7] CMS Collaboration, “Measurement of differential cross sections for top quark pair production using the lepton+jets final state in proton-proton collisions at 13 TeV”, Phys. Rev. D 95 (2017) 092001, doi:10.1103/PhysRevD.95.092001, arXiv:1610.04191. [8] CMS Collaboration, “Measurement of normalized differential t¯t cross sections in the
dilepton channel from pp collisions at√s= 13 TeV”, (2017). arXiv:1708.07638. Submitted to JHEP.
[9] ATLAS Collaboration, “Measurements of top-quark pair differential cross-sections in the lepton+jets channel in pp collisions at√s=13 TeV using the ATLAS detector”, JHEP 11 (2017) 191, doi:10.1007/JHEP11(2017)191, arXiv:1708.00727.
[10] ATLAS Collaboration, “Measurements of top-quark pair differential cross-sections in the eµ channel in pp collisions at√s =13 TeV using the ATLAS detector”, Eur. Phys. J. C 77 (2017) 292, doi:10.1140/epjc/s10052-017-4821-x, arXiv:1612.05220.
[11] CMS Collaboration, “Measurement of the differential cross sections for top quark pair production as a function of kinematic event variables in pp collisions at√s=7 and 8 TeV”, Phys. Rev. D 94 (2016) 052006, doi:10.1103/PhysRevD.94.052006, arXiv:1607.00837.
[12] CMS Collaboration, “The CMS trigger system”, JINST 12 (2017) P01020, doi:10.1088/1748-0221/12/01/P01020, arXiv:1609.02366.
[13] S. Frixione, P. Nason, and C. Oleari, “Matching NLO QCD computations with Parton Shower simulations: the POWHEG method”, JHEP 11 (2007) 070,