ESCP-EUROPEandCLSBE
Value Creation for Emerging Acquirers in
Other Emerging Economies: A Comparison with
Developed Market Firms
Maria Teresa Fernandes Guimarães Lobato ESCP-103399 and CLSBE-152110032
Research Advisor: Professor Pramuan Bunkanwanicha
Master Thesis submitted at ESCP Europe, 79 Avenue de la République, 75011 Paris
Paris, 9th May 201 Abstract
Over the past few years, emerging markets have been reinforcing their presence in the worldwide M&A activity. In fact, emerging acquirers are now targeting companies in order to tap into their fast economic growth and increasingly wealthy populations. As a consequence, we have to ask: Do cross-border acquisitions in emerging markets create positive and significant returns to their emerging acquirers? Are these higher than those of developed countries? We perform an event study on 657 deals involving emerging acquirers between 2002 and 2011 and compare with 1936 deals performed by developed country firms both in emerging markets. We find that emerging acquirers earn significantly higher returns than developed markets especially in the case of acquisition of control. Lastly, emerging companies of smaller size, who finance their transactions with cash and acquire control of the target, are more likely to incur higher value creation.
Keywords: Cross-border acquisitions, emerging markets, event study, value creation and M&A
2 Résumé
Au cours des dernières années, les marchés émergents ont renforcés leur présence mondiale dans l’activité des fusions et acquisitions. En effet, aujourd’hui, les acquéreurs émergents sont entrain d’acquérir des entreprises dans d’autres pays émergents afin de profiter de leur croissance économique et de leurs populations de plus en plus riches. En conséquence nous devons nous demander : Est-ce-que les acquisitions transfrontalières dans les marchés émergents créent des rendements positifs et significatifs à des acquéreurs émergents? Sont-ils plus élevés que ceux des pays développés? Nous avons réalisé une étude d'événement sur 657 transactions impliquant des acquéreurs émergents entre 2002 et 2011 et on les compare avec 1936 transactions réalisées par des entreprises des pays développés tout deux ciblant des pays émergents. Nous constatons que les acquéreurs émergents obtiennent des rendements nettement plus élevés que les marchés développés notamment dans le cas d'acquisition du contrôle. Dernièrement, les entreprises émergentes de plus petite taille, qui financent leurs opérations avec de l'argent et acquièrent le contrôle de leur cible, sont plus susceptibles d’avoir une création de valeur plus significative.
Mots-clés: Acquisitions transfrontalières, marchés émergents, étude d'événements, création de valeur et fusion-acquisitions
Resumo
Ao longo dos últimos anos, os mercados emergentes têm vindo a reforçar a sua presença na actividade das fusões e acquisições a nível mundial. Na verdade, nos dias de hoje os adquirentes emergentes estão direcionados para empresas do seu tipo de mercados com o intuito de tirar partido do seu rápido crescimento econômico e de populações cada vez mais ricas. Consequentemente temos de nos questionar: Será que adquirentes de países emergentes têm retornos significativamente positivos em aquisições noutros mercados emergentes? Serão estes superiores aos retornos de países desenvolvidos? Realizámos um “event study” em 657 transacções envolvendo adquirentes emergentes entre 2002 e 2011 e comparámos com 1936 transacções realizadas por empresas de países desenvolvidos, ambas em mercados emergentes. Concluímos que os adquirentes emergentes obtêm retornos significativamente superiores aos que são obtidos por empresas de mercados desenvolvidos especialmente no caso da aquisição de controlo. Por último, as empresas mais pequenas, que financiam as suas operações com dinheiro e adquirem o controlo da empresa comprada, são mais propensos a incorrer uma maior criação de valor.
Palavras Chave: Acquisições transfronteiriças, mercados emergentes, estudos de eventos, criação devalor, fusões e acquisições
3
T
ABLE OF
C
ONTENTS
1. Introduction ... 6
2. Literature Review ... 8
2.1. Cross-border acquisitions: A general perspective ... 8
2.2. Emerging Markets ... 9
2.3. Developed economies ... 10
2.4. Stock price returns and market efficiency ... 11
2.5. Abnormal Returns in cross-border acquisitions ... 12
2.5.1. Classical factors influencing abnormal returns ... 12
2.5.2. Neo-classical factors explaining abnormal returns ... 16
3. Research question and hypotheses ... 22
3.1. Main hypotheses ... 22
3.2. Secondary hypotheses ... 23
3.2.1. Classical hypotheses ... 23
3.2.2. Neoclassical hypotheses ... 25
4. Data sampling considerations ... 26
4.1 Data screens performed ... 27
4.2 Sample characteristics ... 27
5. Methodology of event studies: cumulative abnormal returns (CARs) ... 33
5.1. Computing the CARs - in theory ... 33
5.2. Computing the CARs - in practice ... 34
6. Results and Discussion ... 37
6.1. Main hypotheses’ findings and results ... 37
6.2. The Impact of Majority Control ... 39
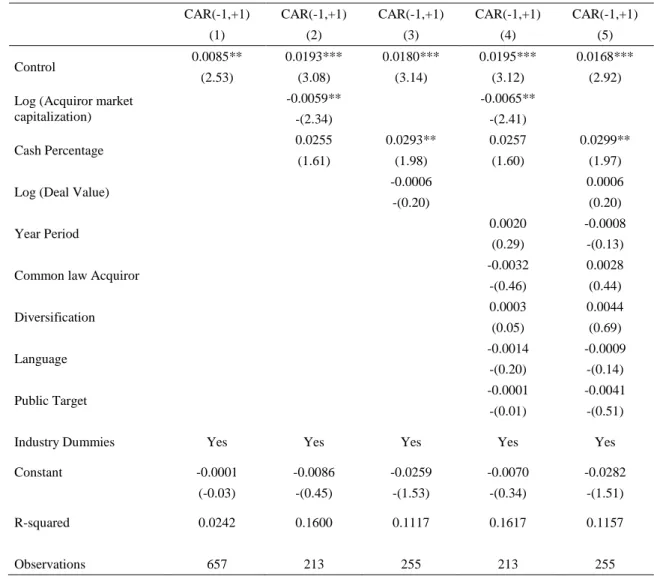
6.3. Multivariate Regressions ... 41
6.4. Sources of Value Creation for Emerging Market Firms ... 45
4 7.1. Limitations ... 49 7.2. Further Research ... 50 8. Managerial Implications ... 52 9. Conclusion ... 54 10. Bibliography ... 56 11. Appendix ... 62
T
ABLE OF
F
IGURES
Figure 1: Total cross-border M&A deals by firms from advanced economies and emerging market economies, 1997–2010 (World Bank 2011) ... 9Figure 2. Volume of announced transactions per year (number) ... 29
Figure 3. Sample cleaning-up stages ... 32
Figure 4. Event study timeline ... 36
Figure 5. Abnormal Returns of acquisitions in Emerging Markets ... 62
Figure 6. Volume of the total deals per year of announcement (Full Sample) ... 62
Figure 7. Break-down of Deals involving Developed Market Acquirers by number of deals per nation ... 63
Figure 8. Break-down of Deals involving Emerging Market Acquirers by number of deals per nation ... 63
Figure 9. Break-down of Deals involving Emerging Market Targets by number of deals per nation ... 63
T
ABLE OF
T
ABLES
Table 1. Acquirer and Target Countries featured in the sample ... 28Table 2. Distribution of Top 10 Acquirer Nations (EM & DM) ... 29
Table 3. Distribution of Top 10 Target Nations (EM) ... 30
Table 4. Summary Statistics for firm and deal specificities ... 31
Table 5. Emerging and Developed market acquirers: T-test, sign-test, Wilcoxon rank-sum (Mann-Whitney) test and univariate regression ... 37
5 Table 7. Emerging and Developed market acquirers considering "Acquisition of
control” ... 40 Table 8. Multivariate Regression coefficients, and statistics for EM and Majority
Control ... 44 Table 9. Multivariate Regression coefficients and statistics for the EM-EM sample .... 45 Table 10. Summary statistics for the variable "Majority Control" for Emerging Market Acquirers ... 46 Table 11. Correlation of explanatory and control variables for the Full Sample ... 64 Table 12. Correlation of explanatory and control variables Emerging Markets Sample 64 Table 13. Summary statistics for the variable "Cash Percentage" ... 65 Table 14. Summary statistics for the variable "Acquirer Market Capitalization" ... 65 Table 15. Summary statistics for the variable "Deal Value" ... 66 Table 16. Summary statistics for the variable "Common Law Acquirer" for Emerging Market Acquirers ... 66 Table 17. Summary statistics for the variable "Year Periods" for Emerging Market Acquirers ... 67 Table 18. Summary statistics for the variable "Diversification" for Emerging Market Acquirers ... 67 Table 19. Summary statistics for the variable "Public Target" for Emerging Market Acquirers ... 68
6
1. I
NTRODUCTION
In recent years, corporate mergers and acquisitions have proved their increasingly significant role in the World Economy. Between 2000 and 2010, the volume of worldwide merger and acquisitions has always been greater than 1.2 trillion USD and averaged 2.5 trillion USD over the period (Thomson Reuters, 2011). According to A. T. Kearney (2008), “Beginning in 2002 deals between developing and developed countries grew at an annual rate of 19 percent – far in excess of the industry averages”, this shows the increasing presence of emerging markets in an activity fully dominated by developed economies in the past. Interestingly, while in 2005 only 47 emerging economies’ firms were included in the Forbes 500 ranking in 2010 this number already amounted to 95.
Emerging markets have been defined as those developing economies having high economic potential and international engagement (World Bank 2011). Cross-border acquisitions (CBAs) among emerging markets (EM) are a recent phenomenon as until the 1990s many of these countries were still had undeveloped capital markets. As liberalization processes were implemented many economic and trade reforms were performed at the national level. As a consequence, one of the most common motives behind M&A transactions involving only emerging markets is to seek growth and overcome the latecomer disadvantage when compared to developed market (DM) firms by tapping into other markets with fast economic growth and increasingly wealthy populations. This leads us to as several questions about their performance: Do cross-border acquisitions in emerging markets create positive and significant returns to their emerging acquirers? Are these higher than the ones of developed country firms? In this paper we will take a deeper look at these issues through the analysis of stock market reactions to the announcement of cross-border acquisitions performed by emerging market firms in other emerging economies.
As a consequence of a significant increase in interest in emerging economies several authors have started to perform researches in this field. Bhagat, Malhotra and Zhu (2011) have found that emerging market acquirers have positive cumulative abnormal returns of 1.72% for a three–day event window at a 1% significance level when performing acquisitions in both emerging and developed markets. Additionally, (Chari, Ouimet and Tesar 2010) have found that developed market acquirers have
7 higher performance than emerging market firms in emerging markets. Nevertheless, one has to point out that these authors do not make a distinction between cross-border and domestic acquisitions. However, in order to properly compare the performance of emerging market firms in emerging markets they need to be in the same conditions as developed market acquirers (cross-border acquisitions). Furthermore, we also have to consider the success factors that are determinant and specific to emerging market targets.
Our study helps to fill this gap by providing a study focusing on the value created by emerging acquirers stemming from cross-border acquisitions in other emerging economies. For this we have performed and event studies test and analyzed the stock price reaction to 657 deals performed by emerging market countries between 2002 and 2011 and compared them against another 1936 deals performed by developed economies.
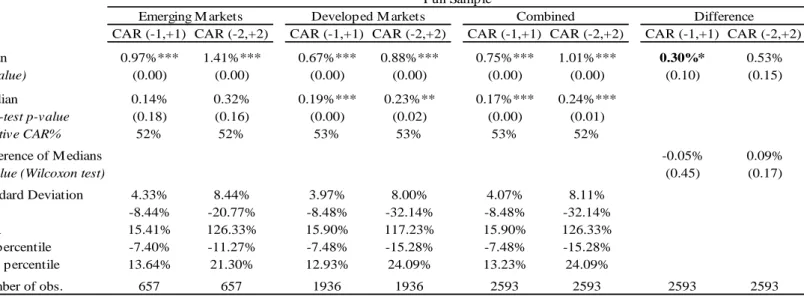
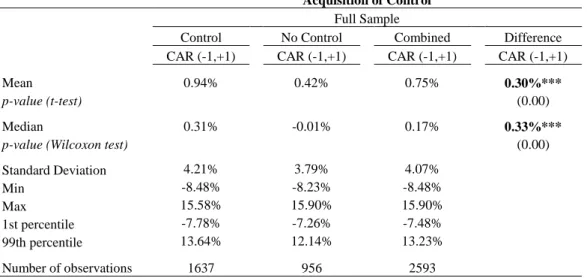
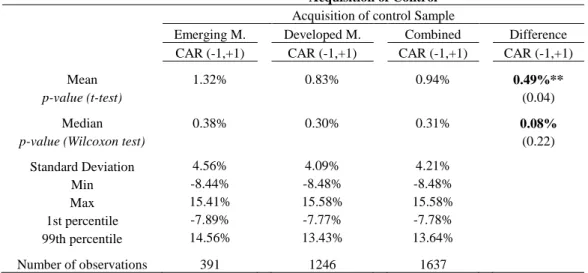
We find that acquisitions involving emerging market acquirers have significantly higher returns than those performed by developed market firms. More specifically, emerging market acquirers incur higher positive returns than developed market acquirers, amounting to an average of 0.3% which is statistically significant for a confidence level of 10%. The acquisition of control further reinforces our findings as in this case the difference between emerging and developed acquirers reaches a value of 0.49% and becomes statistically significant for a confidence interval of 95%. Thus, after performing an empirical research on our sample, we may infer that acquisitions performed by emerging market firms do create value for shareholders. In fact, this value tends to be higher than the returns obtained by developed country firms.
The remainder of this paper is divided into 8 sections. The first part gathers the existing literature on emerging market cross-border acquisitions. In a second section we have included our hypothesis and main questions to be answered by this thesis. In a third part we have indicated our data sampling considerations and the different filters applied. In our fourth section we describe the methodology to be followed. In a fifth part we report our main findings and conclusions which are then followed by section six providing its limitations and grounds for further research. A seventh section describes the managerial implications that may be withdrawn from this research and last but not least we include a summary of our main findings and final remarks.
8
2.
L
ITERATURE
R
EVIEW
The volume of cross-border acquisitions has been increasing much faster in the last 20 years than the volume of domestic acquisitions with the growth of the former being almost three times higher than the latter (Mantecon 2009). This results from the need of companies to constantly pursue new opportunities in order to face economic development and increased competition while struggling to maintain their position in the market (Morrow, et al. 2007). Indeed, it is important to note that CBAs are a fast and easy way for companies to expand internationally (Nadolska and Barkema 2007, Collins, et al. 2009).
M&A activity across developed countries has long played a substantial role in the economic and financial debate. However, CBAs as a mode of entry in emerging economies are a fairly recent event. In fact, since the beginning of the 1990s, emerging market firms have been increasing their CBAs as a consequence of the liberalization of their economies, the globalization of industries, the increase in competition intensity, and the better access to capital markets (Karnani 2010). Nonetheless, it is surprising to observe how little we know about the returns on cross-border acquisitions in emerging markets.
Although some research has been performed in this field, the difference in returns to acquirer firms in emerging markets depending on whether their home country is a developed or an emerging economy remains unclear.
In this section we will start by looking at the trend observed in cross-border acquisitions and their importance in emerging economies. Following this, we will analyze the stock price returns as indicators of performance in acquisitions. Last but not least, we will investigate the meaning and possible explanations of abnormal returns in cross-border acquisitions.
2.1. C
ROSS-
BORDER ACQUISITIONS:
A
GENERAL PERSPECTIVEThe entry in international trade markets can be done in many different ways. Cross-border investments may take the form of greenfield investments, cross-Cross-border acquisitions/mergers, joint ventures or alliance partnerships, partnerships with firms that
9 are not from the host country but have already settled their operations, or a mix of all the options mentioned (Collins, et al. 2009).
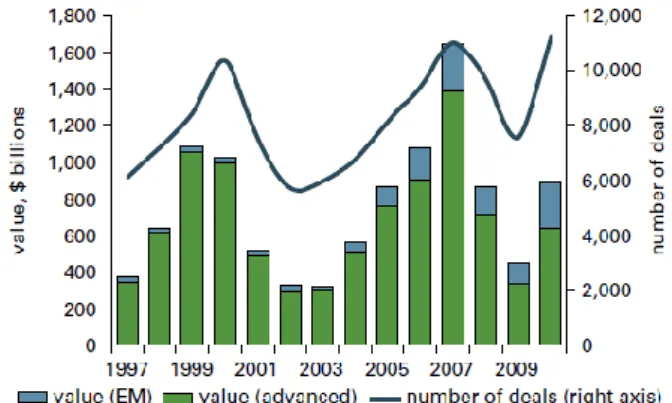
According to the World Bank (2011), many changes in international trade flows around the world have been introduced after observing the market liberalization and deregulation of many developing economies in the 1990s. Specifically, CBAs from emerging market firms have been the subject of an exponential increase. Even if emerging market firms only had a share of 4% of the world total value of CBAs in the 1997-2003 period, this entity states that, in the years between 2004 and 2010, this value increased to a significant share of 17%.
Figure 1: Total cross-border M&A deals by firms from advanced economies and emerging market economies, 1997–2010 (World Bank 2011)
Additionally, out of the 11.113 CBAs announced at the world level in 2010, 5.623 involved emerging market companies either as targets or as acquirers (World Bank 2011).This reinforces the existence of a trend of increasingly pronounced M&A activity of emerging countries and their determination in establishing their position in today’s economy. We no longer live in a polar global economy with advanced economies in command but rather in a multi-polar one where emerging economies also play a significant role.
2.2. E
MERGINGM
ARKETSThe term “Emerging Markets” has been around for more than thirty years. Its creation was the result of an observed negative connotation associated with “third world countries”; while the latter suggests a situation of stagnation the former sounds more
10 positive and stimulating (The Economist 2008). Antoine van Agtmael, a member of the World Bank’s International Financial Corporation (IFC), was the first to set the definition of Emerging markets in light of economics and levels of wealth (Financial Times 2006). The World Bank uses the Gross Domestic Product (GDP) per capita in order to classify countries in three income boundaries.
For the purpose of this research and according to the World Bank (2011) we shall consider emerging market economies as those developing countries having high economic potential and international engagement. Considering a classification by region, these economies are:
1. Africa: Egypt, Ghana, Kenya, Morocco, Nigeria and South Africa.
2. Asia: Azerbaijan, China, India, Indonesia, Kazakhstan, Malaysia, Mongolia, Pakistan, Philippines, Singapore, South Korea, Sri Lanka, Thailand and Vietnam.
3. Europe: Belarus, Bulgaria, Croatia, Czech Republic, Estonia, Hungary, Latvia, Lithuania, Romania, Russian Federation, Turkey, Ukraine and Poland.
4. Central and South America: Argentina, The Bahamas, Barbados, Brazil, Chile, Colombia, Costa Rica, Dominican Republic, Ecuador, El Salvador, Guatemala, Jamaica, Mexico, Panama, Peru, Trinidad and Tobago, Uruguay and Venezuela.
5. Middle East: Bahrain, Jordan, Kuwait, Lebanon, Oman, Qatar, Saudi Arabia and United Arab Emirates.
Although increasing exponentially in number over the past few years, cross-border acquisitions involving acquirers from emerging markets are still the object of little research. Nevertheless, there have been recent developments in this field and according to Bhagat, Malhotra and Zhu (2011), emerging market acquirers have positive cumulative abnormal returns of 1.72% for a three–day event window at a 1% significance level when performing acquisitions in both emerging and developed markets.
2.3. D
EVELOPED ECONOMIESAlthough the focus of this paper is mainly set on emerging markets, it is important to address the definition of developed economies that will be followed. More
11 specifically, advanced economies are defined as those that have “traditionally been identified as industrialized nations” (World Bank 2011): Austria, Australia, Belgium, Canada, Denmark, Finland, France, Germany, Greece, Iceland, Ireland, Italy, Japan, Luxembourg, Netherlands, Norway, New Zealand, Portugal, Spain, Sweden, Switzerland, United Kingdom and the United States of America.
Developed economies’ CBAs into emerging countries have been the object of many studies in the past. Several authors such as Chari, Ouimet and Tesar (2010), among others, have in fact agreed that even if abnormal returns may be of small value they entail a significant return to developed market acquirers.
2.4. S
TOCK PRICE RETURNS AND MARKET EFFICIENCYAccording to the neoclassical theory, as individuals maximize utility, firms maximize profits by using all available information and production resources in order to make rational choices. As a consequence, companies will only decide to acquire other firms if, in their view, this acquisition will create value and thus have positive returns.
Furthermore, in order for acquisitions to take place in the market there is a need for investors to believe that stock prices observed do indeed translate the real value of the company. Therefore, “a fundamental premise underlying the market for corporate control is the existence of a high positive correlation between corporate managerial efficiency and the market price of shares of that company” (Manne 1965).
Beechey, Gruen and Vickery (2000), who quoted Fama (1970), agree that the main role of the financial stock market is to allocate ownership among individual investors and firms. As a consequence, an efficient market creates the necessary conditions for effective production-investment decisions which can be performed under the assumption that stock prices fully reflect all available information. This follows the logic of the random walk principle stating that “if the flow of information is unimpeded and information is immediately reflected in stock prices, then tomorrow's price change will reflect only tomorrow's news and will be independent of the price changes today (Malkiel 2003)”.
Most importantly, the idea that stock prices follow a random walk is core in the methodology to be followed in this paper. It is the belief in this principle that will allow
12 us to assume that the changes in stock price over the event window around the announcement of the acquisition are only the result of this new stream of information.
2.5. A
BNORMALR
ETURNS IN CROSS-
BORDER ACQUISITIONSMany researchers argue that cross-border acquisitions do in fact create positive value for the acquirer (Doukas and Travlos 1988, Doukas 1995, Kiymaz 2004, R. La Porta, F. Lopez-de-Silanes, et al. 2000). However, this is a long standing debate, and several other experts state that cross-border acquisitions actually decrease the acquirer’s value (Denis, Denis and Yost 2002, Moeller and Schlingemann 2005). Nevertheless, many changes have been observed in the past few years and turned this debate into a more interesting one.
2.5.1. CLASSICAL FACTORS INFLUENCING ABNORMAL RETURNS
In the past, research on the positive and negative abnormal returns from acquisitions mainly focused on firm-related factors. As cross-border acquisitions start to coin their significance in the world economy a more macroeconomic view which considers the factors at the country level is also being used. Nevertheless, classical factors based on the thought of value creation and wealth transfer at the time of the transaction are still relevant.
2.5.1.1. Size of the acquirer
Many authors have agreed that bidder returns and size have an inverse correlation. To be more precise, the larger the acquirer the lower the relative returns earned at the time of announcement (Asquith, Bruner and Mullins Jr. 1983, Moeller, Schlingemann and Stulz 2004, Bhagat, Dong, et al. 2005). Furthermore, it has also been proved that large acquirers are more prone to overpay for their targets (Bhagat, Malhotra and Zhu 2011).
Under a different perspective, Hishleifer, Richardson and Teoh (2006) have argued that firms with higher valuations have lower returns at the time of the announcement. Their common decision of paying in equity will signal the market that this higher valuation is not due to a higher level of assets which will impose a downward pressure on the stock-price. Still, Moeller, Schlingemann and Stulz (2004) disagreed as they point out that markets value the firm’s equity disregarding its book value of assets. This
13 lack of correlation implies that valuation is not connected to the value of the firm’s fundamentals.
It is important to note two sources of bias as the lack of their consideration may have lead to erroneous conclusions in the past. If the target is too small compared to the acquirer, the evaluation of the acquisition may have little or no effect on the acquirer’s stock (Fuller, Netter and Stegemoller 2002). Furthermore, acquisitions performed by smaller companies do have higher relative levels of return. However, these translate into lower dollar gains than those performed by larger firms with lower relative gains (Moeller, Schlingemann and Stulz 2004).
2.5.1.2. Payment method
Methods of payment in acquisitions and their impact on returns have been the object of many studies in financial research. Moreover, Eckbo e Thorburn (2000) have concluded in their study that all cash-offers have an increase in the price of the stock of on averge 3.11% over the event month.
However, funding the transaction with equity is not so unusual. Still in this case firms should consider two separate actions involved in the transaction that many times are not dissociated properly: the equity issue and the acquisition. The Equity issue, an independent event, is likely to face a negative reaction from investors as it is signaling the market that the acquirer’s stock is overvalued (Moeller, Schlingemann and Stulz 2004). This will decrease demand for the stock and thus decrease its price. Therefore, one has to bear in mind that the evolution of the acquirer’s stock price at the time of the announcement will be a consequence of both operations; the equity issue and the belief in the success of the acquisition (Andrade, Mitchell and Stafford 2001). To be more specific, even if the acquisition would have positive abnormal return, the negative effects of the equity issue might outweigh other positive effects.
2.5.1.3. Diversification
Firms can acquire other companies as a mean of diversifying their business and hence reduce the volatility of their cash-flows by reducing the correlation of their operations (Bhagat, Malhotra and Zhu 2011). In spite of this possible source of positive abnormal returns, the attempt of diversification can create a distorted perception in the market. Many researchers have argued that before making acquisitions, firms will try to
14 find attractive opportunities of investment in order to obtain organic growth. Only when these are exhausted, the company will look for outside growth prospects. As a consequence, CBAs might signal the market that the companies’ opportunities are exhausted, which may lead to a negative reaction from investors (McCardle and Vishwanathan 1994, Jovanovic and Braguinsky 2004).
In addition there are two other types of CBAs, these horizontal or vertical depending on the objectives that trigger the existence of the transaction (UNCTAD 2000). Many researchers have scrutinized these two types of CBAs and have reached a consensus on its relevance in the explanation of abnormal returns (Morck, Sleifer and Vishny 1990, Macquieira, Megginson and Nail 1998, Moeller, Schlingemann and Stulz 2004, Karnani 2010). Horizontal CBAs usually take place between two companies who compete in the same industry and allow the acquirer to benefit from synergies arising from operational gains due to economies of scale as well as an increase in market power. Vertical CBAs happen between companies and their respective suppliers. This form of integration intends to reduce the uncertainty of transaction costs faced while providing gains from economies of scope.
Need for strategic assets
This factor is especially significant when considering emerging economies as their companies often engage in CBAs due their need to acquire specific critical resources in advanced technology, managerial expertise but also gain access to consumers in key international markets. Companies also engage in cross-border acquisitions in order to avoid domestic institutional and market constraints (Luo and Tung 2007). Moreover, this strategy will enable them to overcome their latecomer disadvantage while providing the competitive advantage needed to be able to compete more efficiently against global large players and earn abnormal profits (Karnani 2010, Guillén e García-Canal 2009).
2.5.1.4. Transaction Value: Overpayment
Past research has explicitly proven that the higher the transaction value, the lower the acquirer returns (Bhagat, Malhotra and Zhu 2011, Bayazitiva, Kahl and Valkanov 2012). More importantly, overpaying represents a negative wealth transfer from the acquirer to the target and thus will have a negative impact on the acquirer’s stock price (Karnani 2010). Interestingly, developing country firms tend to bid higher when
15 acquiring firms from advanced economies, their bid premiums reflect the existence of a so-called national pride. In contrast to this behavior, emerging country firms do not necessarily bid higher than advanced economy ones, when acquiring firms in developing countries (Hope, Thomas and Vyas 2011).
2.5.1.5. Better use of target’s assets
Corporate assets should be used in the most efficient way. M&A helps reaching this optimal level by reallocating resources and control among companies (Rossi and Volpin 2004). Global diversification allows firms to benefit from better production, marketing and management skills and from more flexible responses to different institutional differences (Denis, Denis and Yost 2002). Past research has agreed that the operating cash-flows of the new legal identity formed improve after the transaction, especially when compared to industry peers (Healy, Palepu and Ruback 1992, Andrade, Mitchell and Stafford 2001). This reflects the belief that production will be used more efficiently and better investment strategy decisions will be made by the acquirer’s management (Bhagat, Malhotra and Zhu 2011).
Although acknowledging that abnormal returns at announcement reflect expectations on the value of improved cash-flows deriving from increased efficiency gains, Andrade et al. (2001) have also expressed some challenges to this theory. First, the authors state that there is still no reliable method that will measure the efficiency-gains in the long-term, that is in a post-merger situation. Second, noise problems are still very obvious since no consensus has been reached on the determinants of returns to the acquirers. Lastly, the authors also state the importance of different motivations on the results of the transaction. More specifically, only mergers focusing on good objectives such as synergies or economies of scope will have positive returns.
2.5.1.6. Reduction in tax liability
In a first stance, it is possible that the new identity formed by the two companies will have to perform less tax payments than if the two the firms were two independent legal units. (Bhagat, Malhotra and Zhu 2011)
In a second stance, emerging market firms may decide to bid firms in foreign markets as a means of implementing a reverse investment strategy. They may acquire the company and later use this unit to invest in the home country while receiving tax
16 breaks and other financial benefits as well as non-financial advantages such as the access to scarce resources or regulatory support (Luo and Tung 2007).
2.5.1.7. Empire-building behavior: A cause for negative returns Free cash flows should be used to pay shareholders rather than to engage in acquisitions (Jensen 1986). This may be true in shareholders’ belief, but the owner-principal agency problem is evident and many managers keep on having an empire building behavior in detriment of value creation. Power, compensation, prestige and the decrease in the risk of unemployment are among the many personal gains to managers from entering an acquisition strategy and thus gaining control over a larger amount of resources (Hope, Thomas and Vyas 2011).
Empire building behavior faces higher costs in emerging countries due to their weaker institutional structure (Jirapon, et al. 2006) and the lower accountability of managers to their shareholders (Hope and Thomas 2008). Furthermore, managers from these economies not only have more corporate governance freedom to install these empires, but they also have higher incentives that go beyond the firm level; it is about building an empire for their country (Hope, Thomas and Vyas 2011).
2.5.1.8. Private vs. Public targets
Research performed by Capron and Shen (2007) states that acquirers tend to buy public targets when entering new business segments and in acquisitions in intangible capital intensive industries. The latter tend to have a more reduced risk. They also conclude that private firms will provide for higher abnormal returns. One of the reasons behind this may be that the lack of information existing on private targets allows for more possibilities of exploitation by the acquirers in order to earn higher positive abnormal returns. From this we can understand that asymmetry of information on targets is indeed a double-edged sword. Equity markets are often used as screening devices, as public firms have to release information on their financials in a more credible form there is less room for abnormal returns to the acquirer.
2.5.2. NEO-CLASSICAL FACTORS EXPLAINING ABNORMAL RETURNS
More recently, research has tried to find explanations for abnormal returns of cross-border acquisitions in neo-classical factors such as corporate governance. The latter has
17 been defined as the institutional and market-based structures that will induce managers to make decisions with the goal of maximizing the value for the company’s shareholders(Denis and McConnell 2003).
Although acknowledging the importance of company specific differences within a country such as antitakeover provisions, manager director compensation policies, board structure and board governance policies (Bhagat, Malhotra and Zhu 2011), inter-country discrepancies play a more prominent role in understanding abnormal returns (Doidge, Karolyi and Stulz 2007).
The confidence in the financial market’s legal system is one of the main factors for an investor to consider when making the decision of whether to invest in a foreign country or not (Beim and Calomiris 2001). More specifically, cross-border transactions find its dependence on the structure of the country in four ways: regulatory, financial, economic, and cultural.
2.5.2.1. Regulatory: Majority control
Property rights define who is entitled to own property in a country and the rights given from detaining ownership. The lack of such protection in emerging economies has generated a situation where the loss of control may be so costly that investors are not willing to become minority shareholders out of fear of being expropriated (R. La Porta, F. Lopez-de-Silanes and A. Shleifer, et al. 1998, Dyck and Zingales 2004). This created an ownership concentration that may not allow foreign country firms to enter the market through CBAs (La Porta, Lopez-de-Silanes e Shleifer 1999). However, if they do enter the country the lack of contract enforcement requires foreign acquirers to have majority control (Hart 1995). This is especially significant in R&D intensive industries (Chari, Ouimet and Tesar 2006).
Looking at these legal considerations, it is understandable that over fifty percent of East Asian companies are family controlled (Claessens, Djankov and Lang 2000). According to Bertrand and Schoar (2006), this is mainly explained by weak legal structures and the role family trust plays as a second-best substitute for the missing governance and contractual enforcement. Indeed, only a very small number of families control most of East Asian Corporations, this enhances their power and allows them to exercise pressure on the government and impact the country’s economic policies. Two
18 good examples of this extensive power ate the Suharto family in Indonesia and the Imelda-Marcos family in the Philippines. These families have had extensive influence on “anti-monopoly law and commercial law, in addition to trade and foreign currency management policies, macro financial policies, contracting process of public investment and expenditure” (Hanazaki e Liu 2007). This has a tremendous impact on foreign investors as it leaves an inequitable advantage for domestic companies. Although progress has been made, these countries still have a long way to go to fully reach the liberalization of their financial markets.
In addition, Rossi and Volpin (2004) have done extensive research in the determinants of CBAs and have reached the conclusion that an increase in investor protection imposed on the target by a cross-border transaction will be a crucial driver of positive abnormal returns, especially when the host country is an emerging market. However, they have also found that in countries with higher investor protection, CBAs become less common with investors preferring domestic mergers and acquisitions or even hostile takeovers. Moreover, the authors also prove that in countries with higher investor protection companies tend to pay more frequently with stock and pay higher premiums for control. Investors attribute higher value to stocks with better legal protection; they incur less risks of being expropriated and are willing to pay a premium for it. As the stock price grows, market-debt funding is more efficient and financial markets develop which in turns benefits the country (R. La Porta, F. Lopez-de-Silanes, et al. 2000). However, one has to bear in mind that this protection increases transaction costs and reduces possible gains from better corporate governance. Firms may look for other countries which are weaker in terms of legal protection in order to earn higher benefits. This may explain the higher flow of CBAs from developed to emerging economies in the past few years (Martynova and Renneboog 2008).
Access of companies to capital markets
Specificities of emerging markets include the instability of the currency exchange therefore increasing the risk of the investor. Despite, high inflation pressures deriving from high GDP growth, governments seem to be unwilling to control it by implementing the needed monetary policies. Moreover, there are considerable problems when referring to the banking system more specifically in the lending business. These countries tend to have policies of connected lending where credit is given based on the
19 connections possessed by the individual rather than in the consideration of the foreseen project or financial backgrounds. This is especially pertinent in the case of India. Finally, levels of information asymmetry tend to be higher in these environments. Screening and monitoring are especially hard to perform when majority is not detained which again enforces the market for corporate control as a means of survival.
In this case we have to ask why the targets would agree to concede majority to foreign investors. The main reason lies in the need to access financing. This is especially significant in capital-scarce emerging markets. In the past, firms that would be able to concede this access were developed economy firms (Chari, Ouimet e Tesar, Acquirer Gains in Emerging Markets 2009). Even though this trend is changing, liquidity constraints from the target increase the bargaining power of the acquirer which in turn pressures down the acquisition price, therefore allowing for higher positive abnormal returns.
2.5.2.2. Regulatory: Judicial system and its enforcement
Abnormal returns on cross-border acquisitions can partly be explained by the differences on corporate governance regulation faced by firms in different countries. There is a positive correlation between acquirer returns and targets from English legal origin judiciary systems. Contrarily, there is a negative correlation between acquirer returns and targets from French legal origin systems (R. La Porta, F. Lopez-de-Silanes and A. Shleifer, et al. 1998). This is mainly due to the fact that English origin countries are traditionally common law countries. These are known to have higher private and public enforcement (La Porta, Lopez-de-Silanes and Shleifer 2006). However, a compensation for this lack of protection may be performed through measures such as mandatory dividends and ownership concentration. This issue can be very prominent as there is a positive relation between investor protection and valuation of firms across countries (R. La Porta, F. Lopez-de-Silanes and A. Shleifer, et al. 1999). The authors have tried to coin the mindset that law does matter, but have faced some disagreement from other researchers who either disagree with the construction of a protection measure as a whole or just give alternative justifications for why common law systems are usually the ones that are more financially developed.
20
The bootstrapping hypothesis
Martynova and Renneboog (2008), have acknowledged the presence of a spillover valuation effect derived from the need of the target to abide to corporate governance regulations of the acquirer. Being in line with other authors’ research, Chari et al. (2006) prove that if the bidder has better corporate governance than the target then the prediction of an improvement of the target’s governance will drive abnormal returns up; it is perceived as value creation.
On the other hand, if the bidder has lower corporate governance we would expect to observe a reduction in the abnormal returns of the acquirer as a consequence of the decrease in corporate governance of the target. However, this has not yet been confirmed, there is no significant evidence that the acquirer’s lower governance will reduce the target or the bidder’s returns. Martynova and Renneboog (2008) have also set an alternative hypothesis which explores the possibility of the acquirer voluntarily bootstrapping his corporate levels to those of his target and thus allowing the firm to reach an optimal investor protection level and higher abnormal returns. In fact, this hypothesis is confirmed by acquirers from emerging economies. Bhagat, Malhotra and Zhu (2011), have proved that the better the corporate governance in the target’s country the higher the returns to the acquirer.
Nevertheless, on average the home country tends to have higher investor protection than the host country, thus CBAs are helping in converging corporate governance standards across borders (Rossi and Volpin 2004).
2.5.2.3. Cultural
One more issue to consider in CBAs is the cultural challenges to be faced in the post-acquisition and in the pre-transaction period. The impact of the differences in culture arises not only from institutional discrepancies but also from cultural distance (Karnani 2010). In his study on cross-border acquisitions, Mantecon (2009), states that there are several reasons for firms to face higher uncertainty levels in these transactions when compared to domestic acquisitions. Cultural differences affecting the way of doing business and might create difficulties in the integration of the target’s assets into the acquirer’s structure. This may create a resistance from the target which will create uncertainty and thus will increase the potential time of the takeover process creating a
21 larger amount of noise on the market’s reaction to the acquisition announcement (Fuller, Netter and Stegemoller 2002).
2.5.2.4. Economic growth and business trade
Emerging markets dominating position in the world’s economy is looming larger every year. While in 2011 the real GDP of developed countries was still below the values of 2007, values for the same indicator in emerging economies had already increased to almost 20% (The Economist 2011). These economies have been growing at an increasingly fast pace which ties in with high returns for investors but also an increased level of infrastructures that will benefit future investments.
Additionally, it is interesting to interpret less ordinary indicators of development such as the Global Fortune 500 ranking. Albeit, only including 47 emerging market firms in 2005, this revenue based classification already featured 95 emerging market companies in 2010 (World Bank 2011). This not only shows an evolution in terms of supply but also in terms of demand. These changes have also lifted the living standards in these countries turning them into larger consumers. Currently, emerging economies account for “46% of world retail sales, 52% of all purchases of motor vehicles and 82% of mobile phone subscriptions”. (The Economist 2011). This is especially significant if we also consider their dominant position in the consumption of commodities and inflows of foreign direct investment (FDI).
22
3. R
ESEARCH QUESTION AND HYPOTHESES
Although some research has been performed on the returns from cross-border acquisitions in emerging economies, it is still very limited. More explicitly, there is a lack of research in the returns to acquirers in emerging markets. Almost all the studies previously done only considered samples involving U.S. firms.
The literature previously examined provides us with the relevant background to further scrutinize the performance of cross-border acquisitions. This analysis will be primarily conducted by the investigation of the following main issues.
1. Do cross-border acquisitions in emerging markets:
- Create positive abnormal returns to acquirers from emerging markets?
- Create higher returns to an acquirer from a developed country than an acquirer from an emerging country?
- Create higher returns to an acquirer from a developed country than an acquirer from an emerging country when there is acquisition of control?
2. What are the main factors influencing these abnormal returns?
Although acknowledging that the main objective of this paper is to conclude on the impact of the home economy on the acquisitions in emerging markets, there are other factors that have to be taken in consideration. This stems from their relevance in explaining possible cumulative abnormal returns.
3.1. M
AIN HYPOTHESESHypothesis 1: Cross-border acquisitions in between emerging markets create positive abnormal returns to the acquirer.
As demonstrated by the analysis of prior literature, acquisitions in between emerging economies were very rare until 20 years ago but have seen an exponential increase over the past few years. Being this a recent event, not many researchers have been able to express their findings. However, more recent studies and the increase in the number of deals lead us to believe that in fact emerging economy investors perceive acquisitions in other emerging economies as good investments. As a result, it makes
23 sense to assume that an increase in the stock price of the acquirer at the time of announcement will be observed.
Hypothesis 2: Cross-border acquisitions performed in emerging markets by developed country firms are expected to earn higher abnormal returns than those performed by emerging country firms.
For many decades now, developed country firms have been the major players in cross-border acquisitions in emerging markets. However, the situation is changing. As referred in the previous hypothesis, emerging market firms have been intensifying their presence in the M&A market. Thus, it is important to assess not only their absolute performance but also their relative performance when compared with developed market firms. The benefits offered by developed economy firms are known to be substantial. According to the existing literature, developed market firms tend to have abnormally high positive returns in emerging markets especially due to the bootstrapping hypothesis which would benefit the latter more than emerging market acquirers. As a consequence, it seems reasonable to assume that developed market acquirers are in for larger abnormal positive returns than those of emerging market firms
Hypothesis 3: Deals where the acquirer gains majority control will provide higher returns.
Majority control has been proved to be especially significant in acquisitions in emerging economies. Due to the lack of investor protection, contract enforcement is less prone to take place in these countries. As a consequence, companies are generally required to have majority control in order to prevent possible issues. Furthermore, the higher the stake of the acquirer on the target the higher the impact it can have on its performance. Therefore, it is reasonable to assume that acquiring majority control in the company will increase cumulative abnormal returns.
3.2. S
ECONDARY HYPOTHESES3.2.1. CLASSICAL HYPOTHESES
Hypothesis 4: Larger acquirers earn lower positive abnormal returns than smaller acquirers
24 Several authors have reached the consensus that bidder returns and their size have an inverse correlation. As such, we expect that this will happen in our sample and thus smaller acquirers will earn larger relative returns than those of larger acquirers.
Hypothesis 5: The higher the cash percentage used in the deal, the higher the returns to the acquirer
Several studies have shown that higher cash percentage of the overall deal value, leads to higher positive abnormal returns when compared to other forms of payment. More precisely, equity financed transactions will suffer from a negative reaction from investors deriving from the equity issue thus pressuring down abnormal returns.
Hypothesis 6: Acquirers from the same industry will earn higher positive abnormal returns
Past literature has not reached an agreement on the gains of acquisitions as a means of business diversification. Although some believe this will enhance returns as a consequence of reduced volatility of cash-flows, others state that this will send a negative signal to the market as it only happens when the company has no internal growth opportunities. Horizontal acquisitions have been known to provide economies of scale, economies of scope and a better use of the targets’ assets. This expectancy of higher returns from operational gains and higher market power is translated into positive abnormal returns at the time of the announcement. Therefore, it is sound to assume that these acquisitions will have higher abnormal returns than those that are cross-industry.
Hypothesis 7: Smaller deals will earn higher relative abnormal returns than bigger ones
Although having lower absolute dollar gains, smaller deals may earn higher returns in relative terms. In fact, several authors have proved that bidder returns and size have an inverse correlation. Larger acquirers are more prone to overpay for their targets, especially in smaller deals where their stock price is likely to remain unaffected. Still, it is important to mention that overpaying represents a negative wealth transfer from the
25 acquirer to the target. Therefore, it is reasonable to assume that the larger the transaction size the lower the percentage of returns of the acquisitions.
Hypothesis 8: The acquisition of private targets provides for higher gains to the acquirers than those of public targets
It has been stated in prior literature that lower levels of information and screening on private targets entail more opportunities for acquirers to earn higher abnormal returns. This increase in returns is connected to higher risks taken when acquiring private firms. As such, we may expect to have lower abnormal returns for the acquirer when the target is a public one, his bargaining power which would drive returns upwards is reduced.
3.2.2. NEOCLASSICAL HYPOTHESES
Hypothesis 9: Acquirers from a common law country will earn higher positive abnormal returns
In prior research authors have found that there is a positive correlation between acquirer returns and targets from English legal origin judiciary systems. Opposing this, there is a negative correlation between the returns to the acquirer of targets from French legal origin. As such, it is reasonable to expect that common law countries will earn higher abnormal returns than civil law countries.
Hypothesis 10: Acquirers having the same official language as their targets will earn higher positive abnormal returns
Culture affects the way of doing business in a specific country. Language similarities may be seen as a signal of similar culture. We know that greater cultural distance may enhance resistance from the target which will increase the difficulties faced in integration. This will raise uncertainty around the acquisition performance which may in turn decrease expected returns. Thus, we may infer that acquirers with the same official language are more likely to share similarities in culture which may increase the cumulative abnormal returns at the time of announcement.
26
4. D
ATA SAMPLING CONSIDERATIONS
Cross-border acquisitions in emerging markets represent a relatively new phenomenon. Financial liberalization of many emerging economies only occurred during the 1990s and prior to this process many domestic capital markets were still undeveloped. During this decade, many economic and trade reforms were done at the national level which combined with currency speculations drove many countries into a crisis situation. As a consequence and in order not to try to bias our sample, we have decided to only consider transactions announced in 2002 or later.
In order to perform our research and respective analysis we have used data from the Thomson One Banker. This database provides access to data on public and private companies’ merger and acquisitions. Additionally, Thomson One Banker provides the date of announcement and the status roll-up for all transactions. Furthermore, it also stores information on the acquirer and target firm characteristics (Name, Nation, Public Status, Ultimate Parent Company and Primary SIC industry classification), and transaction specific information is also available (percentage of shares acquired, value of transaction).
In our research we will consider three separate samples. Sample 1 includes the transactions targeting emerging market firms and performed by Developed and Emerging country acquirers. To test the difference of the returns between emerging and developed market acquirers we create two sub-samples. Sample 2 includes observations for which both the acquirer and the target are from emerging economies; still these have to be cross-border. Finally, sample 3 includes all transactions where the acquirers are from developed economies and the targets from emerging markets.
In order to be included in the main sample, every transaction had to fulfill several criteria, the first one being that it only encompasses transactions in emerging countries performed between 01/01/2002 and 12/31/2011. The reason behind this lies in the fact that many emerging markets only started the liberalization of their capital markets in the 1990’s, as mentioned before. Secondly the deal needs to involve a share transfer of at least 5%. This will insure that the transaction is substantial, and thus relevant for our study. Moreover, in order to avoid the bias of rumors we have determined that all announcement returns refer to transactions that have now been completed. Furthermore,
27 the acquirer needs to be a public company as only in this case will we be able to observe and interpret the evolution in its stock price and hence determine the presence of abnormal returns. More specifically, there is a need for the acquirer’s shares to be traded for at least 224 trading days prior to the day of announcement. The explanation for this pre-requisite lies in the need for the stock price information in order to be able to estimate the expected returns based on the correlation of the stock and the market (this will be further discussed in the methodology section). Finally, we also need to have information on the percentage of shares transferred as well as the percentage of shares owned before and after the transaction.
4.1 D
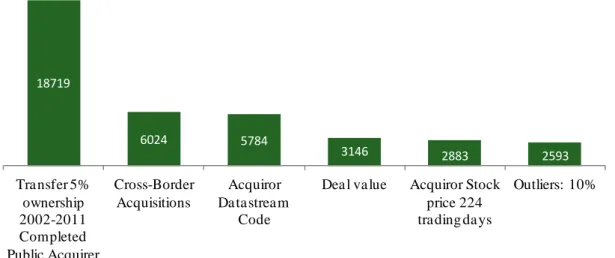
ATA SCREENS PERFORMEDAfter considering all previously mentioned parameters we obtained 18 719 deals from the Thomson One Banker with the following characteristics:
- M&A transactions with an ownership transfer of at least 5% - Period: 2002-2011
- Status of the deal: Completed - Acquirer Public Status: Public
However, filtering was still required. First, we had to make sure we were only dealing with cross-border acquisitions. For this process we started by using Thomson’s cross-border flag, and our observations dropped to 6024. Next, we had to ensure that all the acquirers in our sample had an available DataStream code. The latter is an online historical database provided by Thomson financial which stores stock price information on many financial entities that may be used for academic research (Harvard Business School 2012). In our case, this database will be used in order to obtain market indices as well as the acquirer’s stock price evolution. This trimmed our sample to 5784 observations. In a third and last step, we needed to make sure that the value of the transaction was available for all the deals which further reduced our conjoint sample to 3146 deals.
4.2 S
AMPLE CHARACTERISTICSAs referred in the prior literature review the developed country nations included in our study are those defined by the World Bank. For the emerging market economies we
28 also started from those defined by the World Bank, and filtered them by ensuring that the target and acquiring nations in our sample were both involved in at least five different transactions. In Table 1 we can see the different target and emerging countries considered in the different samples of our study.
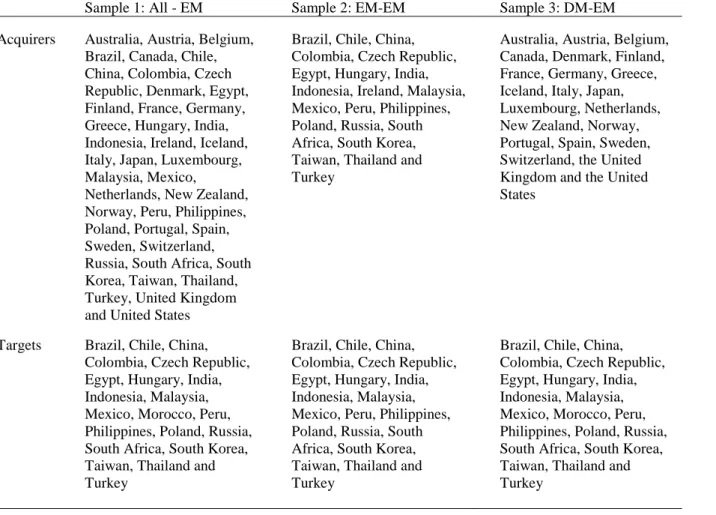
Table 1. Acquirer and Target Countries featured in the sample
Sample 1: All - EM Sample 2: EM-EM Sample 3: DM-EM Acquirers Australia, Austria, Belgium,
Brazil, Canada, Chile, China, Colombia, Czech Republic, Denmark, Egypt, Finland, France, Germany, Greece, Hungary, India, Indonesia, Ireland, Iceland, Italy, Japan, Luxembourg, Malaysia, Mexico,
Netherlands, New Zealand, Norway, Peru, Philippines, Poland, Portugal, Spain, Sweden, Switzerland, Russia, South Africa, South Korea, Taiwan, Thailand, Turkey, United Kingdom and United States
Brazil, Chile, China, Colombia, Czech Republic, Egypt, Hungary, India, Indonesia, Ireland, Malaysia, Mexico, Peru, Philippines, Poland, Russia, South Africa, South Korea, Taiwan, Thailand and Turkey
Australia, Austria, Belgium, Canada, Denmark, Finland, France, Germany, Greece, Iceland, Italy, Japan, Luxembourg, Netherlands, New Zealand, Norway, Portugal, Spain, Sweden, Switzerland, the United Kingdom and the United States
Targets Brazil, Chile, China, Colombia, Czech Republic, Egypt, Hungary, India, Indonesia, Malaysia, Mexico, Morocco, Peru, Philippines, Poland, Russia, South Africa, South Korea, Taiwan, Thailand and Turkey
Brazil, Chile, China, Colombia, Czech Republic, Egypt, Hungary, India, Indonesia, Malaysia, Mexico, Peru, Philippines, Poland, Russia, South Africa, South Korea, Taiwan, Thailand and Turkey
Brazil, Chile, China, Colombia, Czech Republic, Egypt, Hungary, India, Indonesia, Malaysia, Mexico, Morocco, Peru, Philippines, Poland, Russia, South Africa, South Korea, Taiwan, Thailand and Turkey
Although, emerging market targets and acquirers may be composed of different nations this is not a source of bias in our study as we only considered cross-border acquisitions even among emerging economies. The targeted countries simply reflect the nations where other companies believe more value will be created through acquisitions. Nevertheless, the samples are not significantly different, when it comes to emerging countries: Ireland is an emerging acquirer and not a target, Morocco is a target and not an acquirer.
The total value of the conjoint sample of transactions performed by Emerging and Developed market acquirers is greater than 469 billion USD. Even if we have a
29 significantly higher number of observations for developed market acquirers, the proportion of EM-EM and DM-EM seems to stay relatively proportional over time, as can be observed in Figure 2. This reduces the impact of the number of observations as a possible source of bias in our study.
Figure 2. Volume of announced transactions per year (number)
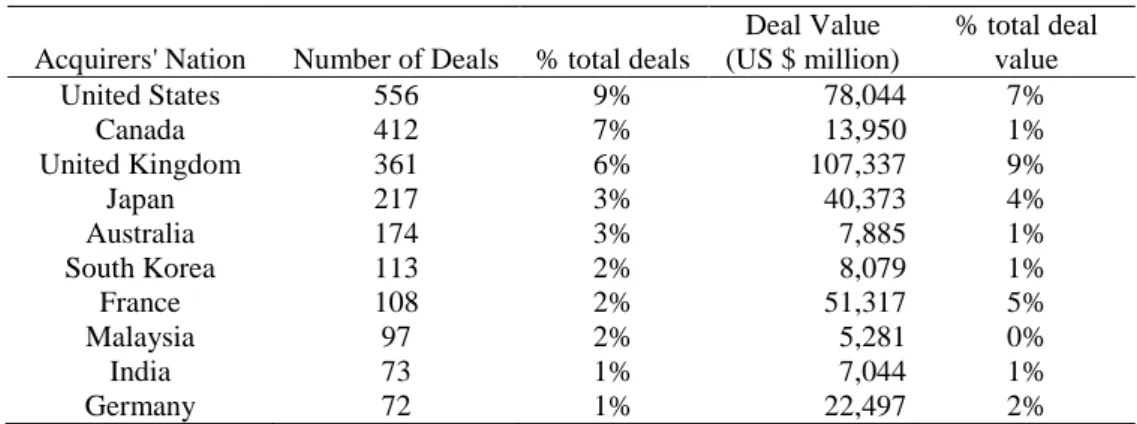
Taking a deeper look at our conjoint sample we can see a predominance of acquisitions involving developed country acquirers, however it is also interesting to note that several EM nations can still place in the top ten cross-border acquirers in emerging markets when considering the total number of deals (table 2).
Table 2. Distribution of Top 10 Acquirer Nations (EM & DM)
Acquirers' Nation Number of Deals % total deals
Deal Value (US $ million) % total deal value United States 556 9% 78,044 7% Canada 412 7% 13,950 1% United Kingdom 361 6% 107,337 9% Japan 217 3% 40,373 4% Australia 174 3% 7,885 1% South Korea 113 2% 8,079 1% France 108 2% 51,317 5% Malaysia 97 2% 5,281 0% India 73 1% 7,044 1% Germany 72 1% 22,497 2%
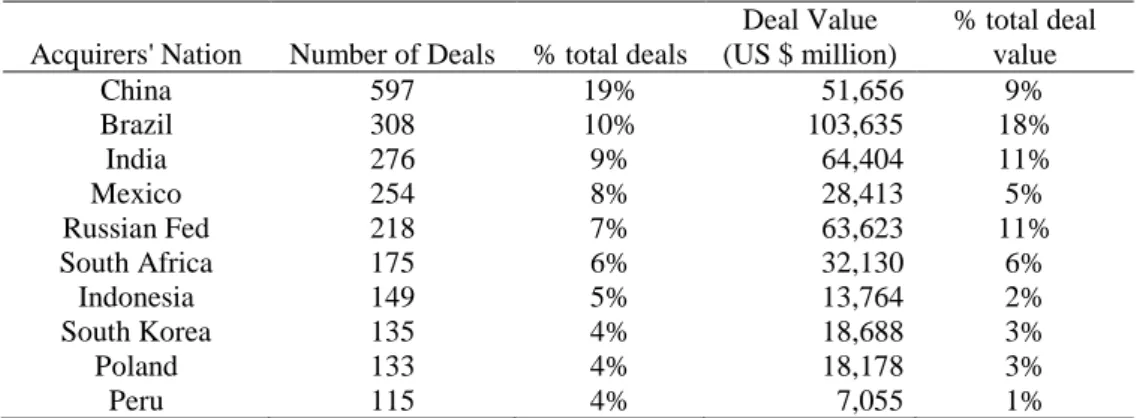
In terms of target nations we can notice that China is the target with the most acquisitions by number (9%). In spite of this, it is interesting to observe that although Brazil has a lower number of deals it is the target with the highest percentage of total deal value, as can be seen in the table below. Although it may seem that the targeted
117 164 190 190 273 285 270 237 235 214 41 49 73 92 85 81 72 55 97 63 0 50 100 150 200 250 300 350 400 2002 2003 2004 2005 2006 2007 2008 2009 2010 2011
30 nations have a more concentrated distribution, we have to keep in mind that this may be related to the fact that we have 43 possible acquirer nations but only 20 emerging targets.
Table 3. Distribution of Top 10 Target Nations (EM)
Acquirers' Nation Number of Deals % total deals
Deal Value (US $ million) % total deal value China 597 19% 51,656 9% Brazil 308 10% 103,635 18% India 276 9% 64,404 11% Mexico 254 8% 28,413 5% Russian Fed 218 7% 63,623 11% South Africa 175 6% 32,130 6% Indonesia 149 5% 13,764 2% South Korea 135 4% 18,688 3% Poland 133 4% 18,178 3% Peru 115 4% 7,055 1%
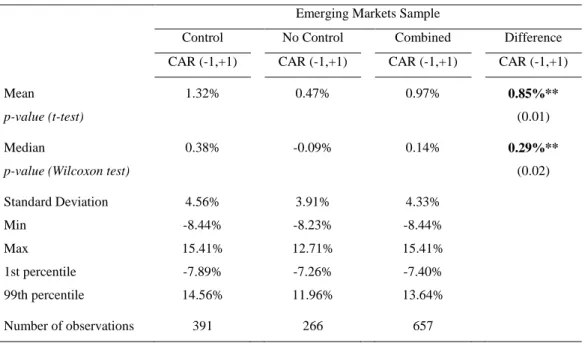
Table 5 comprises some firm and deal characteristics of our sample. The industry distribution of these deals shows a greater percentage of both acquirers (25.6%) and targets (26.3%) in the materials sector. All other industries only account for approximately 10% or less of the total sample. The data on the table also shows that DM acquirers tend to perform acquisitions of higher value but are also generally of larger size (market capitalization) than EM acquirers. Furthermore, both EM and DM tend to acquire control, as reflected in the table majority control was obtained in more than 60% of the observations of our sample. Lastly, there is no specific tendency in terms of diversification; approximately 50% of the acquisitions are performed in the same industry sector.
31 Table 4. Summary Statistics for firm and deal specificities
Sample 1 Sample 2 Sample 3
All acquirers in EM EM Acquirers in EM DM Acquirers in EM
Firm and deal characteristics
Median transaction size ($M) 20.335 16.7 22.5
Median acquirer market capitalization ($M) 1464.6 826.2 2002.4
Control acquired (%) 64.20% 60.31% 65.52%
Public target (%) 16.34% 19.49% 15.31%
Diversifying Acquisition (%) 52.58% 56.64% 51.26%
Mean Acquirer CAR (%) 0.75% 0.97% 0.67%
Mean Acquirer CAR with control acquired (%) 0.94% 1.32% 0.83%
Acquirer macroeconomic industry
Consumer Products and Services 5.27% 3.53% 5.84%
Consumer Staples 9.12% 13.14% 7.82%
Energy and Power 8.05% 7.63% 8.18%
Financials 13.28% 13.42% 13.24%
Government and agencies 0.00% 0.00% 0.00%
Healthcare 4.82% 3.67% 5.20%
High Technology 9.78% 11.30% 9.29%
Industrials 11.45% 14.41% 10.48%
Materials 25.63% 16.53% 28.60%
Media and Entertainment 3.05% 3.25% 2.99%
Real Estate 2.01% 1.41% 2.21%
Retail 2.74% 4.10% 2.30%
Telecommunications 4.79% 7.63% 3.86%
Target macroeconomic industry
Consumer Products and Services 5.79% 3.53% 6.53%
Consumer Staples 8.64% 12.71% 7.31%
Energy and Power 8.26% 7.06% 8.64%
Financials 11.00% 11.86% 10.71%
Government and agencies 0.03% 0.00% 0.05%
Healthcare 4.65% 3.53% 5.01%
High Technology 9.33% 10.03% 9.10%
Industrials 12.28% 14.69% 11.49%
Materials 26.33% 18.79% 28.78%
Media and Entertainment 3.43% 3.81% 3.31%
Real Estate 2.32% 2.12% 2.39%
Retail 3.36% 4.94% 2.85%
Telecommunications 4.58% 6.92% 3.82%
The table summarizes the transactions involving publicly listed acquirers from Developed and Emerging Economies and public and private targets in Emerging Economies announced between 2002 and 2011. The CARs were estimated using US$ denominated returns and a three -day event window. The control acquired is a dummy variable that reflects whether the acquirer holds an absolute majority of the target, 50% or more, after the acquisition that he did not hold before. Diversification is a dummy variable that reflects whethe r the acquirer has the same three-digit SIC industry code as the target.
To further analyze our data, we have had to use a statistical software program, STATA. However, after inserting the data on DataStream we needed to ensure the
32 availability of the acquirer stock prices for at least 224 days prior to announcement as mentioned before, this drops the sample down to 2883 deals. Out of these transactions, 708 were performed by emerging market acquirers and 2175 were performed by developed market acquirers.
Lastly we have used the information on the 5th and 95th percentile given by STATA in order to remove the outliers from our sample and thus finish the cleaning process. In the end, we have a total number of 2593 deals (Sample 1) and our sub-samples are composed of 657 transactions for emerging market acquirers (Sample 2) and 1936 transactions for developed market acquirers (Sample 3). The sum-up of all the cleaning steps can be observed in the figure below.
Figure 3. Sample cleaning-up stages
18719 6024 5784 3146 2883 2593 Tra nsfer 5% ownership 2002-2011 Completed Public Acquirer Cross-Border Acquisitions Acquiror Da ta strea m Code
Dea l va lue Acquiror Stock price 224 tra ding da ys
33
5. M
ETHODOLOGY OF EVENT STUDIES
:
CUMULATIVE
ABNORMAL RETURNS
(CAR
S
)
Event studies were originally introduced in 1968 by Ball and Brown and in 1969 by Fama, Fisher, Jensen and Roll. It is the simplicity of this model that has attracted the literature and the model has been of use in different fields ever since. Although, some minor changes have been made as a consequence of advancements in research, the core methodology remains identical (Corrado 2011)
An event study is a statistical approach which is performed in order to try to estimate the stock market reaction to a specific and well defined announcement (earnings, acquisitions, mergers). Due to this announcement there will be a change in the stock price of the company which reflects an abnormal return (Serra 2002). This variation will be done in agreement with the expected stream of future profits stemming from this acquisition in particular (Duso, Gugler and Yurtoglu 2010). From this we can infer that a positive return at the time of announcement reflects an assessment of value creation resulting from the transaction.
Event study methodology finds great support in the efficient market hypothesis. Together with the concept of abnormal returns, the belief that stock prices rapidly adjust to the new information available in the market are crucial assumptions of this model (Fama, et al. 1969). This may be of some concern, as it is this much criticized belief that will allow us to assume that the changes in the stock price inside the event-window are only caused by new available information.
Nevertheless, this model allows us to compare several announcements in different time periods in order to assess their value creation. Thus, it seems to be perfect for our study considering that we intend to do a comparison between emerging and developed acquirers involving emerging market targets.
5.1. C
OMPUTING THECAR
S-
IN THEORYThe returns on the stock price on a given date ( ) are said to be influenced by two different forces, the market returns ( ) and the firm-specific return that cannot be explained by the correlation between the stock and the market index ( ):