Econ. aplic., São paulo, v. 11, n. 2, p. 189-208, abril-junho 2007
reginaldo pinto nogueira Junior§
resumo
O artigo apresenta evidência sobre o exchange rate pass-through (ERPT) para um grupo de economias emergentes que adotaram o regime de metas inflacionárias. Algumas economias desenvolvidas também são analisadas para efeito de comparação. O ERPT é estimado por meio de um modelo ARDL para preços ao consumidor e ao produtor. Os resultados mostram uma forte redução do ERPT para ambos os índices de preços, após a adoção do regime de metas. A queda observada, porém, não significa que o ERPT tenha sido totalmente eliminado, em especial no longo prazo.
palavras-chave: metas inflacionárias, pass-through, economias emergentes.
abstract
The paper presents evidence on exchange rate pass-through (ERPT) for a set of emerging markets before and after the adoption of Inflation Targeting (IT). Some developed economies are also analysed for comparison. We use an ARDL model to estimate the short-run and the long-run effects of depreciations on consumer and producer prices. The results show that ERPT has declined after IT for both price indexes. Nonetheless, this reduction does not mean that ERPT is no longer existent, especially over the long-run.
Key words: inflation targeting, pass-through, emerging markets.
Jel classification: E31, E52, F31, F41.
* I would like to thank Miguel León-Ledesma and two anonymous referees for many useful suggestions. Usual disclaimer applies.
§ address for correspondence: University of Kent at Canterbury. Keynes College. Department of Economics. CT2 7NP. Canter-bury. Kent. United Kingdom. E-mail: rpn4@kent.ac.uk.
1 I
ntroductIonFollowing the mid-1990s exchange rate crises, many emerging markets have opted to change the focus of their monetary policy from targeting the exchange rate to targeting inflation.1 This option has been analysed by many economists in the past few years, and the general view is that it brings important challenges for their central banks, due to fiscal dominance, lack of institutional credibility and high exchange rate pass-through (ERPT). In this paper we look at the relevance of ERPT for some emerging markets that adopted Inflation Targeting (IT).
There is a vast literature on ERPT,2 and the importance given to the issue has increased after IT. Some authors, such as Calvo and Reinhart (2000), Goldfajn and Werlang (2000) and Schmi-dt-Hebbel and Tapia (2002), have shown that ERPT is higher for emerging than for developed economies.3 The problem of having a high ERPT is that it implies a greater difficulty for their attainment of the inflation targets (Fraga, Goldfajn and Minella, 2003).
Various studies have shown that ERPT has declined in recent years, particularly in developed economies. As this decline has coincided with significant falls in the level of inflation, researchers have examined whether the degree of ERPT is related to the inflation environment.4 Taylor (2000) was the first to demonstrate how nominal rigidities in a low-inflation environment could result in low ERPT. Evidence of this link was provided by Campa and Goldberg (2005) and Gagnon and Ihrig (2004) for developed economies, and by Choudhri and Hakura (2006) and Ca’Zorzi, Hahn and Sanchez (2006) for emerging markets.5 Others justifications for the decline in ERPT include those of Mishkin and Savastano (2001), Eichengreen (2002) and Schmidt-Hebbel and Werner (2002) that argued that credibility gains from the adoption of IT were responsible for keeping low inflation expectations following depreciations. In this sense, it is clear that there are at least two channels through which the adoption of IT may lead to lower ERPT, as under this framework we expect inflation to be lowered and stabilized and the central bank to gain credibility as an infla-tion-fighter.6
The objective of this paper is to present new empirical evidence regarding ERPT in five emer-ging markets that adopted IT (Brazil, Mexico, South Korea, South Africa and Czech Republic). We are interested in analysing two basic aspects of this issue: (i) whether ERPT is an important determinant of inflation in the short-run and in the long-run for these countries; and (ii) whether this effect has indeed decreased after the adoption of IT. To answer these questions we use an auto-regressive distributed-lag model (ARDL) to estimate the short-run and the long-run ERPT before and after the adoption of IT. We also analyse ERPT for three developed economies that adopted IT (Canada, Sweden and United Kingdom), in order to compare results and hence to provide some evidence with respect to the hypothesis that ERPT is higher for emerging than for developed
eco-1 For a general view on Inflation Targeting regimes see Svensson (1999). For an introduction on Inflation Targeting in emerging markets see Mishkin (2000).
2 For an overview on the issue, see Goldberg and Knetter (1997).
3 According to Eichengreen (2002) the main reason for a higher ERPT in emerging markets lies on the lack of credibility of their monetary authorities, which leads to a general belief among agents that temporary exchange rate shocks are indeed perma-nent.
4 In the case of Brazil the literature has discussed the roles of the adoption of a floating exchange rate and of the 1998 recession, to explain the low ERPT observed following the 1999 currency depreciation.
5 Another explanation for this finding is suggested by Goldberg and Campa (2005) that argue that ERPT has declined due to a profound change in the composition of the imports’ bundle.
nomies. We also check ERPT given different price indexes. This evidence sheds some light on the relevance of ERPT for emerging markets adopting the IT framework.
Our results show wide differences in ERPT across price indexes, as this effect seems to be much higher for producer prices than for consumer prices. Furthermore, they show that ERPT has declined for both price indexes after IT for most economies analysed. However, ERPT still seems to be an issue for the achievement of the inflation targets. Regarding the hypothesis that ERPT is higher for emerging than for developed economies we find mixed results: it seems to be the case for consumer prices, but not for producer prices, for which we find similar results between our sample of developed and emerging markets.
The remainder of the paper is structured as follows. Section 2 briefly discusses the issues of ERPT in IT regimes. Section 3 shows some Granger causality tests between inflation and exchan-ge rate chanexchan-ges. Section 4 shows the modelling strategy. Section 5 presents the results. Finally, section 6 concludes.
2 erpt
andInflatIontargetIngExchange rate pass-through into inflation (ERPT) can be defined as the change in local currency domestic prices resulting from 1% change in the exchange rate. According to Campa and Goldberg (2005), ERPT studies consider the extent to which exchange rate movements are passed into traded goods prices, versus absorbed in producer profit margins. Most of the studies on this issue focus on changes in import prices following exchange rate movements. Campa and Goldberg (2005) have explained that the basic procedure of this literature is to estimate a local currency im-port prices equation that captures movements of the exchange rate, foreign price of imim-ports and domestic demand of the destination market (normally real GDP). Ganapolsky and Vilan (2005) observe that the literature supports the hypothesis of partial ERPT, which means that only a por-tion of the exchange rate movements are translated into higher domestic prices.
Calvo and Reinhart (2000) have used a VAR model of exchange rate and inflation, and pre-sented evidence that ERPT is considerably higher for emerging markets than for developed eco-nomies. Using an Error Correction Model, Hausmann, Panizza and Stein (2001) found similar results. Nonetheless, this evidence is challenged by Ca’Zorzi, Hahn and Sanchez (2006) that used a VAR model and found no evidence that ERPT is higher in emerging markets with moderate rates of inflation than in developed economies.
lower correlations between inflation and exchange rate changes for Brazil, Mexico and Chile in the second half of the 1990s.
There have been some studies on the causes of this decline in ERPT. Using staggered price setting behaviour Taylor (2000) showed that firms tend to change prices more often when cost changes are perceived to be more persistent. In this case when inflation is high, ERPT tends to be high as well.7 This view, as expressed by Campa and Goldberg (2005) is that the pass-through of costs into mark-ups is endogenous to a country’s inflation performance. This hypothesis has been confirmed empirically by Choudhri and Hakura (2006), Baqueiro, Diaz de Leon and Torres (2003), Gagnon and Ihrig (2004) and Ca’Zorzi, Hahn and Sanchez (2006).
Leiderman and Bar-Or (2000), Eichengreen (2002), Mishkin and Savastano (2001) and Sch-midt-Hebbel and Werner (2002) have argued that the declining ERPT is a by-product of credibility gains of monetary policy. According to them, credible monetary authorities are expected to act according to the inflation stability objective, which keeps low inflation expectations even in the advent of a large depreciation. In this sense, Levin, Natalucci and Piger (2004) actually suggest that measuring the degree of ERPT would be an indirect assessment of central bank credibility.
From the discussion above it is possible to observe that ERPT is an important issue under IT, as exchange rate movements have serious inflationary implications. However, the literature ack-nowledges that there might be some channels through which the adoption of IT can lead to lower ERPT: this would be the case when inflation is lowered and stabilized and the central bank gains credibility.
3 g
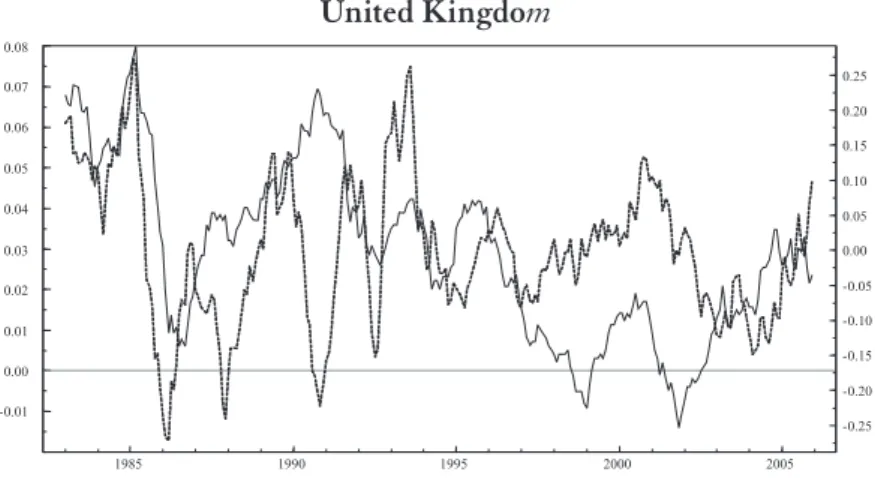
rangercausalItytestsFigures 1 and 2 plot respectively the exchange rate movements and the consumer and the producer price inflations for the economies under consideration. In general they show a close link between exchange rate changes and inflation, particularly for producer prices. The figures also su-ggest that the relationship between exchange rate movements and inflation is stronger in emerging markets than in developed economies. Nonetheless, Sweden seems to have a stronger correlation between inflation and exchange rate than the other two developed economies analysed. As a gene-ral point, exchange rate changes seem to precede the evolution of both measures of inflation over time. It is particularly clear for emerging markets.
To provide a robust analysis of the relationship between inflation and ERPT, we start ap-plying some Granger causality tests, thus checking whether inflation causes exchange rate changes, or if is it exchange rate changes that causes inflation. The test involves estimating the following reduced form VAR:
1 1
n n
t i t i i t i t
i i
p p− e−
= =
∆ =
∑
φ ∆ +∑
χ ∆ + ν (1)1 1
n n
t i t i i t i t
i i
e e− p−
= =
∆ =
∑
θ ∆ +∑
δ ∆ + ς (2)where∆pis the change in the price index, and ∆e is the exchange rate change. The terms ν and
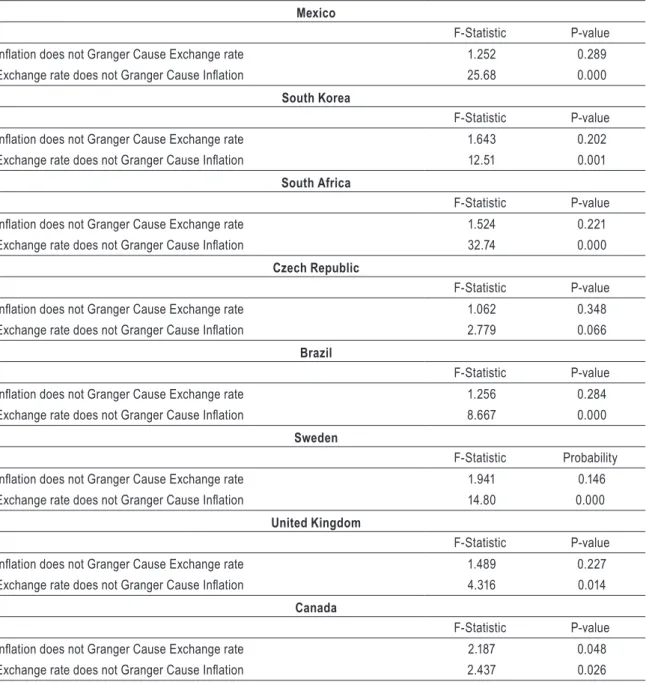
ς are disturbances. We used the Schwarz information criterion to determine the lag length. The results of the Granger causality tests for consumer prices are shown in Table 1 and the re-sults for producer prices are shown in Table 2. For all the economies under consideration we found evidence of unidirectional causality from exchange rate changes to both inflation measures, as the estimated coefficients on lagged exchange rate changes in equation (1), are statistically different from zero as a group, and the set of estimated coefficients on lagged inflation in equation (2) is not statistically different from zero.8 The only exception is the result using Canadian producer prices, when bi-causality was found.
These results have interesting implications in showing that indeed there is an inflationary channel running from exchange rate changes, thus reinforcing the importance of analysing the degree of ERPT. They also show that there is no evidence of endogeneity between inflation and exchange rate, thus suggesting that a single equation model, in the line of those of Campa and Goldberg (2005), Gagnon and Ihrig (2004) and Choudhri and Hakura (2006) should provide robust estimates of ERPT. Following this, in the next section we develop an ERPT model in line with the cited literature.
4 m
odellIngerpt
4.1 a simple model
The standard specification used in the literature on ERPT is based on the pricing behaviour of import prices from a microeconomic point of view. In this sense we start analysing a simple static profit-maximization problem faced by an exporting firm.9
Let us consider a foreign firm that exports its product to the domestic country. The exporting firm solves the following profit-maximization problem:
1
maxp =e pq C q− − ( ) (3)
where p denotes profits in foreign currency, e is the exchange rate in terms of units of domestic currency per unit of foreign currency, p is the price of the good in domestic currency, c is the cost function, and q denotes quantity. Solving (3) yields the following first-order condition:
q
p=eC m (4)
where Cq is the marginal cost, and m is the mark-up of price over marginal cost.10 Equation (4) emphasizes that the local currency price of the good can vary as a result of a change in the ex-change rate, a ex-change in the firm’s marginal cost, and a ex-change in the firm’s mark-up. Note that
8 The economic theory suggests that indeed inflation should cause exchange rate changes, following the Purchase Power Parity theory. However, given the nature of high frequency data, and the short sample period, it is difficult for the tests to capture the long-run relationship between the variables.
9 See Goldberg and Knetter (1997). 10 The mark-up can be further defined as
1 h m =
the firm’s mark-up can change independently of the exchange rate. As observed by Bailliu and Fujii (2004) a change in the cost of a locally provided input (in the foreign country) can shift the marginal cost; also, demand shocks in the importing country can alter the exporter’s mark-up. As a consequence, it is important to take into account movements in these other determinants of the price when estimating ERPT in order to properly isolate the effects of exchange rate changes on import prices (Goldberg and Campa, 2005).
A log-linear reduced-form equation may be expressed as follows:
*
t t t t t
p = α + l + βe p + φ + ey (5)
wherep*and y are measures of the exporter’s marginal cost and the importing country’s demand conditions, respectively. The coefficient l thus measures ERPT. As discussed in Goldberg and Knetter (1997) variants of (5) are widely employed in the empirical literature.
In adapting (5) to be suitable for estimating ERPT at the consumer price level, there are several issues to be considered.11 First, the aggregate price level and the exchange rate may follow non-stationary processes. It is a common procedure to use a specification with these variables in differences. In addition to this, the literature on inflation dynamics has emphasized the need to ac-count for inertial behaviour. Finally, Goldberg and Campa (2005) argue that the best proxy of the importing country’s demand conditions is the real output. This means that the literature usually ends-up estimating a backward-looking Phillips curve of the form:12
1
*
t t t t t t
p p− e p y
∆ = α + γ∆ + l∆ + β∆ + φ∆ + e (6)
In the next subsection we develop equation (6) into a proper econometric specification, used to estimate ERPT into both consumer and producer prices.
4.2 empirical specification and data
In estimating ERPT we follow the model discussed above, and propose an autoregressive distributed-lag model (ARDL) for inflation that includes the nominal exchange rate change, the inflation persistence, import price inflation and the output growth.13 The use of the ARDL model is justified by the fact that it makes possible to easily assess ERPT both in the short-run and in the long-run, the latter being defined as the static equilibrium solution, an approach advocated by Banerjee et al. (1986) and further developed by Pesaran and Shin (1999). Another advantage of this specification is the consistency and efficiency of estimates in the presence of endogenous regres-sors. Moreover, bearing in mind that standard unit root tests are susceptible to misleading results, Pesaran and Shin (1999) show that ARDL models yield consistent estimates of the coefficients irrespective of whether the underlying regressors are I(1) or I(0), thus providing robustness to the results.14 The model takes the form below:
11 See Bailliu and Fujii (2004).
12 See Choudhri and Hakura (2006), Campa and Goldberg (2005), Gagnon and Ihrig (2004), and others.
13 We have opted to use output growth instead of some output gap measure when estimating the model in order to avoid using ad-hoc de-trending processes that might eliminate information from the data. Nevertheless, we also estimated the model using HP-filtered and Band-Pass filtered output gap. The results were remarkably similar, and we have opted to show here just those obtained using output growth.
1 0 0 0
*
n n n n
t k t k k t k k t k k t k t
k k k k
p p− y − e− p−
= = = =
∆ = α +
∑
γ ∆ +∑
φ ∆ +∑
l ∆ +∑
β ∆ +e (7)where ∆p is the change of the price index, Δy is the output growth, Δe is the change of the nomi-nal exchange rate, ∆p*is the change in the foreign price of imports, and eis a stochastic error term. The model was estimated by OLS. We used a general-to-specific approach to determine the lag length of the variables.
ERPT is defined as the coefficient of the lagged exchange rate change. The short-run effect is the increase in prices following a depreciation episode that happened in no more than one lag-ged month. The long-run effect, or static solution, corresponds to the expected value after all the dynamic adjustment has taken place. We can think of the coefficients as short-run and long-run multipliers.
As mentioned before, we collected data for eight countries that adopted IT and that may be divided into two groups: the first one comprises developed economies (Canada, United Kingdom and Sweden), and the second one is composed of emerging markets (Brazil, Czech Republic, Mexi-co, South Africa and South Korea). The period of estimation corresponds to the interval that spans from 1983M1 to 2005M12 for the developed economies, and 1991M1 to 2005M12 for the emerging markets. For Brazil the period of estimation is 1995M7 to 2005M12, and for the Czech Republic it is from 1994M1 to 2005M12.15 We created two sub-samples, with sample break dates chosen inde-pendently for each country, based on the official adoption of IT by the central banks. Note that all the countries adopted IT towards the middle of its sample period, as observed in Table 3.
Data was obtained from the IMF International Financial Statistics database. We use the con-sumer and the producer price indexes. Exchange rate data is the change of the national currency per unit of dollar (average of the month). A positive variation means depreciation of the national currency, and a negative one means appreciation. As a proxy of monthly output growth we have used the rate of growth of the industrial production index.16 Foreign price of imports are the chan-ges in the series of unit value of imports (in dollars). This data was not available for South Africa, Mexico and Czech Republic, so the international commodities price index (also in dollars) was used as a proxy of the foreign costs faced by the importers. The data is in logarithms.
5 r
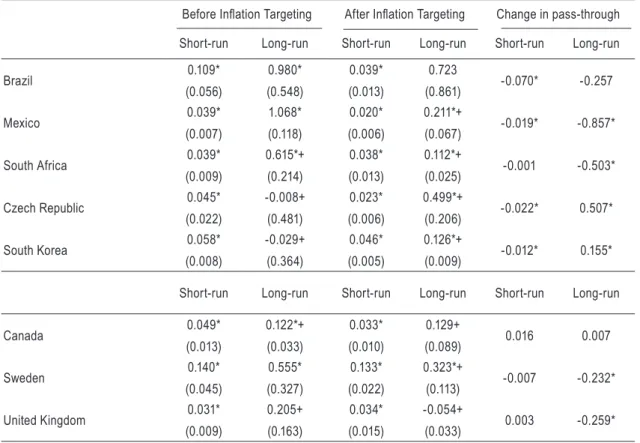
esultsAs discussed in the methodology, we estimated the ARDL model by OLS, using a general-to-specific approach to determine the lag length of the variables. The results of the estimates of the short and long-run ERPT using consumer prices inflation are shown in Table 4. The results using producer prices inflation are shown in Table 5.
For the countries under consideration we overwhelmingly reject complete ERPT into both consumer and producer prices in the long-run, particularly after IT. This result is in line with previous findings of the literature. Furthermore, the degree of ERPT varies substantially across
15 The shorter period for the emerging market economies is due to data availability. In the case of Brazil we have opted to exclude hyperinflation data, thus starting our analysis in 1995M7.
price indexes. Indeed, the estimates for producer prices inflation are larger than the estimates for consumer prices inflation. As observed by Bailliu and Fujii (2004), it may reflect the different composition of these indexes. Producer price indexes are driven mainly by prices of tradable goods, whereas consumer price indexes have a more ample distribution between tradable and non-tradable goods.17
We observe a dramatic decline of ERPT into both consumer and producer prices for Mexi-co and South Africa. For the former Mexi-country we can’t reject the hypothesis of Mexi-complete long-run ERPT before IT for both price indexes, but are able to do so after the regime change. In the case of South Africa we did not find evidence of complete long-run ERPT before IT, but it was still very high: a depreciation of, say, 10% would lead in the long-run to an inflation of around 6% for both the producer and the consumer prices inflation. After IT a currency depreciation of 10% would lead to 1% inflation in consumer prices, and 3% inflation in producer prices.
Brazil’s results also show an important decline in ERPT. Nonetheless, we can’t reject the hy-pothesis of complete long-run ERPT into consumer and producer prices in both periods. However, the decline in ERPT into producer prices is statistically significant both in the short and long-run, as we can reject the hypothesis that the coefficients are the same before and after IT. In the case of ERPT into consumer prices inflation, the decline of the short-run coefficient is statistically signi-ficant, and although the long-run coefficient decline isn’t, we can’t reject the hypothesis that it is equal to zero.
ERPT estimates for Czech Republic and South Korea go in an opposite direction, as they show an increase after IT. This result may be related to the fact that IT was adopted just after the main crises faced by those economies in 1997-1998. In fact, looking at the graphs of inflation and exchange rate for these countries allow us to observe that the correlation between inflation and ex-change rate seems to be stronger in the immediate period after the crises, and consequently around the adoption of IT. In order to check this hypothesis we also estimated ERPT for these countries excluding the year 1998, thus considering the second sample to be 1999M1 to 2005M12 for both countries. The results give some support to this hypothesis, indicating that ERPT estimates of the second period excluding 1998 are lower than those obtained when that year is included.18
We can compare the results found for the emerging markets with those of the developed economies. We also capture a decline in ERPT after IT for the developed economies, which is consistent with the findings of Gagnon and Ihrig (2004) and Campa and Goldberg (2005). The lo-wer ERPT found was that of the United Kingdom, and the higher was Sweden’s. In fact, Sweden’s ERPT is well higher than those of the other two developed economies, being closer to that of emerging markets.19 This finding may be explained by the fact that Sweden’s economy is smaller and more open than those of the United Kingdom and Canada. Nevertheless the results show a statistically significant reduction in ERPT for Sweden. As a matter of fact, before IT we can’t reject the hypothesis of complete long-run ERPT into both price indexes for this country, but after IT we can.
17 Another explanation is that central banks under IT follow targets for the consumer prices inflation, and not to producer prices inflation. In this sense they react strongly to deviations of consumer prices inflation from the target. Once the central bank’s credibility as an inflation-fighter is built, the market may take the central bank’s actions under account and reduce the pass-through of cost increases to consumer prices, including those coming from the exchange rate.
18 The exception is the case of South Korea’s ERPT into consumer prices inflation, which is relatively invariant with respect to the exclusion of 1998. The long-run ERPT respectively into consumer and producer prices over 1999M1 to 2005M12 for Czech Republic (standard errors in parenthesis) are: 0.116 (0.019) and 0.113 (0.110). For South Korea the results are: 0.082 (0.029) and 0.402 (0.275).
Regarding the hypothesis that emerging markets have higher ERPT in comparison to deve-loped economies, as proposed by Calvo and Reinhart (2000), Goldfajn and Werlang (2000), Fraga, Goldfajn and Minella (2003) and others, we found mixed results. It seems to be the case with res-pect to consumer prices inflation, but not to producer prices inflation, as for this index we found a similar ERPT for both emerging and developed economies. Even when Sweden’s results are not taken into account this finding holds.20 This is consistent with Ca’Zorzi, Hahn and Sanchez (2006) that presented evidence of a similar ERPT for developed economies and emerging markets with moderate rates of inflation.
As discussed before, the reduction of ERPT after the adoption of IT may be a benign effect of the monetary policy change. The literature on this issue acknowledges the importance of the inflation environment and the monetary policy credibility in determining ERPT. It means that when inflation is lowered and stabilized and the monetary policy gains credibility, ERPT will face a decrease.
Summing up, the estimates presented here give some support to the view that ERPT has declined after IT. The results offer only partial support to the hypothesis that ERPT tends to be higher for emerging markets in comparison to developed economies. Finally, even though ERPT has declined in most economies analysed, it did not disappear completely, therefore remaining a factor that central banks must take into account when setting monetary policy.
6 c
onclusIonIn this paper we presented evidence on exchange rate pass-through (ERPT) for a set of de-veloped and emerging market economies. We carry out our analysis comparing the period before and after the adoption of the Inflation Targeting (IT) regime. We ask if this regime change was followed by a decrease of ERPT into domestic inflation, and thus to what extent ERPT is an issue for the attainment of the inflation targets.
The results show that ERPT has decreased after the adoption of IT for most of the economies in our sample for both consumer and producer prices. Moreover, the results show that the respon-se of producer prices inflation to exchange rate changes is higher than that of consumer prices inflation. Nevertheless, ERPT did not disappear completely for the economies analysed, and still appears to be a significant variable driving inflation over the long-run.
references
Amitrano, A.; De Grauwe, P.; Tullio, G. Why has inflation remained so low after the large exchange rate depreciations of 1992? journal of common Market Studies, v. 35. p. 329-346, 1997.
Bailliu, J.; Fuiji, E. Exchange rate pass-through and the inflation environment in industrialized countries: an empirical investigation. Bank of Canada, 2004. (Working Paper n. 21).
Banerjee, A. et al. Exploring equilibrium relationships in econometrics through static models: some Monte Carlo evidence. oxford bulletin of Econometrics and Statistics, v. 48. p. 253-278, 1986.
Baqueiro, A.; Diaz de Leon, A.; Torres, A. Fear of Floating or Fear of inflation? The role of the exchange rate pass-through. Central Bank of Mexico, 2003. (Working Paper n. 0302).
Ca’Zorzi, M.; Hahn, E.; Sánchez, M. Exchange rate pass-through in Emerging Markets. European Central Bank, 2006. Mimeo.
Calvo, G.; Reinhart, C. Fixing for you life. NBER, 2000. (Working Paper 8006). ______. Fear of Floating. The Quarterly journal of Economics,v. 117. p. 375-408, 2002.
Calvo, G. Capital markets and exchange rate, with special reference to the dollarization debate in South-America. journal of Money, credit and banking, v. 33. p. 312-334, 2001.
Campa, J.; Goldberg, L. Exchange rate pass-through into imports prices. The review of Economics and Statistics. v. 87. p. 679-690, 2005.
Choudhri, E.; Hakura, D. Exchange rate pass-through to domestic prices: does the inflationary environ-ment matter? journal of international Money and Finance, v. 25, p. 614-639, 2006.
Eichengreen, B. can emerging markets float? Should they inflation target? Central Bank of Brazil, 2002. (Working Paper n. 36).
Fraga, A.; Goldfajn, I.; Minella, A. Inflation Targeting in emerging market economies. In: Gertler, Mark; Kenneth, Rogoff (Orgs.) nbEr Macroeconomics annual, 18. MIT Press, 2003. p. 365-400.
Ganapolsky, E.; Vilan, D. buy foreign when you can: the cheap dollar and exchange rate pass-through. Federal Reserve Bank of Atlanta, 2005. Mimeo.
Gagnon, J.; Ihrig, J. Monetary policy and exchange rate pass-through. international journal of Finance and Economics, v. 9, p. 315-338, 2004.
Goldberg, K.; Knetter, M. Goods prices and exchange rates: what have we learned? journal of Economic literature, v. 35, 1997.
Goldfajn, I.; Werlang, S. The pass-through from depreciation to inflation: a panel study. Central Bank of Brazil, 2000. (Working Paper n. 05).
Hausmann, R.; Panizza, U.; Stein, E. Why do countries float the way they float? Journal of Development Economics, v. 66. p. 387-414, 2001.
Levin, A.; Natalucci, F.; Piger, J. (2004). The macroeconomic effects of Inflation Targeting. Federal reserve bank of St. louis review, p. 51-80, July 2004.
Minella, A.; Freitas, P.; Goldfajn, I.; Muinhos, M. (2003). Inflation targeting in Brazil: constructing cred-ibility under exchange rate volatility. journal of international Money and Finance, v. 22. p. 1015-1040, 2003.
Mishkin, F. Inflation targeting in emerging-market economies. american Economic review, v. 90. p.105-109, 2000.
Mishkin, F.; Savastano, M. Monetary policy strategies for Latin America. journal of Development Econom-ics, v. 66. p. 415-444, 2001.
Pesaran, M.; Shin, Y. An autorregresive distributed lag modeling approach to cointegration analysis. In: Strom, S. (Ed.) Econometrics and economic theory in the 20th century: The Ragnar Frisch Centennial Symposium. Cambridge: Cambridge University Press, 1999.
Reyes, J. Exchange rate pass-through effect, inflation targeting and fear of floating in emerging economies. University of Arkansas, 2003. Mimeo.
Reyes, J. Exchange rate pass-through effect and Inflation Targeting in emerging economies: what is the relationship? 2007. Forthcoming in the Review of International Economics.
Schmidt-Hebbel, K.; Werner, A. inflation targeting in brazil, chile and Mexico: performance, credibility and the exchange rate. Central Bank of Chile. 2002. (Working Paper n. 171).
Svensson, L. Inflation targeting as a monetary policy rule. journal of Monetary Economics, v. 43. p. 607-654, 1999.
a
ppendIxfigure 1 – cpI Inflation and exchange rate movements
brazil
canada
mexico
south africa
sweden
united Kingdom
Notes: The graphs show the consumer prices inflation (black line, left scale) and the exchange rate (dashed line, right scale).
figure 2 – ppI Inflation and exchange rate movements
canada
czech republic
south africa
south Korea
united Kingdom
Notes: The graphs show the producer prices inflation (black line, left scale) and the exchange rate (dashed line, right scale).
table 1 – granger causality tests between cpI inflation and exchange rate
Mexico
F-Statistic P-value
Inlation does not Granger Cause Exchange rate 1.067 0.346 Exchange rate does not Granger Cause Inlation 44.04 0.000
South Korea
F-Statistic P-value Inlation does not Granger Cause Exchange rate 1.643 0.202 Exchange rate does not Granger Cause Inlation 12.51 0.001
South Africa
F-Statistic P-value
Inlation does not Granger Cause Exchange rate 1.555 0.214 Exchange rate does not Granger Cause Inlation 11.62 0.000
Czech Republic
F-Statistic P-value Inlation does not Granger Cause Exchange rate 0.959 0.386 Exchange rate does not Granger Cause Inlation 6.058 0.003
Brazil
F-Statistic P-value Inlation does not Granger Cause Exchange rate 1.826 0.165 Exchange rate does not Granger Cause Inlation 17.00 0.000
Sweden
F-Statistic Probability
Inlation does not Granger Cause Exchange rate 0.214 0.808 Exchange rate does not Granger Cause Inlation 2.345 0.098
United Kingdom
F-Statistic P-value
Inlation does not Granger Cause Exchange rate 2.165 0.117 Exchange rate does not Granger Cause Inlation 2.333 0.099
Canada
F-Statistic P-value
table 2 – granger causality tests between ppI inflation and exchange rate
Mexico
F-Statistic P-value
Inlation does not Granger Cause Exchange rate 1.252 0.289 Exchange rate does not Granger Cause Inlation 25.68 0.000
South Korea
F-Statistic P-value Inlation does not Granger Cause Exchange rate 1.643 0.202 Exchange rate does not Granger Cause Inlation 12.51 0.001
South Africa
F-Statistic P-value
Inlation does not Granger Cause Exchange rate 1.524 0.221 Exchange rate does not Granger Cause Inlation 32.74 0.000
Czech Republic
F-Statistic P-value Inlation does not Granger Cause Exchange rate 1.062 0.348 Exchange rate does not Granger Cause Inlation 2.779 0.066
Brazil
F-Statistic P-value Inlation does not Granger Cause Exchange rate 1.256 0.284 Exchange rate does not Granger Cause Inlation 8.667 0.000
Sweden
F-Statistic Probability
Inlation does not Granger Cause Exchange rate 1.941 0.146 Exchange rate does not Granger Cause Inlation 14.80 0.000
United Kingdom
F-Statistic P-value
Inlation does not Granger Cause Exchange rate 1.489 0.227 Exchange rate does not Granger Cause Inlation 4.316 0.014
Canada
F-Statistic P-value
Inlation does not Granger Cause Exchange rate 2.187 0.048 Exchange rate does not Granger Cause Inlation 2.437 0.026
table 3 – dates of adoption of Inflation targeting
Canada February 1991
United Kingdom October 1992
Sweden January 1993
Czech Republic January 1998
South Korea January 1998
Mexico January 1999
Brazil June 1999
table 4 – pass-through estimates (cpI inflation)
Before Inlation Targeting After Inlation Targeting Change in pass-through Short-run Long-run Short-run Long-run Short-run Long-run
Brazil 0.109* (0.056) 0.980* (0.548) 0.039* (0.013) 0.723
(0.861) -0.070* -0.257
Mexico 0.039* (0.007) 1.068* (0.118) 0.020* (0.006) 0.211*+
(0.067) -0.019* -0.857*
South Africa 0.039* (0.009) 0.615*+ (0.214) 0.038* (0.013) 0.112*+
(0.025) -0.001 -0.503*
Czech Republic 0.045* (0.022) -0.008+ (0.481) 0.023* (0.006) 0.499*+
(0.206) -0.022* 0.507*
South Korea 0.058* (0.008) -0.029+ (0.364) 0.046* (0.005) 0.126*+
(0.009) -0.012* 0.155*
Short-run Long-run Short-run Long-run Short-run Long-run
Canada 0.049* (0.013) 0.122*+ (0.033) 0.033* (0.010) 0.129+
(0.089) 0.016 0.007
Sweden 0.140* (0.045) 0.555* (0.327) 0.133* (0.022) 0.323*+
(0.113) -0.007 -0.232*
United Kingdom 0.031* (0.009) 0.205+ (0.163) 0.034* (0.015) -0.054+
(0.033) 0.003 -0.259*
table 5 – pass-through estimates (ppI inflation)
Before Inlation Targeting After Inlation Targeting Change in pass-through
Short-run Long-run Short-run Long-run Short-run Long-run
Brazil 0.451* (0.166) 1.295* (0.360) 0.081* (0.021) 0.599*
(0.320) -0.370* -0.696*
Mexico 0.076* (0.009) 1.013* (0.065) 0.154* (0.022) 0.261*+
(0.103) 0.078* -0.752*
South Africa 0.019* (0.006) 0.648*+ (0.155) 0.096* (0.017) 0.298*+
(0.044) 0.077* -0.350*
Czech Republic 0.124* (0.026) -0.068*+ (0.017) 0.028* (0.005) 0.116*+
(0.031) -0.096* 0.184*
South Korea 0.143* (0.009) 0.192*+ (0.040) 0.115* (0.011) 0.356*+
(0.156) -0.028* 0.164
Short-run Long-run Short-run Long-run Short-run Long-run
Canada 0.183* (0.029) 0.628*+ (0.138) 0.371* (0.030) 0.395*+
(0.094) 0.188* -0.233*
Sweden 0.464* (0.015) 0.834* (0.221) 0.546* (0.013) 0.766*+
(0.038) 0.082* -0.068*
United Kingdom 0.103* (0.015) 0.662*+ (0.134) 0.069* (0.012) 0.219*+
(0.056) -0.034* -0.443*