Wood Properties Variation of
Eucolyptus saligna Sm. From Angola
»y
RAUL MANUEL DE ALBUQUERQUE SARDINHA <Agricultural and Forestry Faculty, Uninversity of Lisbon)
J. F. HUGHES
(Uommonwealth Forestry Department University of Oxford)
RESUMO
No presente trabalho a variação na massa volúmica, no comprimento das fibras e nas dimensões transversais foi estudada para vários anéis e alturas no tronco de Eucolyptus saligna Sm. de Angola.
Foi mostrado que embora a massa volúmica revele uma tendência geral para crescer com a idade do cambio se detectam diferenças não só com as estações mas também com o nível de amostragem no tronco. Quanto ao comprimento da fibra mostrou-se que a relação comprimento da fibra-idade seguia um padrão tipo já descrito para outras espécies: rápida taxa de crescimento nos primeiros aneis próximo da medula que se vai lentamente esbatendo até se atingir um compri mento máximo. O diâmetro da fibra cresce lentamente do centro para a peri feria e decresce com a altura sendo esta tendência mais pronunciada para o diâmetro tangencial. Quanto à espessura da parede ela foi mais pronunciada nos aneis mais velhos e nos níveis mais elevados.
Apesar da grande variabilidade encontrada de árvore para árvore os modelos de correlação estudados revelaram que amostragens limitadas ao nível do DAP descreveram com elevado grau de confiança os valores médios ponderados da massa volúmica, comprimento, diâmetro radial e tangencial e a espessura da fibra bem como as percentagens de fibras e parênquima.
•
SY NO PS IS
Varation in density, fiber length and fibre dimensions were investigated for selected heights and growth rings of Eucolyptus saligna Sm. from Angola.
106 ANAIS DO INSTITUTO SUPERIOR DE AGRONOMIA
for increase, revealed some differences, not only between sites but also at diffe- rent sampling heights. The fiber length-age relationship in the trees studied conformed to the general pattem of large increases in rings near the pith, fol- lowed by a more gradual increase until a maximum was reached. Variations in fibre diameter were not great, although there was a trend for a decrease with height and an increase with age. This was more pronnouced for the tangential diameter. Thicker-walled fibres were found in older rings and also at higher leveis. Correlation analyses, used to evaluate the extend to which limited sampling gives satisfatory estimates of whole tree values, produced reliable predictive equations for density, fibre lengh, fibre radial and tangential diameters, fibre wall tickness and percentagens of fibres and parenchyma.
INTRODUCTION
Wood property variation within and among trees, has come under rather renewed interest. This has intensified as researchers have found clear relationshisps between wood density and fiber dimen- sions and various properties and uses. The more intensive studies have involved the relationships between wood density and features of the fibers and tracheids such as length, diameter and thickness of the wall and pulp properties (Frazão, 1958, Buijtene, 1969; Artuz- -Siegel et. dl. 1968; Einspahr et. dl. 1968; Marton et. dl. 1968). The main aim of this effort was to estimate wood quality for tree impro- vement programs. On which parameters should we focus attention if we are to alter benefically the properties in future generations?
As compared to softwoods, hardwoods have been poorly studied in this sense. However, increased demands for high quality hardwoods has stimulated studies in some comercially important hardwoods. Results on the variability found have been published and reviewed elsewhere (Spurr and Hyvarienen 1954, Dinwoodie, 1961, Dadswell and Watson 1962, DeZeew, 1965; Taylor, 1968 a, Taylor, 1968 b, Istas 1968, Hughes and Esan, 1969) and, hence, will not be repeated in this paper.
The work reported here on the density and some anatomical variation in E. saligna Sm. was part of a continuing study of this species in Angola. The objectives were: 1) — to increase existing knowledge of the extent of variation found within and among trees and to accumulate data that might be used to establish quality stan- dards by which the characteristics of individual trees could be eva- luated: 2) — to derive a sampling scheme which would give reliable values for comparing trees: 3) — to assess the extent to which limi ted sampling gives satisfactory estimates of whole tree values.
PROCEDURE
The study varied in the intensity of sampling according to our assessment of the relative importance of the features considered and in relation to the time involved and available for laboratory work. For density, six plots from three regional sampling areas (Sacaala, Cuiva and Malange, identified as Si, S2 and S3 respectively) were selected as representative of the high peneplain of Angola where
E. saMgna bas been extensively planted. Within each plot containing
100 trees, five trees with relatively straight erect trunks and well- -formed and healthy crowns were selected for study. Selected trees were felled and discs, 3“ in thickness, were removed at the following percentage leveis of total height: 5, 15, 35 and 65%.
Density specimens were prepared by cutting randomly, two sam- ples per levei using the north direction as the reference line. The density of each sample, extending from pith to bark, was determined by X-ray densitometry (Sardinha, 1974).
All rings at each levei were identified and provided, after eli- mination of data of some externai rings, the following five-fold classi- fication for an orthogonal analysis of variance within each site:
51 — 2 plots X 5 trees X 4 leveis X 2 radii X 11 rings 52 — 2 plots X 5 trees X 4 leveis X 2 radii X 9 rings Sa — 2 plots X 5 trees X 4 leveis X 2 radii X 8 rings All ring data was used further for weighted whole trees com-putation.
An orthogonal factorial design as shown below was used for analysis of each anatomical trait considered in this research, but only the Si site was examined.
2 plots X 5 trees X 4 leveis X 5 rings X 2 samples
Fibre radial and tangential diameter and fibre wall thickness were measured with a Leitz Laborlux microscope. Ilumination was provided by an incident light Ultropak unit and the observation and measurements, at a total magnification 500 X, were done directly on the surfaces of the specimens polished with a sanding machine as described by Lantican and Hughes (1973). As shown by the
amaly-108 ANAIS DO INSTITUTO SUPERIOR DE AGRONOMIA
tical classification used, each ring was divided into two samples because of the wide variation in cross sectional fibre dimensions observed within rings. A very large number of measurements would have been required for precise estimates of the average fibre on a vvhole ring basis.
Since morphological criteria for classification into earlywood and latewood such as Mork’s (1926), Klem (1945) or Knigge and Koltzenburg (1964) proved to be unreliable, the ring was divided into halves and in each half measurements were made in 4 contiguous cells of 6 randomly selected rows from the microscopic field of sam- pling limited to 15 cells on each side of the specimen radius. The analysis of variance of the sample size and the efficiency of sampling which determined the above strategy was described in detail by Sardinha (1974).
Laboratory measurements of percentage of vessels, fibres and parenchyma tissus were also done by a modification of the «Test Point Method» as described by Ladell (1959). A random 25 dot grid glass was attached to the microscope eyepiece, so that the images of the dots were randomly distributed in each field. The proportion of points falling on each type of cell gives the percentage of type of tissue. The counts were taken in each field where cross-sectional measurements were done.
Following measurement of ring anatomical features, the rings selected were macerated in a solution of glacial acetic and hydrogen peroxide. Samples of macerated material were mounted on microscope slides. Two slides were prepared for each sample and from each one 20 unbroken fibres were measured with a modified map measurer connected to an electronic fibre length recorder and classifier.
RESULTS
In this paper results are reported under general headings to elucidated trends of variation in wood features and to bring to the atention of the reader the contrast among the trees studied. Analysis, procedures and minutia have been reduced or deleted in favour of graphs showing the variation found. Tabular data and greater detail about the technique used and variation found may be seen in Sar dinha (1974).
Density
It is a commonly accepted fact that the secondary cambium of vvood plants undergous changes with age and these will result in variation in the wood produced at each age. The changes are parti- cularly pronounced in the juvenile wood. Examination of ring means in this study showed a general trend for density to decrease in the first two rings then to increase progressively outwards. However, this pattern of density-age relationship has to be accepted as only a very general trend since there were differences from tree to tree in the overall within tree pattern of development of density from pith outwards mainly for S2 site trees. This study also showed (Table 1) that for S, and S3 sites the interaction Age x Leveis was an important source of variation within individual trees, but the extent of its effects also varied from tree to tree. For the S2 site by contrast, we found that the interaction Age x Trees in Plots varied with leveis but the effect of Age x Leveis was similar in all trees. So, the general pattern described was apparent in all trees of Sa site at the 5 and 15% height levei but not at other leveis; in the other two sites decrease in density near the pith was not observed in all trees nor was it so marked or present in any trees at the 15% height levei.
There is no obvious explanation for this different relationship of density and age at different heights between sites. However, the variation in the pattern of the density-age relationship at various sampling heights found in other species (Gohre, 1958; Taylor, 1970) encourages acoeptance of the results of this study as realistic and to think that the deviations for S2 site are mainly due to disturbances induced by branehing.
In all three sites there was a slight increase in density upwards, with a decrease at levei 15 %, although the rate of decrease between leveis was not the same for each site. In spite of the high value of the contribution of Leveis x Trees in Plots to total variance in the S2 site, the analysis of this interaction showed that this effect was in fact due largely to two trees that showed a trend for decreasing density after the 35 % levei and by differences between trees in the variation exhibited between 5 % and 15 % height leveis. Because the number of trees with an anomalous trend was small this did not pre- clude the description of a systematic trend based on mean values for leveis.
110 ANAIS DO INSTITUTO SUPERIOR DE AGRONOMIA
The upper levei (65 % height) was for all sites statistically different from the first two (5 and 15 %).
The percentage difference between the lower leveis in S,, S2 and S:, were 6.3 %, 13.2 % and 5.9 % respectively.
TABLE I
Summary of the analyses uf variance and variance components expressed a.s a percentage of total effects for mean ring density (g/cc)
Source of variation
Si S> Sa
v/ratio compVar.
% ' v/ratio
Var.
comp% ‘ v/ratio compVar. % Plots (P) 4.98 0.87 0.87 0.00 0.00 0.00 Trees in plots (T/P) 21.01 *** 47.84 37.10*** 21.78 148.82*** 42.82 Leveis (L) 25.77 *** 5.98 16.36*** 18.82 8.32 4.96 L x P 0.50 0.43 0.32 0.00 1.95 0.66 L x T/P 2.17* 3.81 5.49*** 10.84 3.00** 2.32 Radii in L, T 2.04*** 4.14 7.26*** 4.16 3.50*** 1.66 and P Rings (Ri) 22.87*** 15.46 15.25*** 15.06 19.55 20.12 Ri x P 0.04 0.02 0.56 0.00 1.90 1.02 Ri X T/P 6.75*** 3.22 14.87*** 10.37 8.65*** 5.06 Ri X L 3.88*** 1.08 1.38 0.70 5.28*** 6.36 Ri X L x P 1.06 0.12 1.25 0.74 1.27 0.62 Ri X L xT/P 4.09 7.72 4.86*** 11.56 4.44*** 9.10 Residual 10.20 5.98 5.29
One further generalization can be made from the density data, i. e., besides the systematic trends found for variation of density with age and to a lesser degree with height, there was a considerable random source of variation due to differences between trees. This variation was marked not only by the differences in the tree mean values, but also by differences: 1) in terms of the average rates of changes in density in the radial and axial direction; 2) in terms of the magnitude of the interaction between leveis and rings.
Between site oomparisions
An analysis of weighted whole tree density was included as part of an investigation to ascertain the extent to which some environ- mental factors affect density. The results are set on table 2.
TABLE 2
Summary of the analysis of variance and variance components for weighted tree density (g/cc)
variation Source of variation V/ratic components
%
Sites (S) 5.02* 28.27
Plot in sites (P) 0.84 0.00
Trees in plots and sites (T) — 71.73
It is reasonable to assume that differences in weighted tree mean density is a reflection of the differences between trees due to the combination of the effect of the genetic make-up of each tree and its environmental conditions. This presumption is strengthened by comparing the Tukey’s test results of site density with those of ring width. 0)
It seems clear that although Si site showed a significantly higher rate of growth than S2 and the rate of growth of S3 is not statisti- cally separable from the other two, the mean site density of S3 is significantly different from the others. The low significance of the
(l)
ring width means (mm) Si Ss S* 7.89 7.72 7.57 Density means (g/ /cm3) S» 0.687 Si 0.625 S» 0.609
112 ANAIS 1)0 INSTITUTO SUPERIOR DE AGRONOMIA
rate of growth expressed by ring width was further proved by a simple regression analysis of ring density against ring width. After removal of the age affect, ring width accounted for no more than 5.6 %, 18.0 % and 8 % of the total variation in density for Slf S2 and S:1 respecti- vely. (Table 3)
TABLE 3
Correlation between density (y) and ring width (x) for all within site observations
Site %r; Regression equations with adjusted data
s, 5.6 logy = —0.17605 — 0.0888 log (x —5) F = 106.17***
s2 18.0 logy = — 0.2257 —0.04272 log (x —3) F = 127.73***
sa 00 © y =—0.8409 — 0.01365 x -r 0.00023 x= F= 48.62***
y = predicted density (g/cm3); x = ring width (mm)
Fibre dimensions
Fibre radial and tangential diameter.
The results of the analyses of variance (table 4) showed that for radial fibre diameter only the effects of Trees in Plots and Samples were significant whereas for the tangential diameter the difference between Plots for the mean value of tangential fibre diameter and the effect of Trees in Plots were significant. We also found that the differences between the mean values for rings, of fibre tangential diameter measured over all leveis, varied from plot to plot, although, its contribution to total variation was small (3.1 %). It was difficult to explain the significance of the second order interaction Rings x Leveis x Plots, which combined with non-significance of Leveis x Rings suggests a different response of rings to the effect of leveis in each of the plots.
The radial and tangential diameter-age relationship for pooled data from all trees and leveis indicated that there were no signifi cant differences between the mean values for rings when compared by a Tukey’s w-procedure test.
TABLE 4
Summary of analyses of variance and variance componentes expressed as a percentage of total effects
Source Variation
Fibre Radial
diam. Fibre tang. diam. Fibre wall thick V/ratio comp.Vai*. V/ratio comp.Vai*. V/ratio comp.Vau.
Plots 0.08 0.00 7.76* ' 15.60 3.24 6.88 Trees in Plots (T/P) 2.65* 3.43 8.52*** 10.19 23.29*** 14.71 Leveis (L) 046 0.00 4.07 2.96 2.10 0.74 L X P 3.76 3.90 1.34 0.48 1.05 0.06 L X T/P 0.57 0.00 1.33 1.79 2.42** 3.74 Rings (Ri) 0.64 0.00 2.99 4.57 32.31** 20.78 Ri X P 0.71 0.00 3.20* 3.12 1.76 0.56 Ri X T/P 0.61 000 1.05 0.33 1.13 0.42 Ri X L 0.77 0.00 1.01 1.05 0.70 1.55 Ri X L X P 1.19 1.20 2.11* 5.23 1.09 0.38 Ri X L X T/P 0.62 0.00 0.81 0.00 1.54 7.10 Samples (S) 19.81*** 7.53 0.68 0.00 11.42 10.81 S X P 0.01 0.00 0.03 0.00 6.13* 1.74 S X T/P 0.87 0.00 1.44 1.20 1.28 0.37 S X L 0.88 0.00 1.06 0.05 0.90 0.00 S X L X P 0.50 0.00 0.40 0.00 1.16 0.14 S X L X T/P 0.77 0.00 0.53 0.00 0.60 0.00 S X Ri 1.57 0.44 0.96 0.00 8.81*** 3.88 S X Ri X P 0.84 0.00 1.12 0.28 0.28 0.00 S X Ri X T/P 0.64 0.00 0.64 0.00 0.46 0.00 S X Ri X L 0.65 0.00 0.75 0.00 0.54 0.00 S X Ri X L X P 0.69 0.00 0.28 0.00 0.66 0.00 Residual — 83.10 —• 54.19 — 26.41
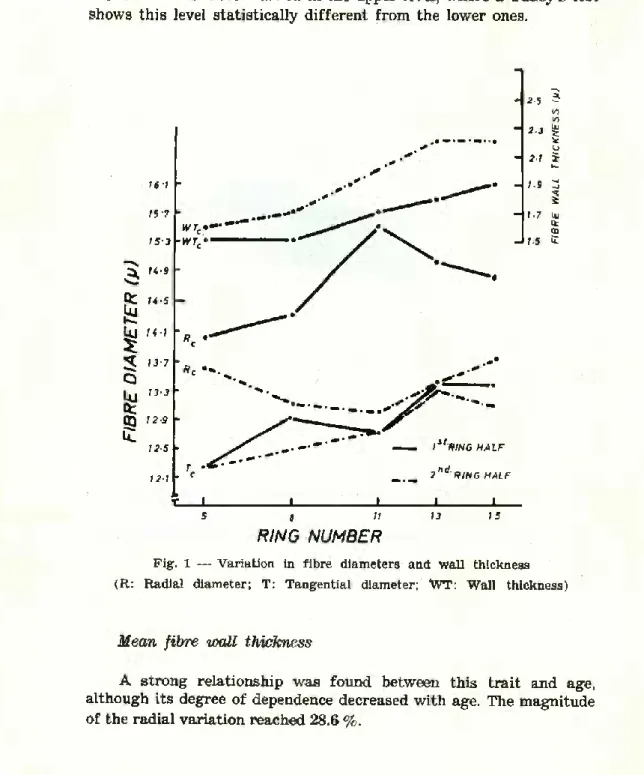
However graphing of ring means shows that the general pattern of fibre diameter was a slight increase from the pith outwards (Fig 1). Figure 1 also shows a clear distinction between the radial diameter of the fibres of the first half of the ring as compared to the second half, vrçhich reflects the relationship of radial expansion to the inten- sity of growth as suggested by Zahner (1970), and also a more clear dependence upon age of the tangential diameter. Nevertheless, the overall increase in tangential diameter from pith to bark did not exceed 7.6 %.
Although leveis were not significant, cell diameters decreased with sampling height. The trend was not the same for the radial
114 ANAIS DO INSTITUTO SUPERIOR DE AGRONOMIA
and tangential diameter. Whilst for radial diameter the trend was a Progressive decrease from 5 % to 65 %, for the tangential diameter the decrease is more marked in the upper levei, where a Tukey’s test shows this levei statistically different from the lower ones.
Fig. 1 — Variation in fibre diameters and wall thickness (R: Radial diameter; T: Tangential diameter; WT: Wall thickness)
Mean fibre wall thickness
A strong relationship was found between this trait and age, although its degree of dependence decreased with age. The magnitude of the radial variation reached 28.6 %.
Because af the variability between trees (fig. 2), no well defined general trend of fibre wall thickness whith increasing height was apparent from pooled data. However, the greater proportion of trees had a lower mean fibre wall thichness for the 15 % levei which was coincident with lower density at this levei.
HEIGHT LEVEL (V.) Fig. 2 — Variation in fibre wall thichness with weight levei
Percentage cell type distribution
Measurement of the proportion of tissue types revealed large variations from tree to tree (table 5) and also a variable response of trees to the effect of leveis, so that the trend described by pooled tree data is of doubtful use. Amalysis of the interaction Levei x Trees in Plots revealed an increase in vessel percentage between the first and last sampling levei, with a range of about 19.4% and the last levei showing a statistically significant difference from the others. From a comparision with levei mean values for fibre wall thickness and lumen area, the increase in density with height can probably be explained by the fact that the increase in percentage of cell wall in
116 ANAIS DO INSTITUTO SUPERIOR DE AGRONOMIA
relation to fibre diameter more than compensates for the increased proportion of vessels and a slight higher vessel void area.
For fibre percentage there was no definite pattern. This was variable in the lower bole, where fibre percentage decreased in some trees between the 5% levei and increased in others, but usually a maximum value was attained at about 35 % height levei from where fibre percentage decreased towards the 65 % height levei.
Parenchyma percentage differences with height were so variable from tree to tree that with the small number of trees represented in this study no general trend was apparent.
Fibre length
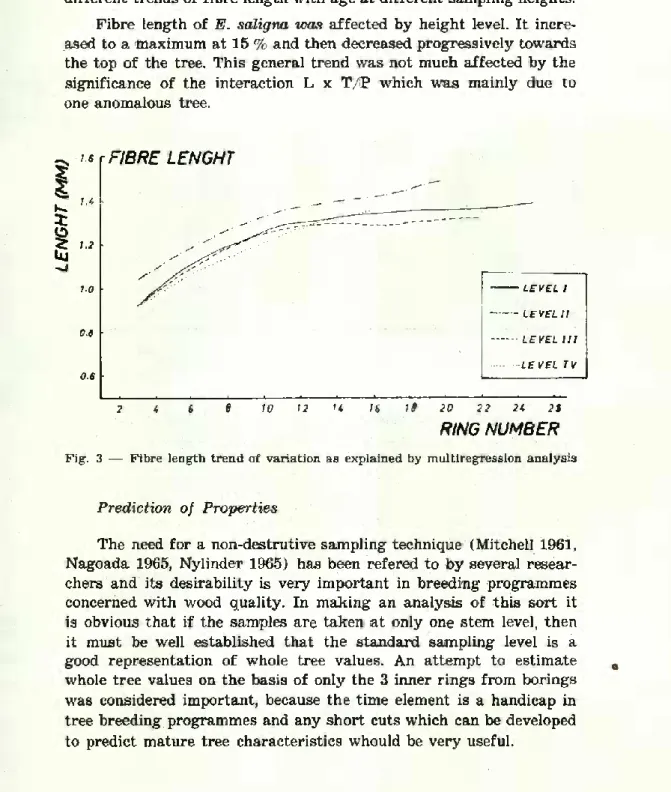
Fibre lenght-age relationship, based on the averages of all trees and heights, shows a general pattern of variation in which fibre length increases with age more rapidly in rings near the pith, followed by a more gradual increase. This general trend is well docu- mented for both hardwoods and softwoods (Jackson 1959; Kaeiser 1965; Kennedy 1957, Taylor 1973).
In our sample, mean fibre lenght increased 35 % from ring n.° 3 to ring n.° 15, with the greatest increase in between rings n.° 3 and n.° 8 (22.1%).
Between rings n,08 8 and 11 the increase was 5%, and only 2.9 % between 13 and 15. This seems to suggest that the maturation age of fibres will be about 8-9 years. The value of the residual of the analysis of variance for fibre length (table 5) suggests a variation in the trend of fibre length-age relationships at different sampling heights. However, by assigning the mean tree values for S, site to the multiple regerssion model developed to describe fibre variation í1) and computing the corresponding values of the dependent variable,
O) Y = b — b x, + b2 x2'0 "1 “1 • ~2 “2 b„ x:~8 “3 ^4 X4 • ~5 —bg Xl X2 + b9 Xl X3 + b10 X2 x“ — bn X
being Xj x2 x3 x4 x. and Y height levei in percentage, coded calendar year of formation, cambial age of the cambium, distance from the pith to the mid point of the ring, width and predicted fibre length, respectively.
+ b_ xI-bo + b. x* —
L E N C H T (M M )
it is shown that there is not much evidence to suppose there are quite different trends of fibre length with age at different sampling heights.
Fibre length of E. saligna was affected by height levei. It incre- ased to a maximum at 15 % and then decreased progressively towards the top of the tree. This general trend was not much affected by the significance of the interaction L x T/B which was mainly due to one anomalous tree.
FIBRE LENGHT
2 4 6 8 10 12 '4 16 19 20 22 24 2i
RING NUMBER Fig. 3 — Fibre length trend of variation as explained by multiregression analysis
Prediction of Properties
The need for a non-destrutive sampling technique (Mitchell 1961, Nagoada 1965, Nylinder 1965) has been refered to by several resear- chers and its desirability is very important in breeding programmes concerned with wood quality. In making an analysis of this sort it is obvious that if the samples are taken at only one stem levei, then it must be well established that the Standard sampling levei is a good representation of whole tree values. An attempt to estimate whole tree values on the basis of only the 3 inner rings from borings was considered important, because the time element is a handicap in tree breeding programmes and any short cuts which can be developed to predict mature tree characteristics whould be very useful.
118 ANAIS DO INSTITUTO SUPERIOR DE AGRONOMIA TABLE 5
Summary of the analyaes of voriance componente expressed as a percentage of total effects
jource of varaition
Vessel Pero. Fibre Perc. Parenchyma Perc. Fibre length v/ratio comp.Var. v/ratio comp.Var. v/ratio comp.Var. v/ratio comp.Var.
P 3.16* 9.24 0.23 0.00 0.50 0 00 0.45 0.00 T/P 8.51*** 18.92 22.95*** 42.47 59.57*** 66.35 28.96*** 12.10 L 3.71* 4.71 4.04* 4.62 1.54 0.43 5.53** 3.29 L X P 0.23 0.00 0.07 0 00 0.29 0.00 0.20 0.00 L X T/P 1.89* 8.94 2.19' * 9.23 1.91* 4.12 4.75*** 6.49 Ri 0.44 0.00 1.80 0.82 0.20 0.00 115.42** 63.46 Ri X P 2.45 4.03 0.29 0.00 1.25 0.53 0.16 0.26 Ri X T/P 1.10 1.29 1.14 1.38 1.86* 4.89 2.20** 2.60 Ri X L 1.47 2.41 1.61 2.45 1.18 0.47 4.74*** 3.14 Ri X L X P 1.01 0.12 1.04 0.33 1.12 0.55 0.79 0.00 Residual — 50.35 — 38.69 — 22.66 — 8.66 Density
The results of the multiple regression analysis presented in Table 6 showed that whole tree density can be predicted confidently from the weighted values of two cores at the 5 % height levei. The results showed varying degrees of precision when the analysis was carried out within each site or for all sites pooled. There was poor predic- tability with the best regression for the S2 site and this is due to the greater effect of height levei found for this site (table 6). Howe- ver, the high value of r2 (0.906) for all sites pooled, permits con- fidence to be placed in the prediction of tree density values on the basis of the information from two cores at the 5 % height levei.
Less successful was the attempt to predict whole tree density from the density of the 3 inner rings. The regressions showed varying degrees of precision according to site and for S, where the trees were older the precision was poor.
Prediction of weighted tree density by the use of the information from two sets of the 3 externai rings was also not considered to be satisfactory.
TABLE 6
Equations for estimation of vohole E. saligna tree density
Regression Equations r= % Standard dev. from regres sion All sites y = 0-51210 — 0.52689 x, + 1.13084 xt 90.6 0.021 S, y = —0.11062 + 1.15828 x, 91.3 0.019 S: y = —1.10023 — 0.294303/x, 752 0.025 S3 y = —0.01429 + 1.02522 x, 99.7 0.016 — 0.06465 0.63817 All sites y = e x. 51.2 0.071 (20.2759 — 22.6654 x:) 13.7315 S, y = e x. 34.3 0.080 S, y = 51.6502 — 298.240 x- + 576.977 x! 69.3 0.032 S3 y = 34.1639 — 168.640 x2 + 280.078x: — 153.329 x! 83.7 0.032 — 0.1625 0.768 All sites y = e x:, 68.1 058 —1.00089 + 0.80981 x. S, y = e 83.7 0.036 (4.83498 — 5.31163 x3) 4.39534 S- y = e x3 47.5 0.068 S3 y = 0.117177 + 0.78619 x3 81.3 0-029 All sites y = 0.32275 + 0.67873 x, + 0.04088 x< — 0.02155 x5 — — 10.02032 x. 59.9 0.045 y = 0.39933 + 0.68501 x3 + 0.00440 x, — 0.01067 x5 79.2 0.032
y = predicted whole tree density; x3 = weighted core density at 5 % levei (2 cores); x* = weighted 3 rings near the pi th (2 cores); x3 = weighted 3 rings near the bark (2 cores); x, = diameter at breast height; x5 = total height of the trees; X6 = Xs/x-.
The incorporation in the multiple-regression analysis of mea- surable parameters of the tree, although it improved the amount of varation explained by the models when 3 inner or outer rings were used, was still not enough to place confidence in their predictive ability.
120 ANAIS DO INSTITUTO SUPERIOR DE AGRONOMIA
Anatomic features
For some anatomical features (table 7), information collected from one core at he 5 % levei in which 9 rings were sampled can be used with confidence to predict whole weighted tree values. No acceptable prediction was found for vessel percentage, mainly due to the variation with height levei. For those anatomical traits that could be predicted by multiple regression analysis addition of parameters of tree size failed to give significant improvement.
TABLE 7
Equations for predicting weighted. tree anatomic features (S, site material)
Regression equations %r'i F I B (mm) = 0.27169 + 0.78846 x, 96.1 F R ( p. ) — 0.54836 + 1.00258 x, 90.7 F T ( n ) = 26.39510 + 2.79458 x, + 0.13355 x* 94.1 — 0.31643 + 0.48428 x, C W T ( n ) = e 81.2 1.9742 + 0.05701 x, V P R (% ) = e 69.4 F P R ( o/c ) = — 3.10939 + 1.01798 x, 90.0 P P R (% ) = — 0.79241 + 1.03711 x, 94.1
F I B = fibre length) F R = fibre radial diameter;
F T = fibre tangential diam.; C W T = cell wall thickness;
V R P = Vessel percentage; F P R = fibre perc.; P P R = parenchyma perc.; x, = weighted value at the 5% levei (1 radius, 9 rings measured for the trait indicated in the dependent varíables.
CONCLUSION
I — The sampling strategy followed proved efficient for measu- rement of density, fibre tangential diameter, fibre wall thickness and the percentages of fibre and parenchyma tissue.
For fibre radial diameter and vessel percentage, the strategy adopted was less satisfactory. In fact, for fibre radial diameter the
high values of the residual term (table 2), together with the high signifioant affect attributable to sample effects, that was greater than the effect of trees, indicate the necessity to give more attention to within ring stratification of sample for study of this charac- teristic.
II — The most important systematic within-tree variation in density was attributable to the effect of the age of the cambium and the general systematic trend with height was less marked.
III — Both density and fibre dimensions increase with age. However, this age relationship was not so pronouced for fibre radial diameter, fibre and parenchyma percentages. Besides these syste- tematc trends it was shown that there was a considerable random source of variation due to differences between trees. This was marked, not only by the differences in the tree mean values, but also by dif ferences: a) in terms of the averages rate of changes in density in the radial and axial direction; b) in terms of the magnitude of the interaction between leveis and rings;
Such differences between trees on a relatively uniform sites support the porposition that some trees have the inherent potential to produce a higher density, longer or less thick walled fibres and a different pattern of development of wood structure and distribution of tissues than neighbouring trees growing on the same site and under similar conditions of growth.
IV — On the basis of the data from all trees pooled, there was a general trend for:
a — Density to decrease between the 5 and 15 % height levei and then to increase progressively to the 65 % height levei;
b — fibre radial and tangential diameter to decrease progres sively from the 5 % height levei;
c — fibre wall thickness to decrease between the 5 % and 15 % height levei and to increase continously thereafter;
122 ANAIS DO INSTITUTO SUPERIOR DE AGRONOMIA
d — percentage of ves&els to increase toward the 65 % height levei but a minimum may be found at variable heights between the 5 % and 35 % leveis;
e — percentage of fibres either increased or decreased between the 5 % and 15 % height leveis; it reached its maximum at about 35 % levei and then decreased towards the 65 % levei;
f — percentage of parenchyma did not show an apparent pattem.
V — For large scale plantation surveys two cores at breast height, and for some features one core at the some height, are enough to characterize with confidence the weighted tree density or anatomic features respectively.
REFERENCES
Artuz-siegel,E. A., F. F. Wangaard and F. N. Tamolang (1968) — Relationship between fibre characteristics and pulp sheet properties of Philippine hardwoods. Tappi (6), 261-7.
Buijtenen, J. P. van (1969) — Relationship between wood properties and pulp and paper properties. Paper 2 and World Consultation on Forest Tree Breeding. Doc. Fo. FTB. 69-4/5.
Dadswell, H. E. and A. J. Watson (1962)—influence of the morphology of wood pulp fibres on paper properties. In: Formation and Structure of
Paper, Vol. 2. Ed. Technical Section of the British Paper and Board
Makera’Association pg. 537-74.
De Zeeuw, C. (1965)—Variability in wood. In: Cellular ultrastructure of wood
plants.. W. A. Côté, ed. Syracuse University Press. Syracuse, N. Y.
pg. 457-471.
DINWOODIE, J. M. (1961) — Tracheid and fibre length in timber — a review of literature. Forestry 34: 125-44.
Einspahr, P. W„ M. K. BENSON AMD J. R. Peckham (1968) — Wood and pulp properties of 5 year old diploid and triploid hybrid aspen. Tappi 51( 72-5.
Frazào, M. E. (1959) —Os eucaliptos na produção de pastas «kraft». Influência das características anatómicas e físicas do lenho. Instituto Superior de Agronomia, Universidade Técnica de Lisboa (unpublished rep.). Gohre, K. (1958) — The distribution of the specific gravity in the stem and
the influence of growth and locality on the specific gravity of wood.
Holz Roh-Werkst. 16 (3): 77-90.
Hughes, J. F. and D. Esan. (1969) — Variation in some structural features and properties of Gmelma arbórea — Trop. Sei 1 (11), 23-37.
Istas, J. R. (1968) — Invloed van hout-en vezelkarakteristiewen op de meka- nische kenmerken van het papier. Institut voor Sheikundig O-ndenroek. Tervunen, I.
Jackson, L. W. R. (1959)—Loblolly pine tracheid length in relation to position in tree. Jour. For. 57: 366-7.
Kaeiser, M. and K. D. Stwart (1955) — Fibre size in Populus deltoides Marsh. in relation to lean of trunk and position in trunk. Buli. Torrey Bot. Cl. 82:57-61
Kennedy, R. W. (1957) — Fibre length of fast and slow grown black cotton- wood For. Chron. 33 46-50
KLEMt G. C. (1945) — Met. Norske Skogforsoksvesen 31 (9): 127.
Knigge, W. and C. Koltzemburg (1964)—Bestimmung der Frunholy Spíitholz- grenze in Nadelholzjahrringen mit Hilfe eines Teilchengrossen Analy- sators. Holz. ais Roh-iund Werkstoff 22, 249-55.
Ladell, J. L. (1959) — A method of measuring the amount and distribution of cell wall material in transverse microscope sections of wood. J. Inst.
Wood Sei. (3), 43-6.
Lantican, C. B. and J. F. Hughes (1973)—A rapid method for specimen pre- paration and for measurement of cell cross sectional dimensions. IAWA
Buli. 4, 11-18.
Marton, R. G. R. Straires and E. J. Schreiner (1968) — Influence of growth rate and clonal effects on wood anatomy and pulping properties of hybrid poplars. Tappi 51, 230-5.
Mitchell, H. L. (1961) — A concept of intrinsic wood quality and non-des- trutive methods for determining quality in standing timber. Report 2 233 — U. S Dept. Agr. For. Prod. Ldb.
Mork, E. (1928) — Die Qualitat das Fichtenholzes under besonderer Rucksi- chtnahure auf Scheif — und Papierholz. Papier fabrikant 26 (48) 747-77.
124 ANAIS DO INSTITUTO SUPERIOR DE AGRONOMIA
Nagoda, L. (1965)—A new procedure for microanalysis of wood. Transi. Fac. For Univ. B. C. N.° 54, 1967.
Nylinder, P. (1965) — Non destructive field sampling Systems for determining the wood density of standing timber over large areas. Variation within and between species, and the influence of environmental and other measurable factors on wood density. Rapp. Instn. Vickeslara Skogs-
hogsk. Stockh. n.° 56.
Sardinha, R. M. de A. (1974) — Variation in density and some structural fea- utres of wood of Eucalyptus saligna. Sm. from Angola (Ump. D. Ph. Thesis) Vol. I Oxford. 357 pg.
Spurr, S. H. and M. J. Hyvarinen. (1954) — Wood fibre length as related to position in tree and growth. Bot. Rev. 29 (9): 561-75.
Taylor F. W. (1968 a) — Specific gravity differences within and among yellow- -poplar trees. For Prod. J. 18 (3): 75-81.
— (1968 b) —Variations in the size and proportions af wood elements in yellow pollar trees. Wood Sei. Technol. 2 (3): 133-65.
— (1973)—Anatomical wood properties of South African grown
Eucalyptus grandis. South African Forestry Journal n.° 84, 20-24.
TAYLX3R F. W. AND T. E. WOOTEN. (1973) — Wood property variation of Mississipi delta hardwoods. Wood and Fiber 5 (1): 2-13.
Zahner, R. (1970) — Site quality in upland harwoods: Theoretical consideratoins of wood density. In: Tree growth and Forest Soil. Ed. Chester T. Youn-