Bird Numbers 2010
“Monitoring, indicators and targets”
18th Conference of the
European Bird Census Council
Book of Abstracts
22-26 March 2010
Cáceres • Extremadura • Spain
“Monitoring, indicators and targets”
18th Conference of the European Bird Census Council
Book of abstracts
22-26 March 2010 • Cáceres • Extremadura • Spain
Edition: Ana Bermejo Organizing Committee:
Juan Carlos del Moral, Fernando Barrio, Virginia Escandell, Laura Trapero, Ana Bermejo, Blas Molina, David Palomino, Arantza Leal, Javier de la Puente,
Carmen Fernández, Josefina Maestre & Marcelino Cardalliaguet.
Scientific Committees:
EBCC: Dr Richard D. Gregory, Dr Hans-Günther Bauer, Dr Anny Anselin, Dr
Ruud P. B. Foppen, Dr Åke Lindström, Dr Frederic Jiguet, Dr Alexander Mischenko, Dr Svetoslav Spasov, Dr Ian Burfield, Dr David Noble & Dr Petr Voríšek.
Local: Dr Alejandro Sánchez, Dr David Serrano, Dr Javier Seoane, Dr Lluís
Brotons, Dr David Palomino, Dr Ana Bermejo & Juan Carlos del Moral.
Recommended citation for publication
Bermejo, A. (Ed.). 2010. Bird Numbers 2010 “Monitoring, indicators and targets”.
Book of abstracts of the 18th Conference of the European Bird Census Council.
SEO/BirdLife. Madrid.
SEO/BirdLife
C/ Melquiades Biencinto 34 E-28053 Madrid. Spain [email protected]
Phone: +34 914 340 910 Fax: +34 914 340 911 www.seo.org
© SEO/BirdLife 2010 Layout: Ana Bermejo Printing: Netaigraf, S.L.L. Printed in Spain
Bird Numbers 2010
"Monitoring, indicators and targets"
18th Conference of the
European Bird Census Council
Book of Abstracts
22-26 March 2010
Cáceres • Extremadura • Spain
INDEX
Page
Programme ... 2
Abstracts of plenary lectures and oral communications ... 8
Abstracts of workshops and training sessions ... 66
Abstracts of poster communications... 67
PROGRAMME
Tuesday 23 March 2010
Time "MALINCHE" ROOM Room 1 "GARCÍA MATOS" ROOM Room 2
9:00 9:45
Micheal O'Briain:
The contribution of species/site monitoring to
biodiversity and nature conservation in Europe Plenary
BIODIVERSITY INDICATORS I: POLICIES Session 1 BEYOND DATA GATHERING Session 2
9:45 10:05
Towards developing a global Wild Bird Index. Danaë K. Sheehan, Mark Eaton & Richard D.
Gregory
Using fine-grained bird atlases to develop maps of conservation value. Sergi Herrando, Lluís
Brotons, Santi Guallar & Javier Quesada 10:05 10:25
SEBI 2010 project - lessons learnt and future challenges. Katarzyna Biała & Frederik
Schu-tyser
Calculating national breeding bird abundances on the basis of the German Common Breeding Bird Survey. Rainer Droeschmeister, Holger
Heidrich-Riske, Kai Lorentz, Alexander Mitschke & Christoph Sudfeldt 10:25 10:45
Pan-European Common Bird Monitoring Scheme by 2010. Petr Voříšek, Arco van Strien, Jana Škorpilová, Alena Klvanova &
Richard D. Gregory
Enhancing volunteer bird monitoring coverage of the uplands: experiences from the Building Bird Monitoring in Scotland initiative. Mandy Cook, John Calladine* & Chris Wernham
10:45 11:05
Plea for a new type of aggregated common birds indicator measuring biodiversity loss.
Martin Flade & Johannes Schwarz
Monitoring of breeding birds in the internatio-nal Wadden Sea: an example of cross-border cooperation in monitoring and management. Kees Koffijberg, Lieuwe Dijksen, Bernd Hälterlein, Karsten Laursen, Gerold Lüerßen,
Petra Potel & Stefan Schrader
11:05 11:30 Coffee break
11:30 12:15
Gregory S. Butcher:
Using birds as indicators of the health of the environment in the USA
Plenary
BIODIVERSITY INDICATORS II: Session 3 DEVELOPMENT
Session 4
COMMON BIRD MONITORING
12:15 12:35
Spatial mismatch between biodiversity compo-nents in birds: new challenges for global
con-servation strategies. Vincent Devictor, David Mouillot, Christine Meynard, Frédéric Jiguet,
Wilfried Thuiller & Nicolas Mouquet
Common bird monitoring in Flandes, Belgium: changing densities in forest and farmland birds. Glenn Vermeersch, I. Lewylle & Anny Anselin
12:35 12:55
Dynamics of bird distribution in Mediterranean mosaic landscapes affected by large forest fires: An application of a large-scale monitoring database. Elena L. Zozaya, Lluís Brotons, Sergi
Herrando & Pere Pons
Population trends of common breeding birds in Lombardy, Northern Italy, 1992-2009. Dario
Massimino, Valerio Orioli & Luciano Bani 12:55 13:15
Mind the gap! Which European bird species need better monitoring, and where? Ian
Bur-field
Beyond birds: how other taxa can be effectively monitored by volunteer bird surveyors. Kate
Risely & David Noble 13:15 13:35
Are raptors good indicators of overall biodiver-sity? A case study from Dadia National Park. Stefan Schindler, Vassiliki Kati, Martin Prinz
& Kostas Poirazidis
Habitat specialization in Latvian forest birds – suggestions to forest bird index. Ainārs Auniņš,
Jānis Priednieks, Māris Strazds & Viesturs Ķerus
13:35 15:00 LUNCH
15:00 15:45
Manuel B. Morales:
Recent trends in steppe bird populations: influence of climate, land use and agriculture
intensification Plenary FARMLAND I: Session 5 CONSERVATION ISSUES Session 6 WATERBIRDS
Time "MALINCHE" ROOM Room 1 "GARCÍA MATOS" ROOM Room 2
15:45 16:05
Linking farmland bird abundances and agri-environment schemes in France using Bayesian
models. Karine Princé & Frédéric Jiguet
Using Wetlands International’s Waterbird Population Estimates series to produce global waterbird indicators. Simon Delany & Szabolcs
Nagy 16:05 16:25
Effectiveness of the Italian national protected areas system in conservation of farmland birds:
a gap analysis. Guido Tellini Florenzano, Tommaso Campedelli, Guglielmo Londi, Simonetta Cutini & Lorenzo Fornasari
Countrywide hunting ban on waterbirds in Slovakia in the year 2006 – unexpectedly successful experiment. Katarína Slabeyová 16:25 16:45
Farmland birds do better in High Nature Value (HNV) Farmlands. Aggeliki Doxa, Maria Luisa
Parrachini & Frédéric Jiguet
The International Waterbird Census: The world’s most extensive site-based bird
monito-ring system. Simon Delany & Stephan Flink
16:45 17:05
Is the Atlantic metapopulation of Common Quail (Coturnix coturnix) declining?
Prelimina-ry results of a transnational monitoring pro-gramme. José Domingo Rodríguez-Teijeiro, Francesc Sardà-Palomera, Inàcio Alves, Yan-nick Bay, Agostinho Beça, Bernard Blanchy, Bernard Borgogne, Bernard Bourgeon, Pedro Colaço, Jacky Gleize, Antonio Guerreiro, Mohammed Maghnouj, Christophe Rieutort,
Denis Roux & Manel Puigcerver
Use of Species Distribution Modelling based on data from the African Waterbird Census to predict waterbird distributions in Africa and identify gaps in knowledge of distribution. José
Manuel Ochoa-Quintero & Szabolcs Nagy
17:05 17:30 Coffee break
WORKSHOP: ATLAS Session 7 ECOLOGICAL BASES OF THREAT Session 8
17:30 17:50
Assessing the ecological basis of conservation priority lists for bird species in an island scena-rio. Javier Seoane, Luis M. Carrascal & David
Palomino 17:50 18:10
Sustainable breeding populations of Annex I species: how to reach and secure them? Anny Anselin, Glenn Vermeersch, Jos Rutten, Koen Devos, Peter Adriaens & Gerald Louette
18:10 18:30
A new European Breeding Bird Atlas?
Ruud Foppen, David Noble, H.-G. Bauer, Frédéric Jiguet, Ian Burfield & Lluís Brotons
Population changes in Czech passerines: quan-tifying the effects of life histories, ecological requirements and phylogeny. Jiří Reif, Zdeněk
Vermouzek, Petr Voříšek, Karel Šťastný, Vladimír Bejček, Jiří Flousek, Josef Chytil &
Tomáš Telenský ATLAS
18:30 18:40
Bird Atlas 2007-11 in Britain and Ireland: summary of methods and provisional findings. Dawn Balmer, Simon Gillings, Brian Caffrey &
Bob Swann 18:40 18:50
Catalan Winter Bird Atlas: an analytical over-view. Santi Guallar, Sergi Herrando, Javier Quesada, Lluís Brotons, Joan Estrada & Marc
Anton
Development and use of national habitat-specific bird-indicators. Henning Heldbjerg &
Jørn Lennart Larsen
NEW BBS
18:50 19:00
Common Bird Monitoring in Romania between 2006-2009. Zoltán D. Szabó, Cristi Domşa,
Nagy H. Beáta & Fenesi Annmária 19:00 19:10
The state of Bulgaria’s common birds 2010: results from the common bird monitoring
scheme for the period 2005-2009. Iordan Hristov
Migration counts as a tool for bird conserva-tion: the case of the Strait of Gibraltar. Gonzalo
M. Arroyo, Luis Barrios, Alejandro Onrubia, Antonio Román Muñoz, Miguel Ferrer, Keith Bildstein, Chris Farmer, Andrés de la Cruz, Juan Ramírez, Miguel González, Javier Elo-rriaga, Blanca Pérez & Carlos Torralvo 19:10 19:45 POSTER SESSION Spatial Modelling of Bird Monitoring Data Henk Sierdsma & Lluís Brotons
Wednesday 24 March 2010
Time "MALINCHE" ROOM Room 1 "GARCÍA MATOS" ROOM Room 2
9:00 9:45 Migration and bird numbers Ian Newton: Plenary
MIGRATION AND MONITORING Session 9 FARMLAND II: POPULATION TRENDS Session 10
9:45 10:05 A different perspective on the monitoring of migratory birds. Javier Pérez-Tris
Changes in agricultural management and farmland bird populations in Poland following
accession to the European Union. Fiona San-derson, Marta Kucharz, Marek Jobda & Paul
Donald 10:05 10:25
Delayed departure and shifted wintering ranges of waterfowl in Northern Europe. Aleksi
Lehi-koinen, Kim Jaatinen & Risto A. Väisänen
Temporal changes in winter abundance of common farmland birds in France covary with
large-scale climatic conditions. Cyril Eraud, Denis Roux, Jean-Marie Boutin & Hervé
Lormée 10:25 10:45
Life-history and ecological correlates of popu-lation change in European birds, with particular
reference to Afro-Palearctic migrants. Steven Ewing, Richard D. Gregory, Arco van Strien,
Adam Butler & Petr Voříšek
Population trends of farmland birds in farmland and non-farmland habitats. Ola Olsson, Martin Green, Åke Lindström, Richard Ottvall, Martin
Stjernman & Henrik Smith 10:45 11:05
Changes in the timing of visible bird migration in The Netherlands in autumn. Chris van
Turn-hout
Comparing land sparing and land sharing strategies for the conservation of farmland and
forest birds in exploited landscapes. Yves Bas & Frédéric Jiguet
11:05 11:30 Coffee break
11:30 12:15 Modelling bird distribution and abundance with Luis M. Carrascal: different subset of predictive variables
Plenary
MODELLING I: GENERAL ISSUES Session 11 STEPPE BIRDS Session 12
12:15 12:35
Using the NDVI for modelling bird distribu-tions in changing farmland landscapes:
predic-ting the dynamic distribution of the common quail Coturnix coturnix. Francesc Sardà-Palomera, Manel Puigcerver, Lluís Brotons &
José Domingo Rodríguez-Teijeiro
Meadow bird monitoring in France and Russia: first results of comparative researches. Joël Broyer, Alexander Mischenko, Olga
Sukhano-va & Laurence Curtet
12:35 12:55
Checklist programs as a source of data for bird monitoring: designing analyses and model validations to account for unequal spatial and temporal sampling effort. Wesley M.
Hochach-ka, Daniel Fink & Steve Kelling
The impact of post-Soviet land use change on steppe bird populations in Kazakhstan.
Johan-nes Kamp, Paul F. Donald & Norbert Hölzel
12:55 13:15
Phenological and resource use traits explain long term population trends in UK passerine birds. Lara Salido, B. Purse, R. Marrs, D.
Chamberlain & S. Shultz
Assessing the conservation status of the steppe habitat in Andalusia (S Spain) through the long-term monitoring of steppe birds. José R.
Garri-do, Marcos Moleón, Matías de las Heras & Francisco Romero
13:15 13:35
Report of the EBCC Spatial Modelling Group: update on spatial modelling of bird monitoring data in Europe. Henk Sierdsema, Lluís Brotons,
Stuart Newson, Frédéric Jiguet, Marc Kéry & Richard D. Gregory
Using multi-source remote sensing data for describing steppe bird landscape requirements
in the Castro Verde SPA, Portugal. Pedro J. Leitão, Francisco Moreira & Patrick E.
Osbor-ne
13:35 15:00 LUNCH
15:00 15:45 Climate change and birds: from phenology to Christiaan Both: population trends
Plenary
Time "MALINCHE" ROOM Room 1 "GARCÍA MATOS" ROOM Room 2
15:45 16:05
Predicting the potential impacts of future land cover changes on breeding bird communities in
the Italian Alps. Marco Girardello, Simone Tenan & Paolo Pedrini 16:05 16:25
How much have recent changes in forest age structure influenced habitat quality of common
bird species in Latvia? Elmārs Pēterhofs
16:25 16:45
Abundance and immunocompetence of alpine passerines in the Cantabrian Mountains: poten-tial impact of climate change. Leandro Melén-dez, Jesús Ángel Lemus, Guillermo Blanco, Mónica García, María José Bañuelos & Paola
Laiolo 16:45 17:05
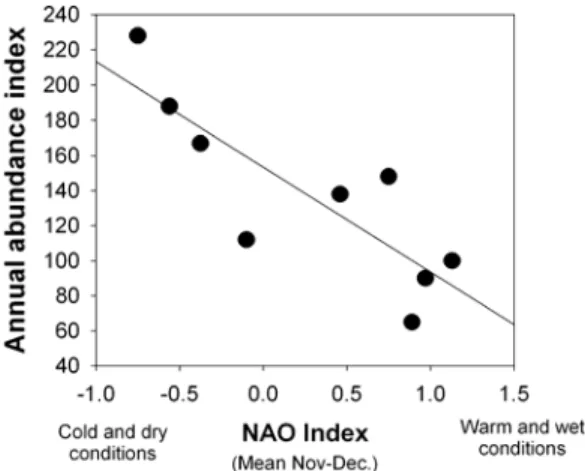
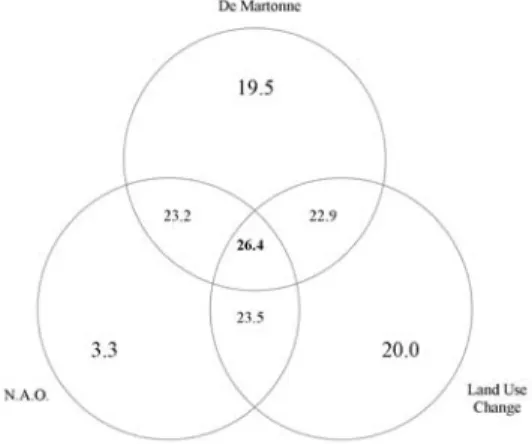
The effects of N.A.O. and land use change on distribution an abundance of Falco naumanni in
Sicily. Maurizio Sarà
The use of BirdStats
Tom van der Meij, Arco van Strien & Mark Eaton 17:05 17:30 Coffee break 17:30 19:10 BOARD MEETING Presentation of "Conservation Status of Birds in Spain in 2010"
Spanish Environment Minister & Presindent and Chairman SEO/BirdLife
Fryday 26 March 2010
Time "MALINCHE" ROOM Room 1 "GARCÍA MATOS" ROOM Room 2
9:00 9:45
Richard D. Gregory:
Climate change indicators: new generation
indicators Plenary
GLOBAL CHANGE II: INDICATORS Session 15 WEB TOOLS Session 16
9:45 10:05
The role of EBCC monitoring data in climate change research. Ruud B. Foppen, Chris van Turnhout, Richard D. Gregory, Arco van Strien
& Vincent Devictor
Integrating web-technology and ornithological atlasing: experiences from Bird Atlas 2007-11 in Britain and Ireland. Simon Gillings, Dawn
Balmer, Iain Downie & Karen Wright 10:05 10:25
A vulnerability index for breeding birds in changing climate and land use. Ramona Mag-gini, Boris Schröder, Niklaus E. Zimmermann,
Janine Bolliger, Anthony Lehmann, Ruud Foppen, Hans Schmid & Niklaus Zbinden
Emerging issues in web-based collection of ornithological data: the UK perspective. Andy
Musgrove 10:25 10:45
A climate change indicator for Swedish birds. Åke Lindström, Vincent Devictor, Martin
Green, Richard Ottvall & Henrik Smith
Do we need a European database for bird sightings and if yes, what is the role of the
EBCC? Hans Schmid 10:45 11:05
Climate change and bird population trends: Evidence from 40 years of monitoring in the UK. Sarah Eglington, Stuart Newson & Dan
Chamberlain
Potential uses of ad hoc data from birdwatchers for monitoring and conservation: the
World-birds family of web tools. Johannes Kamp, Stephen R. Baillie, Paul F. Donald, Mark A. Eaton, Ian J. Fisher & Richard D. Gregory
11:05 11:30 Coffee break
11:30 12:15 Hierarchical modeling of distribution and Marc Kéry: abundance in metapopulation designs
Plenary
MONITORING METHODS Session 17
Session 18
GLOBAL CHANGE III: PHENOLOGY AND DISTRIBUTION
12:15 12:35
Detection probability analysis offers new opportunities for bird census work. Arco van Strien, Chris van Turnhout, Henk Sierdsema,
Ruud Foppen & Leo Soldaat
Could climate change have something to do with changes in bird distribution in Latvia? Viesturs Ķerus, Ainārs Auniņš, Māris Strazds
& Jānis Priednieks 12:35 12:55
Hierarchical models for smoothed population indices: the importance of considering among-site variations in population trends. Tatsuya Amano, Hiroshi Okamura & William J.
Suther-land
Changes in bird distribution due to global warming – a first high resolution modelling approach for German. Thomas K. Gottschalk,
Christoph Sudfeldt, Alexander Mitschke & Rainer Dröschmeister
12:55 13:15
Time means… species! On the performance of species richness estimators and different sam-pling schemes. Pedro A. Salgueiro, Hugo Costa
& J. E. Rabaça
Birds and butterflies tracking climate change: which are faster? Vincent Devictor, Chris van Swaay, Tom Brereton, Lluís Brotons, Dan Chamberlain, Janne Heliölä, Sergi Herrando,
Romain Julliard, Mikko Kuussaari, Åke Lindström, Jiri Reif, David Roy, Arco van Strien, Oliver Schweiger, Constantí Stefanescu,
Zdenek Vermouzek, Chris van Turnhout, Michiel Wallis de Vries & Frédéric Jiguet 13:15 13:35
Swift counts: a new methodological approach. Pedro Pereira, Pedro Salgueiro & Carlos
Go-dinho
Population decline of long-distance migratory species in Hungary. Tibor Szép, Károly Nagy,
Zsolt Nagy & Gergő Halmos
13:35 15:00 LUNCH
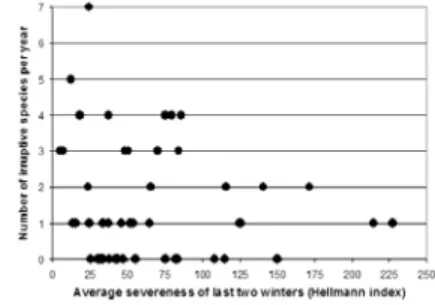
15:00 15:45 The paradox of invasions in birds Daniel Sol: Plenary
INVASIVE BIRDS AND HUMAN EFFECTS Session 19 WORKSHOP: Session 20 INTERNET PLATFORMS
Time "MALINCHE" ROOM Room 1 "GARCÍA MATOS" ROOM Room 2
15:45 16:05
Population change of avian predators and grey squirrels in England: is there evidence for an
impact on avian prey populations? Stuart E. Newson, Eric. A. Rexstad, Stephen R. Baillie, Stephen T. Buckland & Nicholas J. Aebischer
16:05 16:25
Site-based monitoring and assessment breeding bird communities of the protected mires in Estonia: the effect of recreational disturbance
on habitat use of birds. Agu Leivits, Aivar Leito, Ivar Ojaste, Meelis Leivits & Murel
Merivee 16:25 16:45
Habitat and landscape assessment of the impact of ski-runs on alpine grassland bird
communi-ties. Enrico Caprio, Marco Isaia & Antonio Rolando
16:45 17:05
Following raptors and soaring birds populations in wind farms: a methodological protocol. Ana Teresa Marques, Joana Bernardino, Hugo Costa
& Miguel Mascaranhas
Internet/web-based monitoring platforms
17:05 17:30 Coffee break Session 21 WORKSHOP: PARTNERSHIPS Session 22
MODELLING II: APPLICATIONS 17:30 17:50
How far do we stand from the truth : featuring four types of phenological modeling methods using simulated data. Jean-Pierre Moussus,
Romain Julliard & Frédéric Jiguet
17:50 18:10
Using atlas and census data of Montagu’s and hen harriers in Spain to obtain favourability areas and forecast the implications of climate change on both species. Alba Estrada, Beatriz
Arroyo & Ana Luz Márquez 18:10 18:30
Multispecies synchrony with climatic variables in the study of seabird adult survival at the Isle of May (Scotland). José J. Lahoz-Monfort, Byron J. T. Morgan, Michael P. Harris, Sarah
Wanless & Stephen Freeman 18:30 18:40
Spatial distribution models for the Lesser Kestrel Falco naumanni in central Greece.
Antonia Galanaki & A. Fielding
18:40 19:10
Developing partnerships between countries to improve breeding bird monitoring
sche-mes in Europe
Petr Voříšek & Jana Škorpilová
A protocol for setting quantitative targets for species recovery. Mark A. Eaton, Andy Evans, David G. Noble, Nicholas A. Aebsicher, Andy F. Brown, Richard D. Gregory, Andy J.
Mus-grove, Peter Cranswick, David W. Gibbons, Phil V. Grice, Leigh Lock & Robin Wynde
ABSTRACTS OF PLENARY LECTURES
AND ORAL COMMUNICATIONS
Session 1. BIODIVERSITY INDICATORS I: POLICIES
THE CONTRIBUTION OFSPECIES/SITE MONITORING TO BIODIVERSITY AND NATURE CONSERVATION IN EUROPE Micheal O’Briain*, Angelika Rubin & Anne Teller
DG Environment, European Commission * Corresponding author:
micheal.o’[email protected]
It is clear that both the current global target of significantly reducing biodiversity loss worldwide by 2010 as well as the more ambi-tious EU target of to halt biodiversity loss in the EU by 2010 will not be achieved. Imple-mentation of the EU biodiversity action plan has also revealed that the knowledge base is still not adequately developed and that there are limited monitoring tools at the EU scale to assess progress towards meeting biodiver-sity objectives.
The strongest EU monitoring frameworks are linked to reporting on implementation of environmental legislation. Biodiversity indi-cators, including species and site indiindi-cators, have also been developed within the frame-work of the EEA led project on streamlining of biodiversity indicators in Europe (SEBI 2010). The PECBMS and the Wild Bird Indi-cators are strategically valuable schemes to inform EU policies including Sustainable Development and Rural Development Indica-tors. There is a need to continue to ensure the robustness of these key bird data sets.
The Habitats Directive aims to achieve ‘fa-vourable conservation status’ for species and habitat types of EU conservation concern and provides a mechanism for their regular sur-veillance at biogeographical level. The first 2009 conservation status assessment revealed that only 17% of assessments were favour-able and represents a key baseline against which to assess future progress. It also showed a severe gap of knowledge and data
in some Member States and especially the marine environment, a clear sign that moni-toring systems need to be strengthened or set-up in first place. The Birds Directive, which provides a framework to protect all wild birds species in the EU, does not set out such a clear overall conservation objective or mechanisms for monitoring by Member States. To date the only European scale con-servation status assessments have been those published by BirdLife International in 1994 and 2004, the most recent of which indicates that 48% of species have an unfavourable status. The possibilities of strengthening bird monitoring and reporting under the Birds Directive by EU Member States are being examined.
EU Member States have provided an initial conservation assessment of the species and habitats within each of their Natura 2000 areas as part of the site notification process. A key challenge over the coming decade will be determining the contribution of these sites to the attainment of conservation goals, the setting of clear ‘conservation objectives’, and the putting in place of effective management and restoration measures, underpinned by monitoring systems.
EU nature legislation will continue to play a central role in the post 2010 EU biodiversity strategy. However, there is also increasing focus on ecosystem services, inspired by work on the economics of ecosystems and biodiversity (TEEB). Development of the concept of a ‘green infrastructure’ may pro-vide a unifying perspective to ensure that biodiversity and ecosystem services are ade-quately addressed in major land and water use policies, including in the context of cli-mate change. This is likely to lead to a stronger ‘ecosystem’ dimension to future monitoring and assessments. The extent to which bird monitoring and research can use-fully contribute to assessing the healthy
func-tioning of ecosystems and their services has still to be determined.
TOWARDS DEVELOPING A GLOBAL WILD BIRD INDEX
Danaë K. Sheehan*, Mark A. Eaton & Richard D. Gregory
Royal Society for the Protection of Birds, Sandy, Bedfordshire, SG19 2DL, UK
* Corresponding author: [email protected]
The Global Wild Bird Index (WBI) project began in 2007, coordinated and funded by the RSPB and BirdLife International, with addi-tional support from the 2010 Biodiversity Indicators Partnership, with the ultimate aim to develop a Wild Bird Index to monitor and report on the impact of environmental change on bird populations worldwide.
Following a review of ongoing bird monitor-ing activities in Africa, a detailed global review of existing bird monitoring schemes, and capacity assessment of potential partici-pating countries, is currently being carried out. In some countries counts of particular species or groups are well established, popu-lar and extend back some time. Some of these existing schemes could be expanded, whilst others could be harmonized, enhanced and joined up to maximise their effectiveness and usefulness.
The methodology for producing WBIs is well developed; WBIs are well-established in Europe, with a Pan-European WBI being used to measure progress towards the EU’s aim of halting biodiversity loss by 2010. WBIs have recently been published for the United States and an indicator initiative has begun in Australia. By incorporating data from formally designed surveys only, and using advanced statistical techniques, such projects can deliver scientifically robust and representative indicators. Since contributing data are generated at the local level, WBIs are scalable and can be aggregated or disaggre-gated at the global, regional and national (sub-national) level, or by habitat, guild, or aspects of species ecology. However, data coverage is currently patchy and the WBI is
not presently applicable at a global scale; if representative global coverage can be achieved, the WBI stands to become one of the leading measures of global biodiversity change.
The project is working with local partner organisations in a number of countries with the intention of building local and regional capacity for Bird Population Monitoring (BPM) schemes with long-term sustainability by engaging volunteer observers in simple and rewarding bird monitoring with clear objectives and conservation value. Where such schemes already exist, the project will develop WBIs from national population monitoring schemes, coordinating and facili-tating the collation of species’ indices. Where there are no schemes, it will provide tools and support to implement similar data collation and synthesis in a representative set of coun-tries across regions.
The project is already supporting the estab-lishment of several new bird-monitoring schemes in Africa (e.g. Botswana, Uganda, Rwanda) to extend the scope of the WBI project. The project is also implementing online data collection through bespoke new development of the ‘Worldbirds’ system.
SEBI 2010 PROJECT - LESSONS LEARNT AND FUTURE CHALLENGES Katarzyna Biała* & Frederik Schutyser
European Environment Agency, Kongens Nytorv, 6, DK-1050 Copenhagen K, Denmark
* Corresponding author: [email protected]
SEBI 2010 (Streamlining European Biodiver-sity Indicators for 2010) is a process initiated in 2005 to select a set of indicators to monitor progress towards 2010 in Europe. Its institu-tional partners are the European Environment Agency (and its European Topic Centre on Biological Diversity), the European Centre for Nature Conservation, the United Nations Environment Programme World Conserva-tion Monitoring Centre (UNEP-WCMC), the European Commission, the Joint Secretariat of the Pan-European Biological and Land-scape Diversity Strategy (PEBLDS), and the
Czech Republic (as lead country for the Kiev Resolution on Biodiversity’s Action Plan on Monitoring and Indicators). The SEBI 2010 process covers 53 countries across Europe. SEBI 2010 built on the conceptual frame-work provided by the CBD, and frame-worked with a set of headline indicators within the CBD focal areas.
Key lessons from SEBI 2010 to date include the following:
• Policy context and organisation of the process: experts, countries, institutional partners: SEBI 2010 benefited from ex-isting networks and processes.
• Selection of the indicators: a thorough selection process was used to select spe-cific indicators. The final selection was of course to some extent based on expert opinion and driven by the need to select at least one indicator per headline. • Strengths and weaknesses of the process
and the set: the process was transparent and involved a wide range of experts from governments, research and NGOs. Stronger direct links with countries to compare national sets with the SEBI set would be useful. While geographical coverage is good for EU countries and EEA member states, coverage for Euro-pean countries further East is not satis-factory.
The set must be considered the best available now, but there certainly is room for im-provement. Some indicators provide specific measurements and trends on genetic, species and ecosystem/landscape diversity, but many have a much more indirect link to biodiver-sity. Very few were established specifically to assess biodiversity. Coverage of the com-ponents of biological diversity needs to be improved and the focal areas of access and benefit-sharing and sustainable use need to be strengthened. Establishing stronger links between the indicators is essential to draw policy relevant conclusions.
Challenges for 2010 and beyond: The
indica-tor framework for moniindica-toring progress to-wards the new post-2010 target could be based on the current CBD framework around focal areas, but add specific targets on threats
and ecosystem services. This would allow for a stronger sectoral approach and focus on drivers, which would be required to influence sectors more effectively.
PAN-EUROPEAN COMMON BIRD MONITORING SCHEME BY 2010 Petr Voříšek1*, Arco van Strien2, Jana
Škorpilová1, Alena Klvanova1 & Richard
D. Gregory3
1 Pan-European Common Bird Monitoring
Scheme, Czech Society for Ornithology, Na Bělidle 252/34, CZ-150 00 Prague 5, Czech Republic
2 Statistics Netherlands, PO Box 24500, 2490 HA
The Hague, The Netherlands
3 Royal Society for Protection of Birds, The
Lodge, Sandy Bedfordshire, SG19 2DL, UK * Corresponding author:
Since its commencement in 2002, The Pan-European Common Bird Monitoring Scheme (PECBMS) has produced five updates of European species population indices and indicators; the next update is planned for June 2010. While the data quality and geographi-cal and temporal coverage has been increas-ing, the outputs of the scheme has confirmed repeatedly dramatic decline of European common farmland birds. The European farm-land bird indicator fell down the level of 50% recently in comparison to early 1980s and the population trends have been mimicked by an index of biomass too. The trends of farmland birds have been less negative in new EU Member States than those in Old EU States suggesting a link to changes in land and crop management. Using a risk assessment frame-work, we expect that populations of farmland birds will decline further, especially if agri-culture intensification is accelerated in East-ern European countries. Loss of set-asides and continuing land abandonment can have detrimental effect too.
The groups of common forest birds and all common birds have declined moderately, though significantly. The PECBMS outputs have also confirmed that climate change is
already having detectable effect on bird populations at European scale.
According to PECBMS results, the European nature conservation appears to fail to achieve the target to halt decline in biodiversity by 2010. The wild bird indicators are used by policy makers as official biodiversity indica-tors at both, national and European scales. Despite wide acceptance and use of the wild bird indicators, the PECBMS aims to im-prove a process of data quality control, the quality of species trends and indicators too. We also aim to improve geographical cover-age: the 2009 update of indices is based on data from 22 countries and it is expected that this figure will be higher with each update. The most updated results and new findings from PECBMS will be presented too.
PLEA FOR A NEW TYPE OF AGGREGATED COMMON BIRDS INDICATOR MEASURING
BIODIVERSITY LOSS
Martin Flade1* & Johannes Schwarz
1 Landesumweltamt Brandenburg, Dorfstr. 60,
D-16230 Brodowin, Germany
* Corresponding author: [email protected]
Combined or aggregated common birds indi-cators, consisting of mean population index curves of a set of common breeding bird species, are used by the European Commis-sion and national governments as biodiversity indicators, e.g. to measure conservation or agricultural policy success. In the European Union, the ‘wild bird indicator’ was recently adopted to assess the progress towards the policy target of halting the loss of biodiver-sity until 2010, and the ‘farmland bird indica-tor’ is taken to measure the success of agri-cultural policy and agri-environmental schemes. Without any doubt this is a big success of the Pan-European Common Birds Monitoring Scheme of the EBCC and of high importance for the further development of European conservation strategies.
But in course of the discussion of establishing further indicators for other habitat types than farmland the question came up: what do these indicators really measure? Up to now, the established indicators calculate annual in-crease rates against decline rates. That means, theoretically, if 50% of the species would constantly increase at a certain rate and 50% would decrease at the same rate, that in a medium or long term we would lose 50% of the species while the aggregated indicator would remain more or less stable. Even worse: if - hypothetically - species would become completely extinct, the aggregated indicator would react positively afterwards, because the rate of decline of that species would not influence the mean multi-species indicator anymore. Thus, the recently used indicators do measure anything but certainly NOT biodiversity or biodiversity loss. This implies, for instance, that the progress to-wards the target of halting or slowing down the loss of biodiversity can definitely not be measured with such type of indicator. Never-theless, for a certain period of time the farm-land birds indicator did mirror the effects of adverse large-scale changes of farmlands to birds, since the majority of farmland birds, and thus the combined index as well, showed declines. But in habitat types where only a certain group of species is on decline and others are increasing, the recently used indi-cators will not work anymore.
Based on the data of the German common birds survey (period 1989-2008) we will demonstrate several options of a new type of a simple aggregated indicator on an annual basis that really measures biodiversity loss against policy targets, and is independent of more or less arbitrarily chosen target values, as used until now in some countries (like Germany, for instance). Especially with re-gard to combined biodiversity indicators for other habitat types than farmland (e.g. forest bird indicator, urban birds indicator, wetland birds indicator, overall wild bird indicator) it is recommended to switch to such new type of biodiversity loss indicators.
Session 2. BEYOND DATA GATHERING
USING FINE-GRAINED BIRD ATLASESTO DEVELOP MAPS OF CONSERVATION VALUE
Sergi Herrando1*, Lluís Brotons1, 2, Santi
Guallar1 & Javier Quesada1
1 Catalan Ornithological Institute, Museu de
Ciències Naturals de la Ciutadella, Passeig Picasso s/n, 08003 Barcelona, Catalonia, Spain
2 Centre Tecnològic Forestal de Catalunya, Àrea
de Biodiversitat, Carretera de Sant Llorenc¸ km 2, 25280 Solsona, Catalonia, Spain
* Corresponding author: [email protected]
Bird atlases constantly improve our under-standing on species distributions, population sizes and trends, which represent crucial elements to determine the threat status of the species all over the studied areas. On the other hand, conservation planners require quantitative criteria to decide where biodiver-sity preservation should be prioritary, and in which cases it should be balanced with other human activities. We used data from the Catalan Breeding Bird Atlas 1999-2002 (CBBA) to develop a simple quantitative method to assist in the decision making proc-ess of the landscape planning by integrating information of species distribution and their individual IUCN extinction risks. We gener-ated an Index of Cumulative Threat Status (ICUTS) from the summation of the numeri-cal threat status (LC = 1, NT = 2, VU = 3, EN = 4 and CR = 5) of each species present in a given UTM square to the nth power (n from 1 to 7). Using a heuristic approach, we selected a power of n = 5 after comparing the results of this series of indexes with those provided by 10 experts on the avifauna of the region. Then, we generated maps of conservation value by applying the ICUTS to each 10 x 10 km square of Catalonia.
The CBBA provides 10 x 10 km distributions for all the breeding species in Catalonia but only shows 500 x 500 m distributions for 83% of them. As our objective was to create one fine-grained conservation value map, we checked the spatial robustness of our method
when using only the species that have 500 x 500 m distribution maps by generating two maps of conservation value based on the ICUTS at 10 x 10 km resolution: one com-prising all breeding bird species in the study region (219 species, recent colonizers and exotics excluded), and a second one with only those bird species for which fine-grained distributions (500 x 500 m) were also avail-able in the CBBA (182 species). In spite of the difference in the number of species in-cluded in the two 10 x 10 km maps, we found similar geographical patterns and considered that the fine-grained conservation value map represent the whole breeding avifauna of Catalonia.
This conservation map has been already used by the Barcelona Province Government and by the Catalan Government in several pro-jects of landscape planning. The approach developed in this study represents a meaning-ful synthesis of an entire atlas that has re-sulted particularly helpful in landscape plan-ning because of its spatial continuity, fine-grained resolution and easy interpretation.
CALCULATING NATIONAL
BREEDING BIRD ABUNDANCES ON THE BASIS OF THE GERMAN
COMMON BREEDING BIRD SURVEY Rainer Droeschmeister1*, Holger
Heidrich-Riske2, Kai Lorentz2, Alexander
Mitschke3 & Christoph Sudfeldt3
1 Federal Agency for Nature Conservation,
Konstantinstraße 110, 53179 Bonn, Germany, [email protected]
2 Federal Statistical Office,
Gustav-Stresemann-Ring 11, 65189 Wiesbaden, Germany, [email protected], [email protected]
3 Federation of German Avifaunists, Zerbster Str.
7, 39264 Steckby, Germany, [email protected], [email protected]
* Corresponding author: [email protected]
The German Common Breeding Bird Survey (GCBBS) is the main scheme for monitoring German common and widespread breeding
bird species. The GCBBS is organized by the Federation of German Avifaunists (Dachver-band Deutscher Avifaunisten, DDA) and was launched in 2004 in order to provide better habitat and geographical coverage of Ger-many compared with the former German Common Bird Census (GCBC). National coordination and data analysis of GCBBS is funded by the Federal Agency for Nature Conservation (Bundesamt für Naturschutz), nature conservation administrations of the German Länder (Federal German States) and the DDA. GCBBS has been developed in co-operation with the Federal Statistical Office (Statistisches Bundesamt Deutschland). GCBBS has a total of 2,637 plots of 1 km2 size which are open for recording. Plots have been selected using a stratified random sam-ple design. The comsam-plete terrestrial area of Germany was stratified using a combination of land use and ecological regions. In 2009 more than 1,300 of these plots were moni-tored by highly qualified volunteers in the course of four visits per breeding season (10 March-20 June) using the so-called line map-ping method, which is a simplified territory mapping method along a line transect of around 3-4 km length inside each recording plot. Recorded territories of one breeding season are assigned to one of 13 predefined habitat types along the line.
Densities of breeding birds are calculated using results from distance sampling studies taking into account different detection prob-abilities in different habitat types. Species densities are calculated as mean densities for each habitat type in each ecological region. Mean densities are multiplied by the area of a single stratum and abundances are added for all occurring strata in order to calculate pro-jected abundance estimates for common breeding birds in Germany as a whole or the German Länder separately.
A first analysis of the new approach resulted in projected abundances on a scale similar to expert estimates. For most common and widespread species with stable (e.g. Chaf-finch, Blackbird) or increasing trends (e.g. Blackcap and Great Tit) the projected abun-dances are greater than expert estimates. Species abundances for species with
declin-ing trends such as Willow Warbler, Linnet and House Sparrow were lower than the expert estimates. This can be interpreted as a delayed perception of declines by experts compared with events in the real world. The new GCBBS provides statistically founded abundance estimates and can also detect trends, which can be calculated using projected results for species abundances in land-use types, ecological regions, the Ger-man Länder or on a national level. These trends will be compared in the future with those calculated by the well known software TRIM, which is used by most of the EBCC partners.
For more information on GCBBS visit: http://www.dda-web.de.
ENHANCING VOLUNTEER BIRD MONITORING COVERAGE OF THE UPLANDS: EXPERIENCES FROM THE BUILDING BIRD MONITORING IN SCOTLAND INITIATIVE
Mandy Cook, John Calladine* & Chris Wernham
BTO Scotland, University of Stirling, FK9 4LA, UK
* Corresponding author: [email protected]
UK bird populations are some of the most effectively monitored in the world, thanks to thousands of dedicated volunteer birdwatch-ers. Around 5,000 volunteers in Scotland submit bird data to BTO recording pro-grammes annually, providing scientifically rigorous and cost-effective information for conservation science. Despite this, Scotland’s generally low population density, its aggre-gated human population, and its remote and challenging terrain, still present considerable challenges when seeking representative monitoring of the uplands in particular.
The Building Bird Monitoring in Scotland project is a three-year joint initiative between the BTO and the Scottish Ornithologists’ Club that aims to support the existing net-work of bird recorders and volunteer coordi-nators in Scotland, principally through the provision of free training events, supporting promotional materials and a series of
work-shops for exchange of ideas and experience. Part of the training is aimed at increasing the confidence and skills base of existing volun-teers. The project is also working actively to explore novel survey approaches, and to find (through appropriate advertising and partner-ship working), train and motivate new groups of volunteers (such as hillwalkers and land managers). Currently 358 volunteers have attended 17 training events and the success of the events is being monitored via question-naires to participants and subsequent registra-tion for BTO recording schemes. The imme-diate aim will be to learn from experiences and feedback from participants to ensure that training evolves to deliver the maximum benefits in terms of the number and skills base of new recruits to Scottish bird monitor-ing schemes. The uplands of Scotland are especially important in that they occupy over 70% of the country’s land surface, include the most extensive areas of semi-natural habitat, the majority of the land that is either designated under the EU Birds directive or occupied by Annex 1 species and arguably present some of the greatest opportunities for conservation management. An ultimate aim of the project is to deliver habitat and re-gional specific trends for species in the up-lands for the purposes of monitoring and conservation guidance.
MONITORING OF BREEDING BIRDS IN THE INTERNATIONAL WADDEN SEA: AN EXAMPLE OF CROSS-BORDER COOPERATION IN
MONITORING AND MANAGEMENT Kees Koffijberg1*, Lieuwe Dijksen1, Bernd
Hälterlein2, Karsten Laursen3, Gerold
Lüerßen4, Petra Potel5 & Stefan Schrader2
1 SOVON Dutch Centre for Field Ornithology,
Rijksstraatweg 178, NL-6573 DG Beek-Ubbergen, The Netherlands, [email protected], [email protected]
2 National Park Agency Schleswig-Holsteinisches
Wattenmeer, Schloßgarten 1, D-25832 Tönning, Germany, [email protected], [email protected]
3 National Environmental Research Institute,
Grenåvej 12, DK-8410 Rønde, Denmark, [email protected]
4 Common Wadden Sea Secretariat,
Virchowstrasse 1, D-26382 Wilhelmshaven, Germany, [email protected]
5 National Park Agency Niedersächsisches
Wattenmeer, Virchowstrasse 1, D-26382 Wilhelmshaven, Germany, [email protected]
* Corresponding author: [email protected]
The Wadden Sea between Den Helder in The Netherlands and Esbjerg in Denmark is well-known for its large numbers of migratory and wintering waterbirds. Besides, it also repre-sents a core breeding area for many coastal breeding birds. Since 1991, surveys of breed-ing birds have been internationally co-ordinated within the Trilateral Monitoring and Assessment Program (TMAP), a trilateral co-operation between The Netherlands, Ger-many and Denmark. The monitoring scheme aims to assess and detect population size, distribution and population trends, in order to develop and evaluate trilateral management strategies that are reviewed regularly during governmental conferences. It focuses on 35 bird species that are considered characteristic for the Wadden Sea ecosystem. Common breeding birds (8 species) are counted annu-ally in 103 representative census areas. Colo-nial and rare breeding birds (27 species) are counted by annual complete counts all over the area. Once every 6 years, a total count of all species, including common species, is organised. Fieldwork is highly standardised and carried out by nearly 500 ornithologists, mainly consisting of staff of NGOs, govern-mental bodies, site managers and volunteers. Reliable trend estimates are available for 29 species for a period of 16 years. Nearly half of the monitored species (13) have been in decline since 1991. Furthermore 8 species have increased whilst 7 species have re-mained stable over the years or do not show any significant trend (1 species). With 11 out of 13 declining species, strongest declines have been observed in waders. Largest in-creases have been observed in a number of colonial breeding birds. In some species, trends differ within the Wadden Sea.
Espe-cially in The Netherlands, shellfish-eating species have suffered declines due to over-fishing of mussel- and cockle stocks. From 2010 onwards, also breeding success will be monitored in a selection of species, enhanc-ing possibilities to link changes in numbers to
demographic processes. Since most species dealt with are long-lived, monitoring of breeding success is thought to provide man-agement with an early-warning system to forecast population changes.
Session 3. BIODIVERSITY INDICATORS II: DEVELOPMENT
USING BIRDS AS INDICATORS OFTHE HEALTH OF THE ENVIRONMENT IN THE USA Gregory S. Butcher1*, John R. Sauer2,
William A. Link2 & Daniel K. Niven3
1 National Audubon Society, 1150 Connecticut
Avenue NW, Suite 600, Washington DC 20036, USA
2 USGS Patuxent Wildlife Research Center, 12100
Beech Forest Road, Laurel, MD 20708, USA
3 National Audubon Society, USA
* Corresponding author: [email protected]
The Breeding Bird Survey (BBS) started in 1966. It covers most of the contiguous 48 states of the USA, plus southern Canada. It is a half-day roadside survey repeated each year at more than 3,000 locations. Annual summa-ries of long-term trends and annual indices for species and species groups have been available since 1986. The Christmas Bird Count began in 1900; it now involves more than 60,000 participants at more than 2,000 locations in the United States and southern Canada. Long-term trends and annual indices are available for species and species groups back to the winter of 1965-66 to allow com-parisons with BBS trends and indices. Breed-ing Waterfowl Counts have been done by the U.S. Fish and Wildlife Service and Canadian Wildlife Service since the mid-1950s and provide the best data on trends and indices for several dozen waterfowl species. Trends and indices from the waterfowl surveys are used to set harvest seasons and bag limits each year; trends and indices from the BBS and CBC are used to determine international and national bird conservation priorities as reflected in the Red List of IUCN and BirdLife International, the WatchList of Audubon and the American Bird
Conserva-tion, and the list of Birds of Conservation Concern by the U.S. Fish and Wildlife Ser-vice. In addition, trends and indices from all three datasets are valuable as indicators of the health of the environment in the USA and Canada and in subsets thereof. The BBS web site has included species group trends by habitat, migratory status, and nest type for many years; Butcher and Niven summarized those data as a state of the birds report in Audubon magazine in 2004. We developed a grassland indicator that was presented to this group in 2007. In 2009, we created indicators for many habitat and species groups that were presented in “State of the Birds United States of America 2009” under the auspices of the U.S. Committee of the North American Bird Conservation Initiative. Authors of the report included many biologists from the U.S. Fish and Wildlife Service, U.S. Geological Sur-vey, and several national non-governmental organizations.
The report was widely covered in the press and has resulted in proposals for increased conservation funding both within the admini-stration and the legislature. In February of 2009, we demonstrated northward winter range shifts of a large number of bird species over the past 40 years by correlating CBC data with state-by-state data on average yearly winter temperatures. In March of 2010, we and the larger group of authors will create a new state of the birds report focused on habitat-specific analysis of vulnerability traits of North American birds. We will dis-cuss both the data limitations and the policy implications of these analyses and propose future directions for this research program.
SPATIAL MISMATCH BETWEEN BIODIVERSITY COMPONENTS IN BIRDS: NEW CHALLENGES FOR GLOBAL CONSERVATION STRATEGIES
Vincent Devictor*, David Mouillot, Christine Meynard, Frédéric Jiguet, Wilfried Thuiller & Nicolas Mouquet
* Corresponding author: [email protected]
Functional diversity is now acknowledged as essential for maintaining ecosystem function-ing and supplyfunction-ing ecosystem goods and ser-vices, while the protection of phylogenetic diversity is needed to handle long-term global changes. Biodiversity turnover among sites, so-called beta-diversity, has also been raised in theoretical and applied ecology as a key component to preserve biodiversity at multi-ple spatial scales.
However, the spatial congruence of taxo-nomic, functional and phylogenetic diversi-ties and their respective turnovers remains unknown. Using high-resolution data on the spatial distribution and abundance of birds at a country scale, we found a substantial amount of spatial mismatch between each biodiversity component. This spatial mis-match inevitably leads to unequal representa-tion of each component in protected areas: functional diversity is significantly under-represented while taxonomic turnover is significantly over-represented.
Our results challenge the use of any one di-versity component as a surrogate for other components and stress the need to adopt an integrative approach to biodiversity conserva-tion. We provide a simple conceptual and practical solution to map each component of biodiversity allowing the identification of additional conservation needs.
DYNAMICS OF BIRD DISTRIBUTION IN MEDITERRANEAN MOSAIC LANDSCAPES AFFECTED BY LARGE FOREST FIRES: AN APPLICATION OF A LARGE-SCALE MONITORING DATABASE
Elena L. Zozaya1*, Lluís Brotons1, 2, Sergi
Herrando2 & Pere Pons3
1 Forest Technology Centre of Catalonia,
Biodiversity Department, Landscape Ecology Group, Ctra. St. Llorenç de Morunys a Port del Comte km 2, 25280 Solsona, Spain
2 Catalan Ornithological Institute, Museu de
Ciències Naturals de la Ciutadella, Passeig Picasso s/n, 08003 Barcelona, Spain
3 University of Girona, Environmental Sciences
Department, Campus de Montilivi, 17071 Girona, Spain
* Corresponding author: [email protected]
Wildfires represent an important natural dis-turbance in Mediterranean terrestrial ecosys-tems, shaping the landscapes into their pre-sent mosaic-like patterns. At prepre-sent, we know very little on how fires affect patterns of species distribution. In order to understand the effects of fire on species dynamics, we are creating a large-scale database (DINDIS-Bird distribution dynamics in Mediterranean landscapes affected by fires), started in 2006, with all areas affected by large wildfires since 2000 in Catalonia (NE Iberian Peninsula). DINDIS will allow us to identify factors acting at different spatial and temporal scales affecting species dynamics, such as ecologi-cal phenomena determining colonisation and extinction processes. In this sense, this data-base could be used to identify ecological processes affecting species dynamics, giving additional information on the causes under general trends observed using other monitor-ing systems. With this purpose, within each fire perimeter we establish a series of line transects in order to describe bird community and vegetation structure. Each line transect is defined as the distance covered during 15 minutes walk at a speed of about 2 km/h. We use time rather than distance to standardise sampling in order to facilitate bird censuses in rough terrain. Censuses are conducted once
every year in good weather conditions and during the first 3 hours after sunrise. They are performed by experienced ornithologists during the breeding season (15th May-15th June).
Here, we present an example of the applica-tion of this database to study the spatial dy-namic of a bird population. Adopting a large scale perspective, we assessed to what degree colonisation of recently burnt areas is con-strained by dispersal or by the amount of post-fire suitable habitat for an open habitat bird species. We estimated the potential dis-persal flux received by each recently burnt area using available large-scale atlas data and connectivity metrics based on graph theory and evaluated our predictions using the data-base presented in this work. We found that connectivity plays a major role in colonisa-tion suggesting that the prediccolonisa-tion of species’ responses to disturbances at large spatial scales should explicitly integrate species responses to habitat changes but also infor-mation on dispersal constraints imposed by species ecology.
MIND THE GAP! WHICH EUROPEAN BIRD SPECIES NEED BETTER MONITORING, AND WHERE? Ian Burfield
European Division, BirdLife International, Wellbrook Court, Girton Road, Cambridge, CB3 0NA, UK
In recent years, inspired by long-running schemes in other countries, and encouraged by the EBCC through the Pan-European Common Bird Monitoring Scheme (PECBMS), the number and quality of na-tional common bird monitoring schemes in Europe has increased dramatically. In part, this also reflects increased state funding for the monitoring of farmland birds under the EU Rural Development Regulation. All of this is very welcome, and means we now have better information then ever before about the status and trends of common and widespread birds. This is especially true for passerines and near-passerines whose
popula-tions are concentrated in farmland, forest or urban habitats in western and central Europe. There are also promising signs of expansion east.
Similarly, thanks to the International Water-bird Census (IWC) coordinated by Wetlands International, we also have good information about the status and trends of many water-birds in Europe, especially from the annual midwinter counts. Some other groups of species are also monitored reasonably well across Europe, either because they are very popular (e.g. raptors, storks), breed colonially (e.g. seabirds, herons), or are endangered and therefore subject to conservation projects that often include monitoring (e.g. globally threat-ened species on the IUCN Red List).
However, there are a number of species groups that are not well covered by current monitoring efforts, and whose status and trends remain very poorly known. In this contribution, I aim to draw attention to these birds and use the limited information that is available to show that some of them may be in real trouble and in urgent need of more attention. To identify these species and the parts of Europe where more monitoring is needed, I will use the information collated in the two volumes of Birds in Europe, as well as a new assessment of the general state of knowledge about each species, based on an analysis of the number of scientific publica-tions featuring them.
Building on the outcomes of a workshop at the 2007 EBCC Conference, I will use the Ring Ouzel (Turdus torquatus) as an illustra-tive example of one group, comprising up-land and montane species, which we already know is particularly poorly monitored. There are of course logistical problems associated with monitoring such species, including low human (volunteer) densities, remoteness, difficult terrain and problematic weather. But in countries where these challenges have been overcome, the trends detected by moni-toring indicate that some of these species are declining fast. Given their potential exposure to the impacts of climate change, it is all the more urgent that other monitoring schemes are initiated to tell us how they are faring more widely.
ARE RAPTORS GOOD INDICATORS OF OVERALL BIODIVERSITY? A CASE STUDY FROM DADIA NATIONAL PARK
Stefan Schindler1, 2*, Vassiliki Kati3,
Martin Prinz1 & Kostas Poirazidis2, 4
1 Dptm. of Conservation Biology, Vegetation &
Landscape Ecology, University of Vienna, Rennweg 14, 1030 Vienna, Austria
2 WWF Greece-Dadia Project, Dadia, GR-68400
Soufli, Greece
3 Dptm. of Environmental & Natural Resources
Management, University of Ioannina, Seferi 2, 30100 Agrinio, Greece
4 Dptm. of Ecology & Environment,
Technological Education Institute of Ionian Islands, 2 Calvou sq, 29100 Zakynthos, Greece * Corresponding author:
The suitability of top predators, particularly birds of prey, as indicators of biodiversity was heavily discussed during the last years. One main conclusion was that despite much debate there is very few data on the topic. In this study, we evaluate if local biodiversity can be indicated by raptor species richness. We use datasets from Dadia National Park, a Mediterranean forest mosaic and local biodi-versity hotspot in north-eastern Greece. The reserve is famous for its assemblage of diur-nal raptors, a community exceeding 19 breed-ing species and 300 territories. Raptor data were sampled systematically for the years 2001-2005 and maps of breeding territories
resulted for 17 territorial species. We evalu-ated for 30 biodiversity plots sampled in the years 1999-2000, how often they were cov-ered by raptor territories, and calculated for each raptor species the probability of ‘terri-tory occurrence’ at each biodiversity plot. We correlated (a) the probability of territory occurrence for each raptor species, and (b) the average number of raptor species per year, whose territory covered the biodiversity plot, with the plots’ species richness of woody plants, orchids, orthopterans, am-phibians, reptiles and small birds as well as with its overall species richness.
We did not find significant correlations of raptor species richness with the species rich-ness of any of the six taxa, nor with overall species richness. Also the occurrence prob-ability of the single raptor species performed rather badly as indicator of biodiversity. Only for the Golden Eagle (Aquila chrysaetos) it correlated significantly with overall species richness. We conclude that at local scale a coverage by territories of many raptor species does not necessarily imply a high biodiversity for other taxa that perceive the landscape at much smaller scale. Raptors as a guild in-clude generalists as well as specialists for different habitats and different preys, which have a hierarchical multiscale habitat selec-tion that probably differs from other taxa. However, more research and further ap-proaches of assessment are needed to better understand the potential of raptors as indica-tors of biodiversity.
Session 4. COMMON BIRD MONITORING
COMMON BIRD MONITORING INFLANDERS, BELGIUM: CHANGING DENSITIES IN FOREST AND
FARMLAND BIRDS
Glenn Vermeersch1*, Iwan Lewylle2 &
Anny Anselin1
1 Research Institute for Nature and Forest, INBO,
Kliniekstraat 25, B-1070 Brussels, Belgium, [email protected], [email protected]
2 Natuurpunt.vzw, Natuurpunt.Studie, Coxiestraat
11, B-2800 Mechelen, Belgium, [email protected] * Corresponding author: [email protected]
A common bird census monitoring scheme is established in Flanders (northern part of Bel-gium) since 2007. About 400 volunteers take part in this project coordinated by the Re-search Institute for Nature and Forest (INBO) and Natuurpunt.vzw, an NGO and BirdLife
partner. It is part of the integrated bird moni-toring programme, run by INBO.
In a three-year cycle, a minimum of 900 randomly stratified 1 x 1 km plots is surveyed based on point counts. The plots were strati-fied following 6 major habitat types: urban, suburban, forest, farmland, heathland and marshland (incl. open water). In each plot, six points have to be visited 3 times (following fixed time-windows) during 5 minutes in a breeding season. All potential breeding birds are counted and all the data can be passed online through http://broedvogels.inbo.be. In 2009, the first cycle ended and the method was evaluated. During the first cycle (2007-2009) professionals conducted a parallel survey in a selection of 85 plots. Visits per point were longer (10 minutes) and all spe-cies/territories were noted on detailed maps. This study allowed us to create density-models for a number op species specific for different habitat types. The data were also used to calculate the number of ‘missed spe-cies’ per habitat type in the normal survey. Finally, the data of the parallel survey were compared to detailed inventories from the 2000-2002 atlas period. This comparison showed remarkable shifts in densities in for-est and farmland birds and - to a lesser extent - also in heathland birds.
From this year on, the Flemish common bird census data are available for the Pan-European Common Bird Monitoring and they will be merged with the data from Brussels and Wallonia.
POPULATION TRENDS OF COMMON BREEDING BIRDS IN LOMBARDY, NORTHERN ITALY, 1992-2009 Dario Massimino*, Valerio Orioli & Luciano Bani
Department of Environmental and Landscape Sciences, University of Milano-Bicocca, Piazza della Scienza 1, I-20126 Milano, Italy
* Corresponding author: [email protected]
The assessment of population trends over time is a key issue in conservation biology, but requires highly resource-demanding
monitoring programmes in order to analyse several species over large areas. For this reason, the use of all available data, even if coming from different survey projects whose purpose is not necessarily monitoring, is extremely useful to investigate historical demographic trends. In this research we de-veloped a method to assess population trends by using census data acquired with the same survey technique but different sampling schemes.
We set up the method using data coming from different point count surveys performed in the 23,800 km2 Lombardy region (northern Italy) between 1992 and 2005 and tested it on three bird species (Skylark Alauda arvensis, Swallow Hirundo rustica and Nightingale
Luscinia megarhynchos). We corrected the
bias due to the different sampling schemes by defining a population index as the ratio be-tween the numbers of observed and expected (from a generalised linear model of habitat suitability) bird pairs in each point count. We then applied this method to 59 common bird species breeding in the region. For each spe-cies, the overall trend for the period 1992-2009 was assessed by fitting a growth curve to the series of annual population indexes calculated for each year. Among the nine species that showed a significant decline, seven are associated with farmlands.
The Red-Backed Shrike (Lanius collurio) and the Skylark showed a serious population crash, with a reduction in population of about 75% and 83%, respectively, in 18 years. The Chiffchaff (Phylloscopus collybita) and the Goldcrest (Regulus regulus) were the only declining forest species. Fourteen positive trends, mainly of forest birds, were also rec-ognised. This research supports the evidence that the general decline of farmland bird species in Europe is also occurring at regional scale in Lombardy. Specific monitoring schemes would be necessary to better under-stand the processes that negatively affect their populations.
BEYOND BIRDS: HOW OTHER TAXA CAN BE EFFECTIVELY MONITORED BY VOLUNTEER BIRD SURVEYORS Kate Risely* & David Noble
British Trust for Ornithology, The Nunnery, Thetford, Norfolk, IP24 2PU, UK
* Corresponding author: [email protected]
Bird monitoring across Europe relies on the efforts of thousands of skilled and motivated volunteers - in the UK alone there are some 30,000 individuals who take part in bird sur-veys for the British Trust for Ornithology (BTO). Birdwatching is a popular pastime in many parts of the world, and numerous na-tional bird monitoring schemes are built upon this pre-existing knowledge base.
General public interest in recording other groups, such as butterflies, moths, dragon-flies, bumblebees, mammals, and plants, is lower than for birds, and these remain more specialist pursuits. As a result, our knowledge of these groups is less detailed than for birds, a matter of concern for policymakers and conservationists alike. However, within the UK birdwatching community, enthusiasm for cross-taxa recording is growing, partly due to an overall cultural shift, and partly driven by better and more accessible field and site guides, particularly for butterflies, moths and dragonflies. Therefore, to increase the na-tional monitoring capacity for other groups, it may well prove more productive to target birdwatchers, rather than the general popula-tion.
Further to this, the extensive experience of bird monitoring organisations in large-scale surveys, including mobilising volunteers on a national scale, survey design, and analysis of results, could be effectively used in collabo-rations with other organisations seeking to develop their monitoring operations.
This talk will explore these ideas, using ex-amples mainly from the BTO/JNCC/RSPB Breeding Bird Survey (BBS), the primary scheme for monitoring the UK’s bird species. Since 1995, BBS volunteers have counted mammals seen on their BBS squares, as well as recording indirect evidence of their pres-ence, with the result that BBS count data are
now used to calculate national population trends for a number of mammal species. More recently, a survey has been launched in partnership with the UK organisation Butter-fly Conservation, in which BBS volunteers are asked to carry out additional surveys along their BBS route to record butterflies, dragonflies and day-flying moths, using slightly modified methods. The response to this has been encouraging, and initial results, and feedback from volunteers, will be pre-sented, along with thoughts on how national-scale cross-taxa monitoring can be developed in the future.
HABITAT SPECIALIZATION IN LATVIAN FOREST BIRDS - SUGGESTIONS TO FOREST BIRD INDEX
Ainārs Auniņš*, Jānis Priednieks, Māris Strazds & Viesturs Ķerus
Dept. of Zoology and Animal Ecology, Faculty of Biology, University of Latvia, Kronvalda bulv. 4, LV-1010 Riga, Latvia
* Corresponding author: [email protected]
Farmland bird index has been widely ac-cepted by decision makers and scientific community as an indicator of agricultural policy and has obtained official status in EU. Development of similar indicator for the other most important terrestrial biome - the forests - would be anticipated and has been expected by policy makers. However, the recent attempts to propose a European forest bird index (FBI) based on a simple list of forest specialist species met critique from ornithologists and organizations specialising in forest conservation. Even after choosing the biogeographical approach to the species selection process, the concerns regarding subjectivity involved in the species inclusion and the indicative value of the index itself are still valid.
We used data from the Latvian common bird monitoring scheme, forest stand level GIS database (containing information on its type, tree species composition, age, etc.) and land-scape ecological covariates characterising forest patch structure. Species-habitat models