Abstract—The aim of the current study was to develop and
validate a Response to Stressful Situations Scale (RSSS) for the Portuguese population. This scale assesses the degree of stress experienced in scenarios that can constitute positive, negative and more neutral stressors, and also describes the physiological, emotional and behavioral reactions to those events according to their intensity. These scenarios include typical stressor scenarios relevant to patients with schizophrenia, which are currently absent from most scales, assessing specific risks that these stressors may bring on subjects, which may prove useful in non-clinical and clinical populations (i.e. Patients with mood or anxiety disorders, schizophrenia). Results from Principal Components Analysis and Confirmatory Factor Analysis of two adult samples from general population allowed to confirm a three-factor model with good fit indices: χ2 (144)= 370.211, p = 0.000; GFI = 0.928; CFI = 0.927; TLI = 0.914, RMSEA = 0.055, P(rmsea ≤0.005) = .096; PCFI = .781. Further data analysis of the scale revealed that RSSS is an adequate assessment tool of stress response in adults to be used in further research and clinical settings, with good psychometric characteristics, adequate divergent and convergent validity, good temporal stability and high internal consistency.
Keywords—Assessment, stress events, stress response, stress
vulnerability.
I. INTRODUCTION
HE factors that influence physical and psychological health have long been a focus of research, and one of the major focuses of research and public debate has been stress [1], [2]. As pointed out by [3], the term “stress” has multiple and complex definitions, which can more or less emphasize a subjective component, including personal experiences, or solely the biological underpinnings to a wide range of responses organisms may emit towards a variety of environmental stimulus [3]. According to [4], p.3 stress is defined as a “process in which environmental demands exceed
This research is sponsored by National Funds of FCT-Portuguese Foundation for Science and Technology- under the scope of the project PTDC/NEU-NMC/0750/2012.
C.B.C is with the Department of Educational Sciences, Azores University and CINEICC, Faculty of Psychology and Educational Sciences, University of Coimbra, Portugal (Correspondence should be addressed to: Departamento de Ciências da Educação, Universidade dos Açores, Apartado 1422, PT-9501-801 Ponta Delgada, Portugal; Telephone: (+351)296650155 e-mail: ccarvalho@uac.pt).
C.M. is with the Department of Educational Sciences, Azores University and CINEICC, Faculty of Psychology and Educational Sciences, University of Coimbra, Portugal (e-mail: carolina.d.motta@uac.pt).
M.S., J.C., and E.B.P. are with the Department of Educational Sciences, Azores University (e-mail: marinasousa@uac.pt, joana.cabral@uac.pt, peixoto@uac.pt).
A.L.C is with the Department of Life Science and Neuroscience Center (CNC) of University of Coimbra, Portugal (e-mail: alc@cnc.uc.pt).
the adaptive capacity of an organism, resulting in psychological changes that may place the person at risk of disease”. One of the most accepted definitions of stress, that will be used in the current work, was presented by [5], which proposed that stress is a transaction between the individual and the environment, that involves a cognitive assessment of the event (stressor) and the resources available to cope with it, as a way to pursue physical, psychological and emotional wellbeing [6], [5]. The stress response results from the cognitive assessment of the potential threat to individual’s wellbeing, and the assessment of individuals lacking the necessary personal or social resources to face a given stressful event [7]. Several explanatory models have differently emphasized the physiological and psychological factors, and the interactions between the organism and the environment [8]. One of the first models developed by [9] has conceptualized stress as a mostly physiological response to external threat that lead individuals to a fight or flight response. Similar to this model, [10] proposed that certain physiological responses were triggered in the presence of a stressor to allow individuals to cope with that event. Both models have been criticized for reducing individuals to a passive role, as individuals are thought to respond in an automatic fashion to the environment [8], and do not consider the psychological and emotional factors involved in the explanation of stress. Thus, [11] proposed a theory in integrating the social and psychological factors, in which stress arises as a consequence of life events, in which the resulting degree of stress was thought to be similar to all individuals. However, this model did not fully encompass the psychological and emotional processes and the influence of individual differences in the degree of stress that is caused by these life events (e.g. social rejection, losing a significant other, suffering an accident or having an illness, etc.).
In the attempt to abridge the subjective processes involved in the experience of stress and consequences to mental and physical health, [12] developed one of a more consolidated and accepted models describing the emotional antecedents associated with stress and the strategies that individuals use to reduce the negative effects of that stress on their wellbeing [13]. The transactional model [12] is based on the evaluation of stress and emphasizes the subjective character of the process by taking into consideration the cognitive evaluation that mediates the responses to stressing events [12], [14]. This subjective component is influenced by the characteristics of these life events, the frequency with which they occur, thus, an event can be regarded as more or less threatening to different individuals [15], [16]. This model encompasses three
C. Barreto Carvalho, C. da Motta, M. Sousa, J. Cabral, A. L. Carvalho, E. B. Peixoto
Development and Validation of the Response to
Stressful Situations Scale in the General Population
T
components: the stressor (an event or change in the environment that is physically or psychologically challenging for the individual), the evaluation of the stressor (how the stressor is perceived and assessed by individuals), and the stress response (the physiological and psychological consequences that result from this subjective assessment). Thus, two types of appraisal can arise. On the one hand, the appraisal of the potential threat posed by the stressor (irrelevant, benign and positive, harmful and negative), which can generate different emotional responses (e.g. Anger if a stressor is perceived to hinder the achievement of an important biopsychosocial goal, guilt if individuals believe that a stressor is a violation of their moral values, fear if the stressor is considered a threat to one’s survival, etc.). On the other hand, this appraisal process is placed on individuals, who actively evaluate the available resources to confront the stressor and consider the cost-benefit of using each coping strategy available from the individual’s repertoire, in order to determine their suitability or appropriateness to effectively respond to the stressor, and to decrease the disruptive emotional state resulting from the evaluation of the stressor as a potential threat [12]. Lazarus and Folkman [12] define coping as a complex set of psychophysiological responses that include the cognitive appraisal resulting from organism-environment interactions, drive, and somatic response patterns from specific emotions [17], [7] that result from the stressor appraisal [12] and that aims at the preservation of physical and psychological homeostasis.
Lazarus et al. [6] also proposed that individual’s subjective evaluations were fundamental to understanding the relationship between stress and illness. In addition, the diathesis-stress hypothesis gains increased acceptance as an explanatory model of the etiology of several illnesses, whether physical or mental. Stress vulnerability has been systematically found as a predictor of individual mental health [1]. Despite some illnesses have genetic predispositions, it is a fact that certain personality traits (e.g. Aggressiveness) and life events can increase vulnerability to the illness, and many of them can worsen or be induced by stress, such as PTSD, anxiety disorders, mood disorders, and schizophrenia [18], [19], [15], [20], [16], [21], [22], [23].
According to [1], the more vulnerable individuals are to stress, the higher the probabilities of developing emotional disorders as opposed to individuals with lower stress vulnerability. In the specific case of individuals with psychopathology, as is the case of schizophrenia, psychotic episodes may be also triggered due to the incapacity to adapt and respond to stressors and to re-establish a homeostatic state [24]. According to [24], internal or external changes provoke stress in all organisms, but it is the intensity of those events, as well as the ability to cope with them that will determine the degree of an individual’s vulnerability to stress [24]. Moreover, each individual possesses a certain degree of stress vulnerability, which, depending on the circumstances (genetic or environmental factors) and stressor intensity, may accelerate the onset or worsen an existing mental illness (e.g. [18], [15], [21]). Thus, as in the previous example, the
probability of patient manifest psychotic symptoms varies as a function of this degree of vulnerability and the resulting stress when facing a stressor.
The existing relationship between stress and psychopathology has led to the development of several assessment tools. The Social Readjustment Rating Scale (SRRS) by [11] is a widely used tool depicting number of life-changing experiences, which presented moderate correlation with current health and has been validated in several countries. Vaz Serra [25] has developed a scale to assess stress vulnerability in Portuguese population, the 23QVS, and studied several aspects involved in the development of psychopathology: low self-confidence, low tolerance to frustration, difficulties confronting and solving problems, excessive worrying with daily events and emotionality [25]. Connor, Vaishnavi, Davidson, Sheehan and Sheehan [26] have developed and validated the Sheean Stress Vulnerability Scale to assess stress vulnerability, and have compared perceived stress in participants from the general population with participants diagnosed with anxiety disorders [26]. Results indicated that individuals diagnosed with anxiety disorders presented a significantly higher stress vulnerability to daily stressors [26]. Tarsitani, Battisti, Biondi and Picardi [27] have also developed the Stress-related vulnerability scale, a brief measure measuring social support and perceived stress. However, despite several assessment tools related to stress construct were made available to date, most of them have focused on aspects related to stress vulnerability, resilience and/or subjective evaluations of stress responses to different events. In addition, the vast majority of measures depicts scenarios or events that would be regarded as moderate or intense stressors (i.e. Marriage, divorce, death or birth a family member, etc.) and provoke significant disruption regardless an individual condition, and do not contemplate milder events that could potentially distinguish healthy individuals from those who are more prone or affected by psychiatric disorders. Indeed, even situations commonly regarded by most people as trivial or innocuous or “positive stressors” (Eustress), such as entering a crowded supermarket or being invited to go out for dinner, can cause significant distress for individuals suffering from anxiety disorders or even constitute a trigger for individuals who suffer from psychotic disorders. To the best of our knowledge, despite several measures of perceived stress are available to assess different aspects related to stress vulnerability, the existing scales generally encompass negative or highly stressful scenarios that are known to be distressing to all individuals, and that are sensitive enough to distinguish clinical from non-clinical populations. In addition, it seems that no measures currently in use include stress-inducing events that can clearly differentiate stressful events with different valences and intensity, addressing the different reactions individuals present in response to these events. Thus, the main goals of the current study is (a) to devise a scale with scenarios that differ in terms of their intensity and valence, the Response to Stressful Situations Scale (RSSS), (b) to validate and confirm its latent structure in the general population, and (c) to identify the resulting physiological, emotional and
behavioral reactions of these respondents without psychopathology. These three initial goals and preliminary validation on a non-clinical sample are an important step to establish the psychometric properties of the measure and provide reference values for future studies aiming at exploring the differential impact of the RSSS scenarios in respondents with specific psychopathology.
II. METHODS
A. Participants
The sample in this study is a convenience sample of 727 Portuguese participants. The questionnaires were distributed to college students and more participants were recruited through snowball sampling. All participants were informed about the study’s goals, the confidentiality and anonymity of the data being collected and then signed an informed consent form prior to the assessment protocol administration.
B. Procedures
1. Item Development
As mentioned above, the distinctive feature of the scale would be the depiction of several scenarios that could induce different degrees and valences of stressors as a way to distinguish individuals who are more vulnerable to stress, at risk or suffering from psychiatric disorders. With this goal in mind, the items of RSSS were developed taking into account the current literature (e.g.: [28], [29], [15], [30], [24]) and the clinical expertise of two clinical psychologists and one community psychologist, who had also experience in mental health research and development of assessment instruments.
The first version of the scale comprised 22 items depicting stress-inducing scenarios divided into three categories, according to their valence: positive (scenarios involving gains, e.g.: Earning a prize, achieving an important personal goal), negative (scenarios involving loss, e.g.: Losing a job or a loved one), and neutral stressors (scenarios that have no definite positive or negative valence, e.g. Entering a crowded coffee shop, being at a party where people are being loud, having the furniture rearranged in a room). The degree of stress experienced in each scenario is rated on a 10-point Likert-like scale (1 = no stress to 10 = extreme stress). The RSSS also has an additional section in which respondents can report several responses to stressors they have identified, according to scenario intensity: physiological responses (e.g. Sweating, shivering, tachycardia), and behavioral responses (e.g. Crying, worrying/brooding, social withdrawal, neglecting personal hygiene, substance abuse). To avoid subjective bias in the evaluations of what constitute “low”, “medium” and “high” intensity stressors, each question contained at least three examples of objective scenarios depicted in the previous section (e.g. Entering a crowded coffee shop or an over lit supermarket for stressors with lower intensity, getting ill, suffering a minor accident or refurbishing the house for medium intensity, and losing one’s job or losing a significant other, as high intensity stressors). This preliminary version was given to two experts (clinical psychologists) and
administered to 10 participants from the general population who shared their impressions on any difficulties or questions raised during questionnaire completion regarding items or instructions. Based on their feedback no contents needed to be changed, but some adjustments were made in the instructions paragraph and some words in the items were changed to their more accessible synonyms in order to increase their comprehensibility.
2. Statistical Analysis
Descriptive statistics, principal components analysis, reliability analysis, temporal stability, convergent and divergent validity were calculated using SPSS v. 20.0 (IBM Corp., 2011). Confirmatory Factor Analysis was carried out using Amos v. 20 (IBM Corp., 2011). Quality of model adjustment was assessed taking into account the following fit indices and reference values: Goodness of Fit Index (GFI), Comparative Fit Index (CFI) and Tucker-Lewis Index (TLI), with reference values of good adjustment above .90; Parsimony CFI with acceptable value of adjustment above .06; Root Mean square Error of Approximation (RMSEA) below .05. The reference values are accordingly to those suggested by [31] and [32]. Construct reliability and validity was evaluated through Composite Reliability (CR) and construct validity was assessed through Average Variance Extracted (AVE) [33]. Composite reliability values ≥ 0.70 and AVE ≥ 0.50 were adopted as indicators of good construct validity and reliability [33].
3. Measures
Depression, Anxiety, and Stress Scale (DASS-21; [34], [35])
is the short version of DASS-42 [36]. This scale comprises 21 items describing symptoms experienced over the past month, divided in 3 dimensions, with 7 items each: depression, anxiety and stress. The items are rated on a Likert-like scale from 0 “it did not apply to me at all” to 3 “it applied to me very much”. Both original and Portuguese versions presented a good internal consistency for the Depression (original version: α = 0.94; Portuguese version: α = 0.85), Anxiety (original version: α = .87; Portuguese version: α =0 .74) and Stress (original version: α = .91; Portuguese version: α = 0.81) dimensions [35], [37]. In the current study, internal consistencies were 0.94 (Depression: α = 0.88, Anxiety: α =0.86, Stress α =0 .88).
Vulnerability to Stress Questionnaire (Questionário de Vulnerabilidade ao Stress, QVS-23; [25]). This scale assesses
vulnerability to stress. It comprises 23 items rated on a 5-point Likert-like scale (0 = “I totally agree” to 4 = “I totally disagree”), with higher scores suggesting more vulnerability to stress. Validation studies in a 368 Portuguese participants presented Cronbach’s alpha of α = 0.82 and a cutoff value of 43 as indicator of high vulnerability to stress. In an exploratory factor analysis, 7 factors were found: perfectionism and frustration intolerance, functional dependency and inhibition, lack of social support, adverse life conditions, dramatization, subjugation and reject and affect deprivation [25]. For the purposes of this study, we have used
the general vulnerability to stress scores. Internal consistency for the current sample was of α = 0.85.
Short Warwick-Edinburgh Mental Well-being Scale (SWEMWBS; [38]) is the short version of Warwick-Edinburgh
Mental Well-being Scale (WEMWBS; [39]). This widely used scale assesses well-being and focuses on the positive aspects of mental health. The scale consists of 7 items rated in a 5-point Likert-like scale, ranging from 1 = “None of the time” to 5 “All of the time”. The higher scores are indicators of good mental health and well-being. Validation studies were carried out in a representative sample of the general population, and internal consistencies were very good (α = 0.90) (Stewart-Brown, et. al 2009). In the current sample, Cronbach’s alpha was 0.83.
The Connor–Davidson Resilience Scale (CD-RISC, [40],
[41] comprises 25 items that measure resilience or capacity to change and cope with adversity. The items are rated on a Likert-like scale from 0 “not true at all” to 4 “true nearly all the time”. Higher scores are indicators of high resilience. The original version presented a good internal consistency (α = 0.89). Internal consistencies were 0.85 in the current sample.
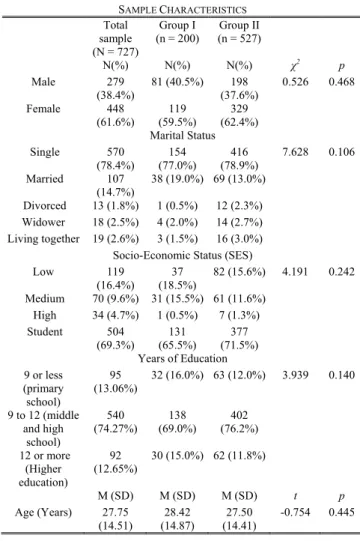
TABLEI SAMPLE CHARACTERISTICS Total sample (N = 727) Group I (n = 200) (n = 527) Group II N(%) N(%) N(%) χ2 p Male 279 (38.4%) 81 (40.5%) 198 (37.6%) 0.526 0.468 Female 448 (61.6%) 119 (59.5%) 329 (62.4%) Marital Status Single 570 (78.4%) (77.0%) 154 (78.9%) 416 7.628 0.106 Married 107 (14.7%) 38 (19.0%) 69 (13.0%) Divorced 13 (1.8%) 1 (0.5%) 12 (2.3%) Widower 18 (2.5%) 4 (2.0%) 14 (2.7%) Living together 19 (2.6%) 3 (1.5%) 16 (3.0%) Socio-Economic Status (SES) Low 119 (16.4%) 37 (18.5%) 82 (15.6%) 4.191 0.242 Medium 70 (9.6%) 31 (15.5%) 61 (11.6%) High 34 (4.7%) 1 (0.5%) 7 (1.3%) Student 504 (69.3%) (65.5%) 131 (71.5%) 377 Years of Education 9 or less (primary school) 95 (13.06%) 32 (16.0%) 63 (12.0%) 3.939 0.140 9 to 12 (middle and high school) 540 (74.27%) 138 (69.0%) 402 (76.2%) 12 or more (Higher education) 92 (12.65%) 30 (15.0%) 62 (11.8%) M (SD) M (SD) M (SD) t p Age (Years) 27.75 (14.51) 28.42 (14.87) 27.50 (14.41) -0.754 0.445 III. RESULTS A. Sample Characteristics
This study comprises a total sample of 727 individuals. Concerning gender, 38.4% participants were male and 61.6% were female, with an average of 27.75 years old. Most participants were single and students from high schools or college. Most participants had completed 9 to 12 years of education, which is equivalent to high school (compulsory education). Regarding socioeconomic status, the sample comprised mostly students and middle-class workers. Sample characteristics are presented in Table I. A group of 200 participants (Group I) was randomly selected for a principal component analysis (PCA), and confirmatory factor analysis (CFA) was performed on the remaining 527 participants sample (Group II). Both Groups were equivalent regarding gender, marital status, years of education and SES distribution, and age.
B. Dimensionality Analysis
As mentioned above, preliminary principal components analysis was carried out in the subsample of 200 participants, an equivalent group in terms of sociodemographic characteristics. Initial Cronbach’s alpha suggested that the total scale presented good internal consistency (α = 0.89) and none of the items presented significant increases in internal consistency if deleted. For this reason, no items were deleted from analysis at this stage. Kaiser-Meyer-Olkin measure of sample adequacy and Bartlett’s Sphericity Tests showed that the sample was adequate and factorable (KMO = 0.875; χ2 = 1713.695, p = 0.000). Principal components analysis with Oblimin rotation (set to extract components with Eigenvalues superior to 1) revealed a factor structure comprising 4 factors that explained 56.14% of the total variance of the scale. However, the fourth factor was composed of 2 items explaining a small amount (4.93%) of the total variance. Through the observation of scree plots, Pattern and Structure matrices, a 3-factor solution was tested, which explained 50.26% of the total variance of the scale. In this three-factor solution, the first component included items relating to
Negative Stressors (e.g. “1. Death of a close friend or
relative”, “11. Losing my job”, “9. Suffering an accident or becoming ill”, “14. To owe someone money”, “21. Committing an offense, such as DUI, speeding or disobeying an authority”), the second component included Positive
Stressors (“17. Being publicly acknowledged for something I
have done”, “19. To accomplish an important personal goal”, “12. Receiving and unexpected visit from a friend or family member”), and the third component grouped Neutral Stressors (“16. Entering a crowded coffee shop”, “18. Going to a party or family gathering in which people are speaking loudly”, “13. Eating in public”, “2. Being invited to go out for dinner”). Some items from the Neutral stressors (“3. Making minor repairs or refurbishments at home”; “4. Entering an over lit supermarket”, “7. Moving from home”, “10. Changing the positions of the furniture in a room”, “12. Receiving an unexpected visit from a friend or family member”) presented
mixed or similar loadings in the Positive and Negative factors, but because this was an exploratory analysis, items were kept in this component for further testing.
Based on this factorial solution, a model was tested through Confirmatory Factor Analysis in the second sample (n = 527). Prior to analysis, Mahalanobis Distance test for normality was used to detect multivariate outliers that could have a negative impact in Structural Equation Models (SEM), and 15 outlierswere removed. The first model presented poor adjustment indices: χ2(149)= 758.503, p = 0.000; GFI = 0.872; CFI = 0.848; TLI = 0.829, RMSEA = 0.072, P(rmsea ≤0.005) = 0.000; PCFI = 0.778. Items factor loadings were also inspected, and items 3,4,7,10,20 (“20. Speaking in public or in front of a lot of people”) presented lower individual reliability (λi< .25). Items 3, 7 and 10 presented the lowest individual reliability and were excluded from analysis. Items 4 and 20 presented individual reliability values close to the cutoff value (λ = 0.23 and λ = 0.24). However, these items were kept for two reasons: first, the response distributions were slightly skewed on these items (negatively for public speaking and positively for entering an overlit supermarket) and also platykurtic for item 4, which are expectable response tendencies for this scenario in individuals from the general population; second, this may suggest their relevance for the construct and potential in discriminating patients from the general population studies including clinical samples (e.g. changing furniture in a room may cause increased stress in patients with OCD, or speaking in public can be an extremely stressful scenario for patients with social phobia, or entering overlit places can generate more stress in patients with schizophrenia, while most healthy individuals report feeling little or no stress). The second model presented improvements
in adjustment fit indices, but with values slightly below desirable: χ2(149)= 480.455, p = 0.000; GFI = 0.903; CFI = 0.893; TLI = 0.878, RMSEA = 0.066, P(rmsea ≤0.005) = 0.000; PCFI = 0.778. Modification indices analysis suggested that freeing some parameters in this model would improve overall model adjustment. Therefore, the errors from items 14 and 21, 11 and 21, 21 and 22 from the Negative Stressor factor and items 6 and 15, 8 and 20 from the Positive Stressors dimensions were correlated. After freeing those five parameters, models adjustment revealed a good fit: χ2 (144)= 370.211, p = 0.000; GFI = 0.928; CFI = 0.927; TLI = 0.914, RMSEA = 0.055, P(rmsea ≤0.005) = 0.096; PCFI = 0.781.
Composite Reliability (CR) was calculated to assess the model’s discriminant validity. The CR values obtained for each factor were acceptable: CRNegativeStressor = 0.778, CRPositiveStressor = 0.825; CRNeutralStressor = 0.765. Convergent validity of the model was assessed through Average Variance Extracted, in which values for the three dimensions were below the reference values proposed by Fornell and Larker [33]: AVENegativeStressor = 0.34, AVEPositiveStressor = 0.41; AVENeutralStressor = 0.40.
C. Response to Stress Scenarios
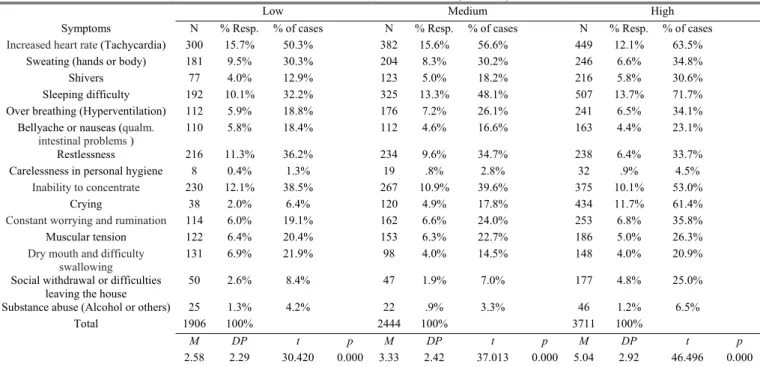
The second section of the RSSS comprises three multiple response items, in which respondents are asked to identify the physiological, emotional and/or behavioral reactions they identify in the presence of stressors of different intensity. As presented in Table II, the number of identified signs and symptoms increases with the intensity of the stressors, and the average number of symptoms reported differ significantly depending on stressor intensity.
TABLEII
MULTIPLE RESPONSE ANALYSIS OF REACTIONS IDENTIFIED WHEN FACING STRESSORS OF LOW,MEDIUM, AND HIGH INTENSITY AND ONE-SAMPLE T-TESTS
Low Medium High
Symptoms N % Resp. % of cases N % Resp. % of cases N % Resp. % of cases
Increased heart rate (Tachycardia) 300 15.7% 50.3% 382 15.6% 56.6% 449 12.1% 63.5%
Sweating (hands or body) 181 9.5% 30.3% 204 8.3% 30.2% 246 6.6% 34.8%
Shivers 77 4.0% 12.9% 123 5.0% 18.2% 216 5.8% 30.6%
Sleeping difficulty 192 10.1% 32.2% 325 13.3% 48.1% 507 13.7% 71.7%
Over breathing (Hyperventilation) 112 5.9% 18.8% 176 7.2% 26.1% 241 6.5% 34.1%
Bellyache or nauseas (qualm.
intestinal problems ) 110 5.8% 18.4% 112 4.6% 16.6% 163 4.4% 23.1%
Restlessness 216 11.3% 36.2% 234 9.6% 34.7% 238 6.4% 33.7%
Carelessness in personal hygiene 8 0.4% 1.3% 19 .8% 2.8% 32 .9% 4.5%
Inability to concentrate 230 12.1% 38.5% 267 10.9% 39.6% 375 10.1% 53.0%
Crying 38 2.0% 6.4% 120 4.9% 17.8% 434 11.7% 61.4%
Constant worrying and rumination 114 6.0% 19.1% 162 6.6% 24.0% 253 6.8% 35.8%
Muscular tension 122 6.4% 20.4% 153 6.3% 22.7% 186 5.0% 26.3%
Dry mouth and difficulty swallowing
131 6.9% 21.9% 98 4.0% 14.5% 148 4.0% 20.9%
Social withdrawal or difficulties
leaving the house 50 2.6% 8.4% 47 1.9% 7.0% 177 4.8% 25.0%
Substance abuse (Alcohol or others) 25 1.3% 4.2% 22 .9% 3.3% 46 1.2% 6.5%
Total 1906 100% 2444 100% 3711 100%
M DP t p M DP t p M DP t p
2.58 2.29 30.420 0.000 3.33 2.42 37.013 0.000 5.04 2.92 46.496 0.000
D. Reliability Analysis
Scale Reliability analysis was calculated for each factor in the final three factor solution in the complete sample: Negative Stressors, α = 0.79; Positive Stressors, α = 0.82 and Neutral Stressors, α = 0.73. All values are either good or very good indicators of the measure’s reliability. The RSSS was administered to a group of 26 participants (students) in a second moment after a month interval. Pearson correlation coefficients showed a good relative reliability for the three dimensions (Negative, r = 0.589, p = 0.002; Positive, r = 0.800, p = 0.000 and Neutral, r = .688, p = .0009). The absolute reliability was tested through paired sample t-tests and none of the dimensions presented significant differences in the first and second assessment moment (See Table III).
TABLEIII PAIRED SAMPLE T-TEST (N =26)
Time 1 Time 2 t p
M SD M SD Negative stressor 52.31 10.27 51.27 9.59 0.587 0.563 Positive stressors 33.31 14.40 33.23 14.05 0.044 0.966 Neutral stressors 14.46 7.22 14.00 6.87 0.422 0.676
E. Convergent and Divergent Validity
To assess construct validity, convergent and divergent validity, and Pearson correlation coefficients were computed between RSSS and scales assessing vulnerability to stress, depression, anxiety and stress symptoms, and resilience and well-being (the QVS, DASS, SWEMWBS and CD-RISC). All correlations between the dimensions of the RSSS and QVS were statistically significant in the expected sense, and results showed a positive association between those variables, indicating the association between stress vulnerability and the degree of stress endorsed in different situations. A moderate positive correlation was found between DASS dimensions with the RSSS Neutral Stressors, while weaker associations were found with Positive and Negative stressors and symptoms of anxiety, stress and depression. As expected, higher scores on the RSSS dimensions were negatively correlated with wellbeing (SWEMWBS). The lack of associations between dimensions of the RSSS and resilience (CD-RISC) provide evidence of the divergence between both constructs assessed by these measures (See Table IV).
TABLEIV
PEARSON’S CORRELATIONS BETWEEN RSSS,QVS,EADS,WEMWBS (N=727) AND CD-RISC(N=23) RSSS Negative Stressors RSSS Positive Stressors RSSS Neutral Stressors QVS – Total 0.133** 0.263** 0.337** EADS - Stress 0.261** 0.306** 0.372** EADS - Anxiety 0.176** 0.276** 0.444* EADS - Depression 0.106** 0.245** 0.396** SWEMWBS -0.134** -0.268** -0.357** CD-RISC – Total 0.063 0.132 0.049 *p < .05 level; **p<.01 F. Discriminant Ability
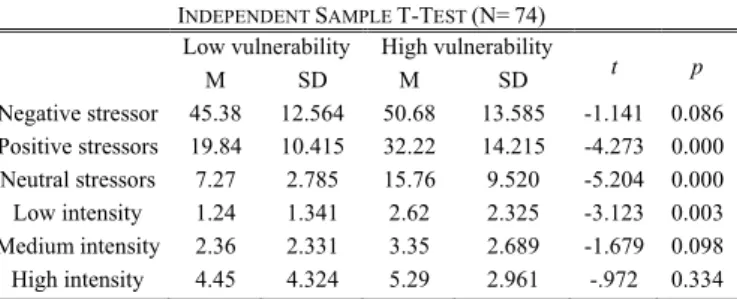
In order to assess whether the RSSS scores have the ability to discriminate participants with high or low vulnerability to stress, the sample was divided according to the QVS-23 cutoff value (scores above 43 indicating high stress vulnerability). In order to allow the comparisons of low and high vulnerability groups and to perform independent sample t-test, a random sample of participants from the high vulnerability group was drawn in order to create a homogenous group that matched the 37 participants from the low vulnerability group in sample size.
Independent sample t-test showed that individuals presenting vulnerability to stress present significantly higher scores when compared to individuals with little or no vulnerability to stress, and endorse significantly higher in symptoms, emotional and behavioral reactions to low intensity stressors only (Table V).
TABLEV
INDEPENDENT SAMPLE T-TEST (N=74) Low vulnerability High vulnerability
t p M SD M SD Negative stressor 45.38 12.564 50.68 13.585 -1.141 0.086 Positive stressors 19.84 10.415 32.22 14.215 -4.273 0.000 Neutral stressors 7.27 2.785 15.76 9.520 -5.204 0.000 Low intensity 1.24 1.341 2.62 2.325 -3.123 0.003 Medium intensity 2.36 2.331 3.35 2.689 -1.679 0.098 High intensity 4.45 4.324 5.29 2.961 -.972 0.334 IV. DISCUSSION
The current study aimed at the development of a new measure assessing individual’s experiences of subjective stress when facing several environmental challenges (stressors), and their behavioral, emotional and physiological responses to these stressors according to their intensity. Although several measures of subjective stress and vulnerability to stress are currently available, the main purpose of this scale was to create a diverse set of items depicting scenarios that are considered positive, negative and neutral in their valence. At the same time, these scenarios should cover a wider range of stressors’ intensity, including minor daily stressors and more significant or intense common life events, which could lead to better sensitivity in distinguishing healthy individuals from more vulnerable clinical groups (for example, anxiety disorders, or patients with schizophrenia, in which minor environmental changes can trigger psychotic symptoms or full-blown episodes). For this reason, this first step has focused on the validation and study of the latent factor structure of the RSSS on the general population, as a way to establish a psychometrically sound instrument and a “baseline” for future comparisons with specific clinical population. In addition, because the scale is also meant to be used in clinical settings, the scale was to be kept as brief and simple as possible.
With these goals in mind, 22 items were developed and analyzed in a sample of participants from the general population. Preliminary analysis in a subgroup of participants
revealed a 3-factor structure encompassing positive, negative and neutral scenarios, in which some items from the neutral component presented cross-loadings in the positive and negative components. In order to confirm this latent structure, CFA was carried out in a second sample of 527 subjects. The final model presented good adjustment after elimination of 3 items with low individual reliability, and comprised situations grouped by three valences: Positive, Negative and Neutral stressors.
Reliability analysis presented good internal consistency for the three dimensions of the scale and good temporal reliability. Moreover, construct validity analysis showed that the RSSS is a valid instrument, in which increased stress vulnerability, stress and anxiety symptomatology, and decreased levels of wellbeing, are associated with higher endorsement of stress in all kinds of stressors depicted in the RSSS.
Interestingly, the higher associations were found with situations depicting more neutral stressors. Individuals presenting scores in neutral stress tended to be more associated with stress, anxiety and depressive symptomatology than scores in stressors with positive or negative valence. Most people from the general population would present stress responses to significant life events, consistently measured by most instruments focusing on stress, regardless of their degree of vulnerability or coping abilities. However, the reactions to neutral and low intensity stressors may be key distinguishing individual functioning at more pathological levels. This finding is congruous with the idea that even daily hassles or mild stressors may cause more disruption in vulnerable individuals. Nevertheless, further research on the causality of these associations and the potential to discriminate extreme or clinical groups would be needed in future studies, as these hypotheses are beyond the scope of the current study. The main goal of the current study was to suppress the gap in the evaluation of stress responses to stressors of different intensity and valences, and made it available in a single brief instrument. The current study has shown that the RSSS can be useful in the assessment of stress reactivity and vulnerability. Nevertheless, despite the RSSS can distinguish people with higher and lower stress vulnerability, future studies should aim at observing this discriminant ability in specific clinical populations, namely patients diagnosed with mood, anxiety disorder, or individuals with schizophrenia.
It is noteworthy that scale was developed in Portuguese, the fourth most spoken language in the world with more than 240 million native speakers, thus allowing professional spread all across the globe to use this assessment tool whether in clinical or research settings [42] Future studies should also aim to validate the RSSS properties in different languages to populations from different cultural background, and may help further refine this instrument, if necessary.
This study is not free from limitations. The use of a convenience sample may limit the generalization of results from this study. Nevertheless, this was a preliminary analysis aiming at the development of a psychometrically sound measure and further studies are being carried out for model
cross-validation and to explore the discriminant ability of the RSSS in clinical samples.
In sum, the RSSS is a valid self-report measure with good psychometric properties. The brief and simple administration format makes the RSSS a cost-effective tool to be used both in research and clinical settings in the future.
REFERENCES
[1] A. P. Amaral and A. V. A. Z. Serra, “Vulnerabilidade ao Stress , Circunstâncias Adversas e Estado de Saúde – Estudos transversais,” no. 1, pp. 5–12, 2010.
[2] N. P. Daskalakis, R. C. Bagot, K. J. Parker, C. H. Vinkers, and E. R. de Kloet, “The three-hit concept of vulnerability and resilience: toward understanding adaptation to early-life adversity outcome.,”
Psychoneuroendocrinology, vol. 38, no. 9, pp. 1858–73, Sep. 2013.
[3] K. H. Nuechterlein and M. E. Dawson, “A heuristic vulnerability/stress model of schizophrenic episodes.,” Schizophr. Bull., vol. 10, no. 2, pp. 300–12, Jan. 1984.
[4] S. Cohen, W. J. Doyle, D. P. Skoner, B. S. Rabin, and J. Gwaltney, J. M, “Socialties and susceptibility to the common cold,” J. Am. Med. Assoc., vol. 277, pp. 1940– 1944, 1997.
[5] R. S. Lazarus and R. Launier, “Stress-related transactions between person and environment,” in Perspectives in interactional psychology, L. A. Pervin and M. Lewis, Eds. New York: Plenum Press, 1978, pp. 287– 327.
[6] R. S. Lazarus, a DeLongis, S. Folkman, and R. Gruen, “Stress and adaptational outcomes. The problem of confounded measures.,” Am.
Psychol., vol. 40, no. 7, pp. 770–785, 1985.
[7] R. Straub, “Estresse,” in Psicologia da Saúde, R. Straub, Ed. Porto Alegre: Atmed, 2007, pp. 113–149.
[8] J. Teixeira, “Psicologia da saúde,” Análise psicológica, vol. 3, pp. 441– 448, 2004.
[9] W. B. Cannon, The wisdom of the body. New York: Norton, 1932. [10] H. Selye, The stress of life. New York: McGraw-Hill, 1956.
[11] T. Holmes and R. Rahe, “The social readjustment rating scale,” J.
Psychosom. Res., vol. 11, no. 2, pp. 213–218, 1967.
[12] R. S. Lazarus and S. Folkman, Stress, Appraisal and Coping. New York: Springer, 1984.
[13] P. Bennett, Introdução clínica à psicologia da saúde. Lisboa: Climepsi, 2002.
[14] R. S. Lazarus, Stress and Emotion: A New Synthesis. New York: Springer, 1999.
[15] W. P. Horan, J. Ventura, K. H. Nuechterlein, K. L. Subotnik, S. S. Hwang, and J. Mintz, “Stressful life events in recent-onset schizophrenia: Reduced frequencies and altered subjective appraisals,”
Schizophr. Res., vol. 75, no. 2–3, pp. 363–374, Jun. 2005.
[16] M. M. Matthieu and A. Ivanoff, “Using stress, appraisal, and coping theories in clinical practice: Assessments of coping strategies after disasters,” Br. Treat. Cris. Interv., vol. 6, pp. 337–348, 2006.
[17] S. Folkman and R. S. Lazarus, “Coping and emotion,” in Stress and
coping: An anthology, 3rd ed., A. Monat and R. S. Lazarus, Eds. New
York: Columbia University Press, 1991, pp. 207–227.
[18] Q. Abdullatif, “Effects of trait anxiety and cognitive appraisals on emotional reactions to psychological and physical stressors,” 2006. [19] P. Falkai and H. J. Möller, “Psychopathology: Genetics and the
stress-vulnerability hypothesis,” Eur. Arch. Psychiatry Clin. Neurosci., vol. 262, pp. 181–182, 2012.
[20] T. M. Lincoln, U. Köther, M. Hartmann, J. Kempkensteffen, and S. Moritz, “Responses to stress in patients with psychotic disorders compared to persons with varying levels of vulnerability to psychosis, persons with depression and healthy controls,” J. Behav. Ther. Exp.
Psychiatry, vol. 47, pp. 92–101, 2015.
[21] I. Myin-Germeys, “Emotional Reactivity to Daily Life Stress in Psychosis,” Arch. Gen. Psychiatry, vol. 58, pp. 1137–1144, 2001. [22] I. Myin-Germeys and J. van Os, “Stress-reactivity in psychosis:
Evidence for an affective pathway to psychosis,” Clin. Psychol. Rev., vol. 27, pp. 409–424, 2007.
[23] L. Renwick, D. Jackson, N. Turner, M. Sutton, S. Foley, S. McWilliams, A. Kinsella, and E. O’Callaghan, “Are symptoms associated with increased levels of perceived stress in first-episode psychosis?,” Int. J.
Ment. Health Nurs., vol. 18, pp. 186–194, 2009.
[24] J. Zubin and B. Spring, “Vulnerability: a new view of schizophrenia.,” J.
Abnorm. Psychol., vol. 86, no. 2, pp. 103–126, 1977.
[25] A. Vaz Serra, “Construcção de uma escala para avaliar a vulnerabilidade ao stress: a 23 QVS,” Psiiquiatria Clínica, vol. 28, no. 4, pp. 279–308, 2000.
[26] K. M. Connor, S. Vaishnavi, J. R. T. Davidson, D. V Sheehan, and K. H. Sheehan, “Perceived stress in anxiety disorders and the general population: a study of the Sheehan stress vulnerability scale.,”
Psychiatry Res., vol. 151, no. 3, pp. 249–54, Jun. 2007.
[27] L. Tarsitani, F. Battisti, M. Biondi, and A. Picardi, “Development and validation of a Stress-related Vulnerability Scale,” Epidemiol. Psichiatr.
Soc., vol. 19, pp. 178–182, 2010.
[28] C. C. Gispen-de Wied and L. M. C. Jansen, “The stress-vulnerability hypothesis in psychotic disorders: focus on the stress response systems.,” Curr. Psychiatry Rep., vol. 4, no. 3, pp. 166–170, 2002. [29] C. Goh and M. Agius, “The stress-vulnerability model how does stress
impact on mental illness at the level of the brain and what are the consequences?,” Psychiatr. Danub., vol. 22, no. 2, pp. 198–202, Jun. 2010.
[30] M. Sato, “Introduction: Stress-vulnerability concept of schizophrenia,”
Eur. Neuropsychopharmacol., vol. 6, p. 215, Jun. 1996.
[31] R. . Kline, Principles and Practice of Structural Equation Modeling. New York: Guilford Press, 2011.
[32] J. Maroco, Análise de Equações Estruturais: Fundamentos teóricos,
software & Aplicações. Lisbon: ReportNumber, 2010.
[33] C. Fornell and D. F. Larcker, “Evaluating Structural Equation Models with Unobservable Variables and Measurement Error,” J. Mark. Res., vol. 18, pp. 39–50, 1981.
[34] M. M. Antony, P. J. Bieling, B. J. Cox, M. W. Enns, and R. P. Swinson, “Psychometric properties of the 42-item and 21-item versions of the Depression Anxiety Stress Scales in clinical groups and a community sample,” Psychol. Assess., vol. 10, no. 2, pp. 176–181, 1998.
[35] J. Pais-Ribeiro, A. Honrado, and I. Leal, “Contribuição para o Estudo da Adaptação Portuguesa das Escalas de Ansiedade, Depressão e Stress (DASS) de 21 itens de Lovibond e Lovibond,” Psicol. Saúde Doenças, vol. 5, no. 2, pp. 229–239, 2004.
[36] P. F. Lovibond and S. H. Lovibond, “The structure of negative emotional states: Comparison of the Depression Anxiety Stress Scales (DASS) with the Beck Depression and anxiety inventories,” Behav. Res.
Ther., vol. 33, no. 3, pp. 335–343, 1995.
[37] M. M. Antony, P. J. Bieling, B. J. Cox, M. W. Enns, and R. P. Swinson, “Psychometric properties of the 42-item and 21-item versions of the Depression Anxiety Stress Scales in clinical groups and a community sample.”
[38] S. Stewart-Brown, A. Tennant, R. Tennant, S. Platt, J. Parkinson, and S. Weich, “Internal construct validity of the Warwick-Edinburgh Mental Well-being Scale (WEMWBS): a Rasch analysis using data from the Scottish Health Education Population Survey,” Health Qual. Life
Outcomes, vol. 7, no. 15, pp. 1–8, 2009.
[39] R. Tennant, L. Hiller, R. Fishwick, S. Platt, S. Joseph, S. Weich, and S. Stewart-Brown, “The Warwick-Edinburgh Mental Well-being Scale (WEMWBS): development and UK validation,” Health Qual. Life
Outcomes, vol. 5, no. 63, pp. 1–13, 2007.
[40] K. M. Connor and J. R. T. Davidson, “Development of a new resilience scale: the Connor-Davidson Resilience Scale (CD-RISC).,” Depress.
Anxiety, vol. 18, no. 2, pp. 76–82, Jan. 2003.
[41] J. A. Faria and M. T. Ribeiro, “The Connor-Davidson Resilience scale (CD-RISC) - Portuguese version.” 2008.
[42] P. Lewis, S. Gary, and C. Fennlo, “Ethnologue: Languages of the World,” 2005. .