F
ACULDADE DEE
NGENHARIA DAU
NIVERSIDADE DOP
ORTODaily Activity Patterns Recognition
Mário Filipe Araújo Ferreira
Mestrado Integrado em Engenharia Informática e Computação
Supervisor: Rui Camacho (FEUP)
Co-supervisor: Joana Silva (Fraunhofer Portugal AICOS)
Daily Activity Patterns Recognition
Mário Filipe Araújo Ferreira
Mestrado Integrado em Engenharia Informática e Computação
Abstract
Embedding computational capability into quotidian objects is called ubiquitous computing and is a big trend in software engineering. These objects become capable of tracking their user’s actions by the use of various sensors that can collect many types of information, such as heart rate, location and movement. All this information can be used in many ways and one of them is to compare past and present sensor metrics to establish connections and similarities between activities, with the final objective of gaining knowledge about the user of the pervasive system. Fraunhofer AICOS solutions in the field of monitoring physical activity and related metrics store large amounts of data generated during the use of such applications by the users. The analysis of this data would lead to the understanding of user’s behaviour patterns, that could greatly improve the reach of the solutions already created. The lack of knowledge about the user’s behaviour patterns prevents the solutions previously mentioned from personalizing their suggestions, strategies and recommen-dations to improve their efficiency when applied to intervene in the user’s physical, cognitive or behaviour decline.
It is quite important for caregivers to have a complete awareness of the user’s routines so they can correct the unhealthy ones. In this work the problem of using computational devices and algorithms to detect user’s routines is addressed by using frequent pattern mining techniques. To implement these methods, the data provided by the Smart Companion’s applications was parsed and used as input in a set of potentially useful algorithms for frequent item set mining, like the FP-Growth and Split and Merge algorithms. The algorithm capable of producing the best results was embedded in the pattern recognition web tool which then uses visualization methods specially developed to meet user’s needs.
The final product was validated by potential end-users, informal caregivers of the Smart Com-panion’s users, who utilized the pattern recognition tool to evaluate if new knowledge about the user’s routine was created and appropriately conveyed.
Resumo
A incorporação de capacidade computacional em objetos quotidianos tem o nome de computação ubíqua e é uma tendência em foco da engenharia de software. Estes objetos tornam-se capazes de monitorizar as ações do seu utilizador através do uso de vários sensores que recolhem variados tipos de informação, tais como a sua frequência cardíaca, localização e os seus movimentos. Estes dados podem ser usados com diversas finalidades, uma delas é a comparação de métricas senso-riais atuais e do passado de forma a estabelecer ligações e similaridades com o intuito de adquirir conhecimento acerca do utilizador do sistema pervasivo. As soluções da Fraunhofer AICOS na área de monitorização da atividade física e métricas relacionadas armazenam grandes quantidades de dados gerados durante o seu uso por parte dos utilizadores. A análise desta informção iria conduzir a uma melhor perceção dos padrões de comportamento dos utilizadores, o que consecu-tivamente iria potencializar o alcance das soluções já existentes. A falta de conhecimento relativo aos padrões de comportamento dos utilizadores impede que as soluções previamente mencionadas personalizem as suas sugestões, estratégias e recomendações para melhorar a sua eficiência quando aplicadas para intervir no declínio físico, cognitívo ou comportamental do utilizador.
Para os cuidadores é bastante importante ter um conhecimento completo das rotinas diárias do utilizador ao seu cuidado, para que este possa corrigir as que se revelam prejudiciais. No trabalho desta dissertação foi abordada a problemática do uso de dispositivos computacionais e algoritmos para detectar rotinas do utilizador através da implementação de técnicas de extração de padrões frequentes. Para implementar estes métodos os dados fornecidos pelas aplicações do Smart Companion foram filtrados e posteriormente usados como input num conjunto de algoritmos para extração de item sets frequentes, tais como o algoritmo FP-Growth e Split and Merge. O método capaz de produzir melhores resultados foi embutido na ferramenta web de reconhecimento de padrões, que aplicou posteriormente métodos de visualização especialmente desenvolvidos para as necessidades do utilizador final.
O produto final foi validado por potenciais end-users, cuidadores informais dos utilizadores do Smart Companion, que usaram a ferramenta de reconhecimento de padrões com a finalidade de avaliar se foi gerado novo conhecimento sobre as rotinas do utilizador e se esta foi transmitida da forma mais correta.
Acknowledgements
This dissertation work would not be possible without the helping hand of many people.
First and foremost, I would like to thank FEUP for all the teachings along this journey and in particular to professor Rui Camacho for all the guidance and help throughout this process.
Next I would like to thank Fraunhofer Portugal for the opportunity to work on this dissertation theme and all the resources that have been made available to me. During the project I had the chance to work with amazing people that I would like to mention: Eduardo Pereira that was always available to help me with his knowledge in UI and HCI, Sílvia Rêgo who did everything in her power to make the validation tests a success and lastly a special thanks to Joana Silva, my supervisor, for all the follow-up since day one of the project, for all the crucial guidance and overall for providing me with all the research knowledge she has, which played a major support role in the outcome of this dissertation work.
All the participants of the validation tests should also be mentioned for their availability and cooperation which was very enriching for the project.
In a more personal note, I would like to thank my friends, particularly Pedro Sousa and Alcino Sousa, for their precious tips, for the company on the train trips and for all the fun times. My fam-ily, for all the effort to put up with my bad temper during this five year adventure and particularly my sister for being a perfect spell checker.
Last but not least, I want to thank my girlfriend Sara, for all the patience, all the Sundays spent at home, all the support and every and each one of the kind words and gestures of hers to cheer me up in my bad times since my first day at college. I would also like to thank her for all the help she gave me in this dissertation work based on her knowledge and her passion for helping the other.
“It is nearly impossible for noisy minds to perceive anything but noise in data.”
Contents
1 Introduction 1
1.1 Problem Domain . . . 1
1.2 Motivation and Goals . . . 2
1.3 Document Structure . . . 3
2 Data Mining Tasks in Pervasive Systems 5 2.1 Classification Tasks of Physical Activity in Pervasive Systems . . . 5
2.2 Pattern Recognition . . . 6
2.2.1 Market Overview . . . 9
2.3 Conclusions . . . 10
3 Technologies for Activity Pattern Recognition Tasks 11 3.1 Frequent Patterns . . . 11
3.1.1 Itemset Frequent Patterns . . . 11
3.1.2 Sequential Frequent Patterns . . . 16
3.1.3 Physical Activity Pattern Recognition Models . . . 18
3.2 Visualization Methods . . . 18 3.3 Technology Survey . . . 20 3.3.1 Android . . . 20 3.3.2 Apache CouchDB . . . 20 3.3.3 Django . . . 20 3.3.4 Highcharts . . . 21 3.3.5 Pandas Profiling . . . 21 3.3.6 Pymining . . . 21 3.3.7 Phyton . . . 21 3.3.8 Python FP-Growth . . . 22 3.3.9 RapidMiner . . . 22 3.3.10 SQLite . . . 22 3.3.11 Web Services . . . 22 3.4 Conclusions . . . 23
4 Data Analysis and Parsing 25 4.1 SmartCompanion . . . 25 4.2 Dataset . . . 26 4.2.1 Retrieval . . . 27 4.2.2 Analysis . . . 27 4.2.3 Data Framework . . . 30 4.3 Algorithm Implementation . . . 32
CONTENTS
4.4 Final Database . . . 34
4.5 Conclusion . . . 35
5 Web Application 37 5.1 Activity Patterns Tool . . . 37
5.1.1 System Architecture . . . 37 5.1.2 Use Cases . . . 37 5.2 Web Interfaces . . . 38 5.2.1 Home . . . 38 5.2.2 Profile . . . 39 5.2.3 Daily Analysis . . . 40 5.2.4 Hourly Analysis . . . 41 5.3 Validation . . . 42 5.3.1 Personal Information . . . 42 5.3.2 Practical Test . . . 43 5.3.3 Usability Feedback . . . 44 5.3.4 SUS Questionnaire . . . 45
5.4 User Interface Improvements . . . 45
6 Conclusions and Future Work 47 6.1 Conclusions . . . 47
6.2 Future Work . . . 48
References 49 A Informed Consent 53 A.1 Document . . . 55
B Usability Test Script 57 B.1 Usability Test Document . . . 59
List of Figures
2.1 Algorithmic process for activity recognition from sensory data [MSEI07] . . . . 7
2.2 Graph representing activity pattern sequence using HMM and CRF[AR13] . . . . 8
2.3 Tree representation of routine patterns [AEA+08] . . . 9
3.1 Header table and its connection to the respective FP-tree . . . 14
3.2 Preprocessing steps of the SaM algorithm . . . 15
3.3 Split and merge steps . . . 15
3.4 Types of chart to use related with the main goal of the visualization method by Andrew Abela . . . 19
3.5 Spiral heatmap showing activity levels of an individual during an entire week [LG15] 19 4.1 Histogram with the age variable distribution . . . 26
4.2 Database relational scheme . . . 34
5.1 Architecture of the web application’s system . . . 38
5.2 System’s use cases from the caregiver’s perspective . . . 38
5.3 System’s base home page, to choose the user to analyse. . . 39
5.4 User’s profile interface of the tool’s UI. . . 39
5.5 Daily metrics analysis in the user’s profile interface of the tool’s UI. . . 40
5.6 Solid gauge that presents all the temporal data of the daily activity pattern in the daily analysis interface. . . 41
5.7 Physical activity and fall risk metrics presented in the daily analysis interface. . . 41
5.8 Solid gauge that presents all the temporal data of the hourly activity pattern in the daily analysis interface. . . 42
5.9 Physical activity metrics presented in the hourly analysis interface. . . 42
5.10 Tasks and interface navigation asked to the study participants. . . 43
5.11 Chart improvements in the profile interface . . . 46
5.12 Daily metric’s section improvements in the profile interface . . . 46
A.1 Informed consent document . . . 55
B.1 Usability test script page 1 . . . 59
B.2 Usability test script page 2 . . . 60
B.3 Usability test script page 3 . . . 61
B.4 Usability test script page 4 . . . 62
B.5 Usability test script page 5 . . . 63
B.6 SUS questionnaire page 1 . . . 65
List of Tables
3.1 Basic transactional dataset . . . 12
4.1 Statistics of the BMI variable . . . 27
4.2 Percentage of users in each BMI category . . . 27
4.3 Interval definition used in the parsing of the data . . . 31
4.4 Execution time of the FP mining of 5 daily records . . . 33
Abbreviations
BMI Body Mass Index
CBR Case-Based Reasoning
CRF Conditional Random Fields
FP Frequent Pattern
GSP Generalized Sequential Patterns
HMM Hidden Markov Model
HTML HyperText Markup Language
IDE Integrated Development Environment
JSON JavaScript Object Notation
K-NN K-Nearest Neighbours
LR Logistic Regression
RElim Recursive Elimination
SaM Split and Merge
SPADE Sequential PAttern Discovery using Equivalence classes
SPM Sequential Pattern Mining
SQL Structured Query Language
SSH Secure SHell
SUS System Usability Scale
SVM Support Vector Machines
TID Transaction IDentifier
UI User Interface
Chapter 1
Introduction
In this chapter there will be a succinct review of the context where this thesis work fits. The main objectives will be presented together with the motivations that guided their definition. In addition to the previous topics, the project’s focus points are presented followed by a description of the whole organization of this report.
1.1
Problem Domain
Ubiquitous or pervasive computing is a field of computer engineering that has raised a lot of interest in the last years. Mark Weiser was the precursor of this area by using this term to name
systems that have the ability to "vanish into the background" of the user’s quotidian life [Wei91].
With the permanent technological changes, this type of systems have gained a lot of impor-tance due to the capabilities that are now possible to embed in them.
One of the applicabilities of pervasive systems, whose relevance has been growing throughout the past years, is physical monitoring, specially in the elderly population. The fact that studies
across the majority of the developed countries show the population aging as a trend [SMM+12],
together with the crescent concern about physical inactivity, which was a cause factor of more than
three million deaths globally in 20081led to a rise in ubiquitous systems popularity.
Initially physical activity monitoring was accomplished by the use of sensors external to the user, but this solutions were expensive and most of them turned out being uncomfortable to use
[ASR+14]. This made the solutions intrusive, characteristic that does not comply with the
princi-ple of pervasive computing.
The industry of mobile devices has pushed this type of systems to another level due to the number of embedded sensors in new equipment. Accelerometers, GPS, compass and gyroscope are some of the most usual sensors in today’s gadgets. The information that these technologies are
Introduction
able to provide in combination with the 4G connection to internet made possible to track user’s
activities at any time and in every place, indoors or outdoors [CMMM13].
In short, the advance of sensor technology together with the endless improvements in mobile devices have created a huge source of information and computational capabilities. The imple-mentation of ubiquitous systems is a great way to take advantage of this improvements because they can be very useful to collect and treat information about the user’s activities in a cheap and non-intrusive manner.
Despite the numerous research works and applications focused in treating sensory data and classifying user’s activities, the same amount of effort was not dedicated to analyse activity pat-terns at different time intervals. The ability to delineate these patpat-terns and then draw conclusions about them could be a huge step in order to identify prejudicial behaviours related with physical inactivity which is one of the major health problems in the world, and is correlated with various
chronic diseases such as diabetes and cardiovascular health problems2. As mentioned before, with
nowadays technology we have at our disposal all the necessary tools to make pervasive systems one of the most effective weapon to fight physical inactivity by tracking user’s actions, identifying activity patterns and providing information to caregivers or suggesting behavioural changes when needed.
1.2
Motivation and Goals
Because of the continuous advances and the raising interest in pervasive systems previously men-tioned there are numerous solutions in this field released in today’s market. Most of these solutions are capable of recognizing user’s activity with a high degree of certainty by implementing differ-ent classification algorithms in datasets retrieved by ubiquitous system’s sensors. For instance, one approach using decision trees and data collected from an accelerometer accomplished an accuracy
of 99,5% [SMS14].
The result of this type of works reinforces the possibility of using classification tasks to then identify activity patterns in different time frames. That is the main goal of this project, to develop a pattern recognition tool using appropriate algorithms for the recognition of activity patterns based on hourly and daily records.
For each time frame and with the needs of the end-user, in this case the elderly’s caregiver, adequate methods of data representation and visualization must be applied in order to produce various findings and analysis that point out the most relevant trends and patterns in the user’s activity routines. In addition, the knowledge extracted in a literal analysis must be combined and parsed in order to produce more complex definitions of daily activity patterns and make it easier to fully understand the output data. To accomplish the ultimate goal of identifying and change harmful habits, meaningful recommendations should be shown to the user, for instance if a metric has values that are not in the ideal range this information should be highlighted so that the caregiver can easily identify that fact as a risk sign and an imminent need to counteract this tendency.
Introduction
This tool will be developed with the data provided by the SmartCompanion application3, and
must be a valid increment to this pervasive system, whether as a web service or an integral part of the application.
1.3
Document Structure
This document has five more chapters. Chapter2reviews the state of the art in related work and
in previous tasks that created the problem of this dissertation. Chapter3continues this review by
explaining in detail the techniques that are most relevant for this thesis work.
Chapter4contains the complete analysis and parsing process of the dataset whereas Chapter
5scrutinizes the architecture, features and validation process of the developed web application.
Finally, Chapter6presents the conclusions of this dissertation work and enunciates possible future
work in this field.
Chapter 2
Data Mining Tasks in Pervasive Systems
In this chapter, an analysis of previous related works will be presented and the main topics associ-ated with this thesis work are scrutinized.
The main steps to create a pattern recognition tool will be analysed, such as data processing, visualization methods and data mining algorithms.
To finish, the most important state of the art technologies and a market overview of activity tracking mobile applications will be presented.
2.1
Classification Tasks of Physical Activity in Pervasive Systems
As previously mentioned in Chapter1the advance of pervasive systems, specially in mobile
de-vices, has created a huge interest about classification tasks of physical activity by analysing sen-sory data. This led to various works in this field, using different classification algorithms and approaches when it comes to data collecting.
Knox et al [KCD10] used ontologies in case-based activity recognition tasks in order to
elimi-nate the need of a training phase, which is very useful in a dynamic environment where new types of activities are constantly appearing. This technique was applied in a smart-home environment with multiple sensors and to describe its layout and the relationship between its elements ontolo-gies were used, a concept originated from the philosophy field. For this purpose The Ontonym
framework [SKDN09] was chosen because of its representation of crucial concepts in pervasive
systems. On top of this environment’s model, it was used a CBR situation reasoner that analyses
current problems and tries to find solutions applied in similar previous [KCD10]. This allowed to
then use distance based algorithms, such as K-NN, to find the most resembling neighbour. Only the best solution, or classification, for each similar problem was kept in the system which created an incremental learning and reduced the casebase size. With this techniques it was accomplished an accuracy up to almost 80% in some activities.
Data Mining Tasks in Pervasive Systems
More capable mobile devices created opportunities in the field of activity monitoring and
clas-sification that were explored by several research works. Silva et al [SMS14] used a public dataset
that collected data with the natives accelerometer and gyroscope from users wearing the smart-phone at waist level. This data was characterized and processed so that it could be used to imple-ment classification machine learning algorithms. The final choice was the decision tree algorithm due to its interpretability and real-time implementation capacity. This algorithm created a model from the training dataset capable of predicting new activities with a precision of 86%. Once again using a decision tree classifier and data collected from native smartphone’s inertial sensors, Aguiar
et al [ASR+14] accomplished an overall accuracy of 99,5% in the classification of some daily live
activities such as running, walking, standing, sitting and laying.
2.2
Pattern Recognition
The amount of work in the area of activity recognition that accomplished good results boosted the need to extract and analyse patterns from the sequence of activities that were carried out over a certain period of time.
A research work carried out by Minnen et al [MSEI07] proposed an unusual problem that
de-spite not being directly related with activity pattern recognition, uses the concept of data pattern in a different point of view. Instead of trying to label activities using data collected by sensors and models trained with previously classified item sets, the team used unsupervised methods to detect activity elements present in the data recorded by on-body sensors. This approach aimed to solve a specific set of problems in this area. First of all, the discovery of acyivity patterns could suggest new options or validate previous knowledge about the relation between certain data characteristics and a specific activity. Second it would make possible to easily decompose activities in smaller elements, and finally it was important to interpret the "data from the perspective of new sensor
modalities"[MSEI07]. To accomplish what was previously referred, the chosen algorithmic
pro-cess, presented in the Figure2.1, has multiple phases. It starts by generating a set of frequently
occurring patterns also entitled "seed motifs" [MSEI07] which is done by selecting greedily the
best motif and repeat the process, without it’s occurrences in the next iteration. Then the created set is refined in order to train a Hidden Markov Model for each one of the frequently occurring patterns.
Hu`ynh et al [HFS08] also presented a solution to the discovery of activity patterns using Topic
Models as the main tool. This technique was adapted from the text mining probabilistic models and proved to be very well prepared for this type of problems. In this approach the different activities were labelled and associated with the time frame in which they happened. Then, it was possible to calculate a probability for a particular action to occur in a specific point during an activity pattern. The end result produced a daily activation matrix relating each activity with each point in time. This matrix was proved to illustrate accurately user’s typical daily patterns. Despite the partial success, one of the problems of this study was the activity size, which could be broken down into simpler tasks.
Data Mining Tasks in Pervasive Systems
Figure 2.1: Algorithmic process for activity recognition from sensory data [MSEI07]
There are a few prevalent techniques in many works throughout the field and two of them worth noticing are Hidden Markov Models(HMM) and Conditional Random Field(CRF). These
were two of the main tools in the work carried out by Allahviranloo and Recker [AR13] aiming the
discovery of activity patterns. The extraction of information related to the association tendencies and activities sequencing is usually a difficult task. To overcome this issue the two previously mentioned techniques where combined together with socio-demographic characteristics. This last addition was done because the authors believed that socio-demographic data had influence on the choice of activities and consequently in activity patterns. Normally CRF models are expressed in non-directed graphs but, since the analysis and predictions were about activity sequences, the
final model, presented in the Figure2.2, was a symbiotic relationship between HMM and notions
of CRF. The algorithmic process to develop the model used Logistic Regression, once again with CRF, to calculate the probability of selecting a certain activity at any state of the sequence. This was done, except in the first state where a more intricate formula was applied, by taking into account the socio-demographic data and the previously chosen activity in the chain of events. To overcome one major principle of HMM’s that does not comply with the study of patterns in daily activities, another approach was tested by implementing the Support Vector Machines supervised classification method. In HMM’s, transition probabilities do not vary according to time, and the use of a SVM algorithm with multiple classes allowed to change these probabilities over time. By doing so, it became possible to test the influence of all previous activities of the sequence in the choice of the next one, instead of analysing only the previous one. It was possible to notice a superior capability of the SVM approach, which was able to obtain 86% accuracy in replicating all the activity patterns, over the one using LR mainly in more complex patterns. Some reported difficulties were the need to prevent overfitting and to manage the computational cost of the processes.
Other fields have also used frequent pattern mining approaches to solve different problems, such as the classification of proteins based in the analysis of sequence patterns in their
biochem-Data Mining Tasks in Pervasive Systems
Figure 2.2: Graph representing activity pattern sequence using HMM and CRF[AR13]
ical structure. Exarchos et al [EPLF06] presented a solution to this problem where they applied
a decision tree classifier to the patterns previously extracted. In this particular case, some of the most commonly used algorithms to perform SPM, like HMM and SVM, did not succeed so the final choice fell on the SPADE algorithm. SPADE (Zaki) performs SPM with constrains, like the maximal distance between items in the sequence, and uses lattice search combined with simple joins to boost the performance while returning good results. Due to the difficulty of pattern recog-nition in unknown proteins, the final accuracy of the method was 35.9%, but the SPADE algorithm worked out extremely well, specially in terms of computational cost.
Another approach that relied on the previously mentioned algorithm was implemented by
Cheng et al [CLCT17] and aimed to detect risk patterns for the assessment of chronic diseases.
In this work the data collected from the national health insurance database of Taiwan was repre-sented as sequences of items, a list of ordered events related to each patient. After the complete data representation, the sequences are analysed and classified as frequent if they meet a minimum support threshold specified by the user and as maximal "if it is not a subsequence of any other
frequent sequence"[CLCT17]. It was possible to extract important knowledge from this method
and in coordination with the medical knowledge, the discovered frequent patterns were possible to interpret and add strength to the process of early assessment of chronicle diseases.
Differently from the previous attempts, which where more focused in analysing activity
pat-terns in a sequential manner, Ali et al [AEA+08] used a scalable architecture to analyse data
streams from a pervasive system using body sensors to collect information. Using notions from
the FP-Tree [HPY00] representation and Closet+ [WHP03] method, the chosen methodology
Data Mining Tasks in Pervasive Systems
Figure 2.3: Tree representation of routine patterns [AEA+08]
node corresponded to a smaller and non-overlapping time frame within that day, increasing from
left to right, as we can see in Figure2.3. The process to construct this structure begins by applying
the Closet+ algorithm to all transactional data in order to compute patterns and their support. Then the amount of transactions in each time frame is analysed and when this number is bigger than a specified maximum the time frame is divided in two equal, smaller time frames. The final re-sults showed high accuracy in identifying patterns together with an efficient and more compressed manner of structuring all the data.
2.2.1 Market Overview
In today’s market there are numerous solutions of mobile applications and gadgets that are able to track the user’s physical activity but almost all of them lack in some area, mostly in the activity pattern recognition. In addition to this faults a great majority of them requires some user-external sensor, like a wristband or a watch, which makes these solutions very expensive.
For example the Jaybird Reign Fitness Tracker is an activity monitoring solution that is able to recognize when activity goals are met and track the user’s sleeping schedule, but it costs over
160 dollars and implicates the use of a wristband to collect sensory data. Fitbit1can be included
in this category as well because it is one of the most successful applications that also uses external devices. In this application the user can set activity goals and be notified when they are reached, earn badges when hitting a milestone in a gamification approach or even use multiple trackers in the same profile. Fitbit also features a web page with a dashboard containing all the collected data. Differently from the previous solutions, some applications available in the main application
stores provide services of physical activity monitoring. JEFIT2 is one of them and provides
progress graphs and feedback on the defined goals. The remaining solutions are almost exclusively focused in monitoring running activities and track only basic metric such as steps or calories.
1https://www.fitbit.com/eu/app[June, 2017] 2https://www.jefit.com/[June, 2017]
Data Mining Tasks in Pervasive Systems
It was possible to verify that there is not a solution with high acceptance of the general public that is able to track and present the user’s activity routines as this dissertation work aims to do.
2.3
Conclusions
The different reviewed approaches propose a variety of methods because of the specific needs of every field and work in specific. Despite these differences, there are some techniques presented as consensual, such as the use of HMM’s and CBR. Nevertheless, these approaches do not contain some of the most widely used algorithms in the frequent pattern mining field. The algorithms and technologies that better suit the purpose of this dissertation will be explained in more detail in the following chapter.
Chapter 3
Technologies for Activity Pattern
Recognition Tasks
In this chapter the basic concepts of frequent pattern mining that are relevant to understand the dissertation work are introduced. The most used and effective methods in this field are also pre-sented. A review of the state of the art technologies that enable the execution of pattern mining tasks closes the chapter.
3.1
Frequent Patterns
A pattern is classified as frequent if it appears repeatedly in the dataset, having a frequency that is greater or equal than the specified threshold. The discovery of this patterns can have significant relevance and create knowledge about the origin of the data or even reveal interesting associations or correlations in the dataset.
There are several types of frequent pattern (FP) analysis such as itemset and sequential
pat-terns, that will be reviewed in more detail in sections3.1.1and3.1.2respectively, or even structural
patterns where the search is based in trying to find substructures that are repeated in databases with
a graph structure [HCXY07]. Although this type of patterns can be very useful in some areas, it
does not comply with this work. The use of frequent pattern mining goes back to 1993 when
Agrawal et al [AIS93] used this technique to extract all relevant association rules from the items
bought by a client in a shop. Since then many research works have focused their attentions in this field resulting in the creation of numerous approaches and techniques trying to resolve problems and explore all the opportunities created by frequent pattern mining.
3.1.1 Itemset Frequent Patterns
This type of patterns is present in transactional data, where each transaction has a set of items
Technologies for Activity Pattern Recognition Tasks
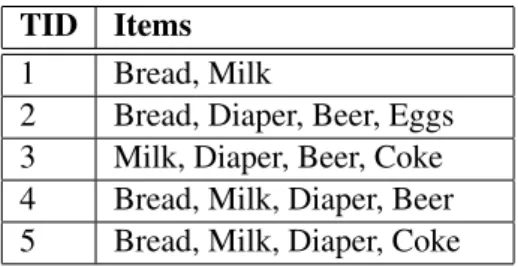
Table 3.1: Basic transactional dataset
TID Items
1 Bread, Milk
2 Bread, Diaper, Beer, Eggs
3 Milk, Diaper, Beer, Coke
4 Bread, Milk, Diaper, Beer
5 Bread, Milk, Diaper, Coke
It’s important to notice that in this type of approach the items contained in the itemset do not have any order between them.
There are some important concepts to point out when it comes to frequent itemset mining so
they are going to be reviewed based on the dataset in table3.1.
• Itemset – A group of one or more items, e.g. {Bread, Milk};
• Absolute Frequency – Can also be named Support Count and represents the number of occurrences of an itemset, e.g. {Bread, Milk, Diaper} = 2;
• Support – It is given by the ratio between the number of occurrences of a specific itemset and the number of all transactions contained in the dataset. It can be represented by the
formula3.1, where t is an itemset, T the set of all transactions in a database and t a subset
of T where X is contained. For example: Supp({Milk}) = 0.8.
Supp(X) =|{t ∈ T ; X ⊆ t}|
|T | =
4
5 (3.1)
• Minimum support threshold – Specified by the user, it is the minimum support that an itemset must have to be considered frequent.
With these main concepts as basis many different frequent itemset mining algorithms were de-veloped, some of them applicable to multiple cases and others more tailored to specific problems. The most known and successful will be presented in the next subsection.
3.1.1.1 Apriori
The Apriori, introduced by Agrawal and Srikant [AS94] in its first form, is a very straightforward
join-based algorithm and it takes advantage of two simple frequent itemset mining theorems:
1. If an itemset is frequent then each of its subsets are frequent, too. 2. If an itemset is not frequent then none of its supersets will be frequent.
Technologies for Activity Pattern Recognition Tasks
These two facts entail the algorithm’s process, that is to scan the whole database and find the support for each itemset of length 1. Once detected the frequent 1-itemsets those are used to build itemsets of length 2 that are later classified as frequent or not. This process iterates until it reaches a length k where there are no more frequent itemsets (current status).
The main issue associated with this approach is the constant need to scan the whole database at each iteration to count the support of the itemsets, which can be unbearable when treating large amounts of data.
3.1.1.2 Eclat
Unlike the Apriori algorithm, that analyses data in horizontal data format, Eclat [ZPOL97] mines
frequent patterns from transactional data in a vertical format. In this format, for each item there is a TID-set containing all the transactions where it appears which is the opposite of the horizontal data format, where to each TID there is a set of actions associated. So, this data representation solves the need of scanning the whole database to calculate the support of an item because the TID-set has all the needed information.
In terms of the algorithmic process it is very similar to the Apriori. The first iteration starts with only one item, so the frequent itemsets with length k=1 are discovered. Then each one of them is increased in length to k+1 and the support is recalculated by intersecting the TID-sets of
all the items [HCXY07]. When there are no frequent itemsets at a certain length k the process
stops.
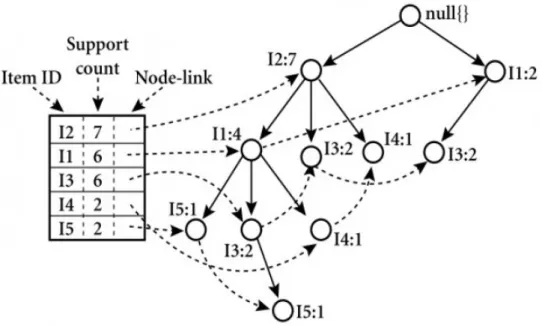
3.1.1.3 FP-Growth
In order to solve problems related with the database size such as the costly task of generating all
candidates sets and the size of the data mining problem, Han et al [HPY00] presented the
FP-Growth algorithm that uses a divide and conquer approach to decompose the task in smaller ones, reducing the search space. In this method the data is stored in a FP-tree structure that compresses the information and allows the mining of frequent patterns without candidate generation.
The first step is to create the frequent pattern tree by scanning the database and finding all the frequent items, calculating their support. In the second step infrequent items are not taken into account anymore, so the frequent items in each transaction are sorted descendingly by their frequency and processed in that same order to construct the FP-tree. Then the items of each transaction are added to the structure, already containing a root node, according to the previously mentioned order. When a new node is added to the structure its count is initialized with 1, on the
contrary if the item is already present its support count is incremented [HCXY07]. In the end of
all iterations each path from the root should represent one frequent itemset and all of them must be present in the tree.
Technologies for Activity Pattern Recognition Tasks
Figure 3.1: Header table and its connection to the respective FP-tree
A header table must also be created containing pointers to the first appearances of each item. These pointers must be linked trough all the occurrences of this specific item. An example of this
header table and its relation to the FP-tree structure is presented in the Figure3.11.
A lot of variations were developed during the last years, using different methods to build the FP-tree or adapt it to different types of data. One of these algorithms is explained in further detail in the next subsection.
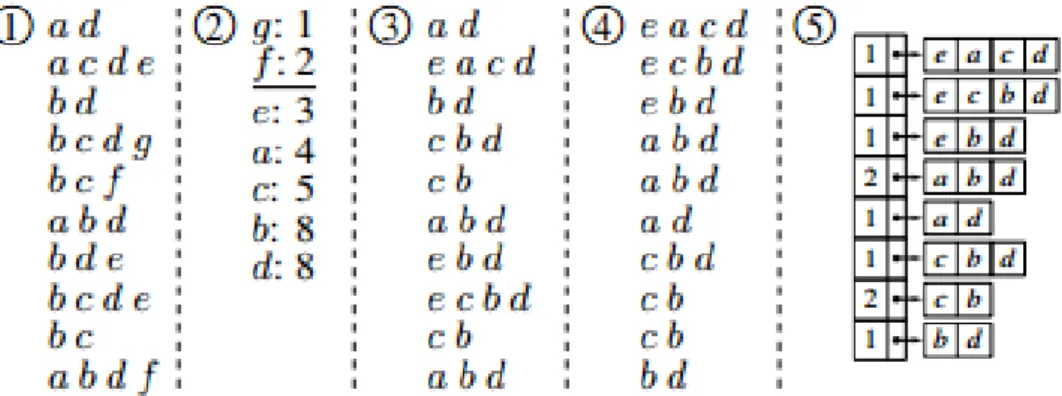
3.1.1.4 Split and Merge
Although the previously presented algorithms were considered effective there was still room for
improvement. With this idea in mind the Split and Merge(SaM) algorithm [BW09] was developed
aiming to excel with its algorithmic and structural simplicity. It was also specially designed to allow adaptations in order to work with "fuzzy" frequent item set mining tasks. This can be accomplished by assigning penalties to missing items in transactions.
The preprocessing phase of this approach is very similar to the ones mentioned above. In a transactional database item frequencies are calculated and then the items bellow the minimum support threshold are rejected. The remaining items are organized in a increasing frequency order to allow a lexicographic sorting for each transaction. Finally the result of these operations is
appended to a data structure as displayed in Figure3.2.
After these initial steps, the algorithm’s core recursive processing operations of the algorithm take place. Firstly, in the split step, the array with all the parsed data is divided by removing the item with the lowest support from all the transactions and inserting the remaining of those item
1http://singularities.com/blog/2015/08/apriori-vs-fpgrowth-for-frequent-item-set-mining
Technologies for Activity Pattern Recognition Tasks
Figure 3.2: Preprocessing steps of the SaM algorithm
sets in a separate array. The merge step unifies the two data structures, that resulted from the previous phase, by updating the support of item sets that exist in both arrays and adding the ones
that do not, as illustrated in Figure3.3.
Different experiments with the algorithm and adaptations to deal with "fuzzy" data made pos-sible to draw conclusions, and in the context of this work the most important one is the fact that it is a good approach when the data to analyse has to be filtered from external storage.
Figure 3.3: Split and merge steps
It is worth to mention another algorithm that can be seen as a precursor of this implementation,
the Recursive Elimination(RElim) algorithm [Bor05]. The basic operations are very similar, the
only step that differs is the last one, where in RElim it is used a vertical representation because the transactions are grouped accordingly to their leading item, instead of inserted in a list as in SaM.
Authors state that this method performs very well when the dataset is sparse [BW09].
3.1.1.5 Closet
The mining of frequent patterns can often be a costly task mainly because the number of itemsets that satisfy the min_sup can be very high. A very low value of min_sup can be the cause for this problem but raising it is not always a valid solution because a lot of valid knowledge can be lost.
Technologies for Activity Pattern Recognition Tasks
With the goal of trying to overcome this obstacle the concepts of maximal and closed frequent itemset can be very useful.
• Maximal – An itemset is considered maximal if none of its supersets is frequent; • Closed – An itemset is considered closed if none of its supersets has the same support; This means that it is possible to obtain all the information about the frequent itemset patterns
in a specific dataset by analysing the set of closed frequent itemsets [HCXY07]. The CLOSET
[PHM00] method tries to take advantage of this notion using FP-growth as basis and the FP-tree structure as the main compression tool.
In this approach strategies to reduce the search space in a drastic way are used together with a divide and conquer mentality to make the mining of big datasets less computationally costly. The first step is to identify all the frequent itemsets so that it is possible to divide all the frequent
closeditemsets in non-overlapping subsets in the next step. These subsets are then represented in
individual FP-trees in order to make possible to mine each one individually and recursively.
It is stated by Pei et al [PHM00] that Closet has a better performance than A-close and
CHARM, two previously developed methods to mine frequent closed datasets. An extension of
CLOSET was developed by Wang et al [WHP03] to try to improve its performance, specially in
sparse datasets.
3.1.2 Sequential Frequent Patterns
Sometimes it is important to find frequent itemsets in sequential databases where items or events
are ordered in a certain sequence, having or not a notion of time [HCXY07]. This type of FP
mining was first applied by Agrawal and Srikant [AS95] to a dataset of shopping transactions with
the main goal of collecting knowledge about the client’s shopping behaviour and the sequences of
items bought. Having I = { i1,i2,...ik } as the set of all the items, a subset of I is identified as an
itemset. An itemset S = h t1,t2,...tki where (ti⊆ I) is a sequence if it can be viewed as an ordered
list, which means that each item or event happened at a different time. We can also state that a sequence α is a sub-sequence of another sequence β if the itemsets of α are present in β in the same exact order. If this happens β can be considered a super sequence of α (han).
For example the sequence {(2),(3, 6),(9)} is contained in {(7),(2, 8),(9),(3, 6, 7),(9)} because (2)⊆(2, 8), (3, 6)⊆(3, 6, 7) and (9)⊆(9) (seq).
Similarly to the frequent itemset patterns, a sequential pattern is classified as frequent if its support meets the specified min_sup.
• Support – Is given by the ratio between the number of occurrences of a specific sequence and the number of all sequences contained in the dataset. It can be represented by the
formula3.2, where X is a subsequence s, and s is a sequence contained in S, the set of all
Technologies for Activity Pattern Recognition Tasks
Supp(X) = |{s ∈ S; X ⊆ s}|
|S| (3.2)
Some of the most used algorithms to mine frequent sequence patterns are presented next, varying in complexity and approach types.
3.1.2.1 GSP
GSP, or Generalized Sequential Patterns, was an algorithm developed by Agrawal and Srikant
[SA96] with a multi-phase iterative approach. In this technique the dataset is scanned n times,
being n the maximal length of the frequent sequences, searching for frequent patterns. It is the
version adapted to sequential patterns of the A-priori approach of itemset pattern mining3.1.1.1
and because of that it shares the same problem of being computationally heavy when treating large
databases. To solve this problem Zhang et al [ZKYC02] created the MFS algorithm, incorporating
in the GSP method a candidate generation function that allows to check frequent patterns of any length in each iteration, thus reducing the computational cost significantly.
3.1.2.2 SPADE
Using the vertical data format referred at 3.1.1.2 and most of its base concepts, Zaki [Zak01]
created the SPADE approach in which the data is transformed to a database where to each sequence corresponds a list of the objects where it occurs together with the time-stamps. After that all the frequent sequences of length k+1 can be generated by simple temporal joins on the id-lists belonging to frequent sequences of length k.
The issue of costly operations is also addressed by this algorithm as it decomposes the original problem in smaller ones, thus reducing the search space and the number of database scans needed to recognize all frequent patterns.
These search spaces previously mentioned are structured as lattices and their analysis can be done in a breadth-first or depth-first approach, whatever suits better the purpose of the pattern mining task.
3.1.2.3 PrefixSpan
Having the same divide-and-conquer mentality that is present in the previous algorithm,3.1.2.2,
PrefixSpan was proposed by Pei et al [PHC+01] and uses a first scan of the database to collect
all the frequent sequences of length k=1. After that each one of them is individually treated as a prefix and originates different sets of sequential patterns. Later studies carried out by Pei et al
[PHMA+04] showed that this approach is able to outperform SPADE and GSP in the majority of
Technologies for Activity Pattern Recognition Tasks
3.1.3 Physical Activity Pattern Recognition Models
The main algorithms of frequent pattern mining were already reviewed but there are some models not directly connected to this field that can be of great utility in the physical activity pattern area.
3.1.3.1 Topic Models
From the text mining field, Topic Models is a type of hierarchical model that can be adapted to the recognition of daily activity patterns having in consideration the time when each activity happens. Similar to a bag-of-words approach, in this model each activity a can be related to a specific
timeframe t within a day d, having a probability of occurring in that period of time [KHC10]. The
equation3.3represents the activity distribution that is expected in a set of timeframes.
p(a|d) = T
∑
a=1
p(a|t)p(t|d) (3.3)
The activation of each activity throughout the day varies accordingly to this probability func-tion and can be correlated to daily activity patterns where an higher value corresponds to a greater probability of that activity being executed by the user at that timeframe. This was the approach
used by Hu`ynh et al [HFS08] previously mentioned in2.2.
3.2
Visualization Methods
Data mining is the task of generating models or patterns from large amounts of data, using algo-rithms and methods adapted to the final goal. These created models have the power to be a great source of useful and new knowledge that otherwise would not be found, but in order for this to happen, when the process does not have a fully automatic approach, they need to be interpreted
and assimilated by an expert [Bra07]. In these cases, the human capabilities must be augmented by
improving data’s quality and the ease of understanding. The primary tools to accomplish this goal are visualization methods because they are capable of surpassing the cognitive barrier if applied in the correct manner.
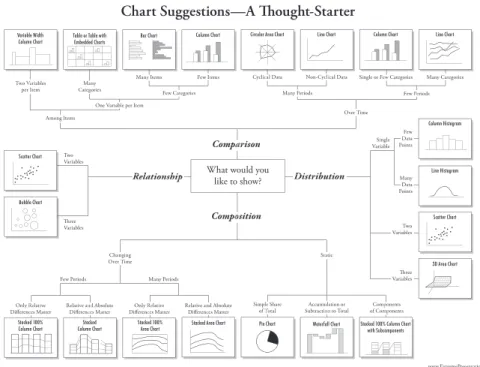
As it is possible to see in Figure3.42there is a correlation between the data type and the main
goal behind the application of a visualization method. This must be always present in the several
steps of this dissertation work, as explained later throughout the data analysis tasks in Chapter4
and during the construction of the web application, described in Chapter5.
Loudon and Granat [LG15] carried out a work in this area to adapt visualization methods
to the analysis of sedentary behaviours, which normally have some distinctive characteristics. This adaptation aimed to boost the knowledge gain from the behaviour patterns identified and
2Chart Suggestions - A Thought-Starter by Abela available at:http://extremepresentation.typepad.com/ files/choosing-a-good-chart-09.pdf[June, 2017]
Technologies for Activity Pattern Recognition Tasks
www.ExtremePresentation.com © 2009 A. Abela — [email protected]
Chart Suggestions—A Th ought-Starter
Circular Area Chart Line Chart Column Chart Line Chart
Scatter Chart
3D Area Chart
Pie Chart Waterfall Chart Stacked 100% Column Chart with Subcomponents Stacked Area Chart
Stacked 100% Area Chart Stacked Column Chart Stacked 100% Column Chart Bubble Chart Scatter Chart Variable Width
Column Chart Table or Table withEmbedded Charts Bar Chart Column Chart
Column Histogram Line Histogram Th ree Variables Two Variables Single Variable Many Periods Few Periods Two Variables Two Variables Two Variables per Item per Item
per Item CategoriesCategoriesCategoriesManyManyMany One Variable per Item One Variable per Item One Variable per Item One Variable per Item Among Items
Among Items Among Items
What would you like to show? Many Items Many Items Many Items Few Categories Few Categories Few Categories Few Items Few Items Few Items Many Periods Many Periods Many Periods Cyclical Data Cyclical Data Cyclical Data
Cyclical Data Non-Cyclical DataNon-Cyclical DataNon-Cyclical Data
Few Periods Few Periods Few Periods Single or Few Categories Single or Few Categories Single or Few Categories
Single or Few Categories Many CategoriesMany CategoriesMany CategoriesMany Categories
Over Time Over Time Over Time Comparison Comparison Comparison Distribution Distribution Distribution Few Data Data Data Points Many Data Data Points Two Variables Variables Variables Th ree Variables Variables Variables Relationship Relationship Relationship Composition Composition Composition Simple Share Simple Share Simple Share of Total of Total
of Total Subtraction to TotalSubtraction to TotalSubtraction to TotalAccumulation orAccumulation orAccumulation or of Componentsof Componentsof Componentsof ComponentsComponentsComponentsComponentsComponents Static Static Static Only Relative Only Relative Only Relative Diff erences Matter Diff erences Matter
Diff erences Matter Relative and Absolute Relative and Absolute Relative and Absolute Diff erences MatterDiff erences MatterDiff erences Matter Diff erences MatterDiff erences MatterDiff erences MatterDiff erences MatterOnly RelativeOnly RelativeOnly RelativeOnly Relative Relative and Absolute Relative and Absolute Relative and Absolute Diff erences MatterDiff erences MatterDiff erences Matter Changing Changing Changing Over Time Over Time Over Time
Figure 3.4: Types of chart to use related with the main goal of the visualization method by Andrew Abela
tried multiple approaches to the problem. The use of coloured heatmaps with a distinctive color associated with the sedentary events was one of the methodologies.
Figure 3.5: Spiral heatmap showing activity levels of an individual during an entire week [LG15]
The authors also defended that when treating time related data it is better to not separate the different timeframes because, for example, it makes possible to do direct comparisons among the
Technologies for Activity Pattern Recognition Tasks
various weekdays [LG15]. A representation of this concept is presented in the spiral heatmap
showed in Figure3.5.
Even thought the application of visualization methods is not the main focus of this disserta-tion work, a study of its current state and the understanding of the different possibilities is very important to improve the results of the final tool and even to analyse all the data in a more efficient way.
3.3
Technology Survey
The basic theoretical knowledge previously mentioned needs the aid of specialized tools that allow the implementation of the different algorithms and support the platform of the final tool. The technologies that better suit this dissertation work in many areas are presented next.
3.3.1 Android
The Android operative system3 is the most popular OS in the world and is used across multiple
devices such as smartphones or even watches. Its native language is Java4and the fact that
Smart-Companion’s application, mentioned in Section4.1, was also developed in this language, make
it so that any mobile implementation necessary in this work will be made using Java as the main tool. To do so, there are multiple IDE’s that can be very useful like Android Studio and IntelliJ IDEA.
3.3.2 Apache CouchDB
CouchDB5 is an Apache open-source database software that excels for its versatility of
imple-mentation. This characteristic enables the use of this technology in mobile devices or web servers offering at the same time high reliability and performance.
It uses JSON6, an easy to write and read file type to both humans and machines, as the primary
framework for data storage. This fact together with the developer-friendly query language makes possible to get the best out of this tool.
All the data that will be explained in detail in Chapter4is located in a CouchDB database.
3.3.3 Django
Django7is a free and open source high-level web framework written in Python that has the
advan-tage of being fast and practical enabling a clean and very pragmatic development. These features allow the developer to focus in pure implementation without having to worry about the basics of web development. 3https://www.android.com/[June, 2017] 4https://www.java.com[June, 2017] 5http://couchdb.apache.org/[June, 2017] 6http://www.json.org/[June, 2017] 7https://www.djangoproject.com/[June, 2017]
Technologies for Activity Pattern Recognition Tasks
Being secure, fast and scalable, Django was the perfect tool for this dissertation work and was the master component of the final product. The pre-built database of this framework, that is implemented in Sqlite3, was used to store all the system’s output.
3.3.4 Highcharts
Due to the great importance of the visualization methods and the need to present the information in the most clear possible way, the use of a complete chart API was crucial. The choice fell on
Highcharts8because it is very simple but at the same complete and truly flexible. More than 70 of
the world’s 100 largest companies use this chart tool, which illustrate it’s potential and reliability. Another important features of this software are the compatibility with different types of devices or web browsers and the dynamism which allows to change and add points or series to charts even after they are created.
3.3.5 Pandas Profiling
As mentioned in the previous subsection, Python has numerous packages and one that was of great
use during this dissertation work is Pandas Profiling9. It creates a detailed HTML report from a
Pandas DataFrame and was used to all the tasks related with analysing relevant data characteristics and various metrics of each variable such as quantile statistics, most frequent values, descriptive statistics and even an histogram with the value distribution.
This new knowledge about the dataset allowed for a shaper parsing but the tool was also used to validate algorithm’s output.
3.3.6 Pymining
As mentioned above Python is a programming language widely used in data mining tasks, however many of the implementations of the different methods are outdated due to the appearance of more optimized algorithms. Because of this, Barthelemy Dagenais implemented a collection of data
mining algorithms in Python called Pyminig10.
This collection contains association rules, frequent sequences and frequent itemset algorithms, which are the most important in the dissertation work and include versions of FP-Growth, RElim and SaM algorithms.
3.3.7 Phyton
Python11 is an open-source programming language that can be used for multiple purposes such
as web or game development. In recent years the use of this language in data mining tasks has
8https://www.highcharts.com/products/highcharts[June, 2017] 9https://github.com/JosPolfliet/pandas-profiling[June, 2017] 10https://github.com/bartdag/pymining[June, 2017]
Technologies for Activity Pattern Recognition Tasks
increased due to multiple factors such as its efficiency when working with large amounts of data and its multi-platform implementation.
Similarly to the R tool, Python has multiple packages that help in the type of tasks previously mentioned like Pandas and NumPy. Additionally, PyCharm will be the chosen IDE to develop web services necessary to the success of the final tool.
3.3.8 Python FP-Growth
To bridge the gap presented in Pymining, where it is questioned the performance of the implemen-tation of the FP-Growth algorithm, other solutions were searched.
Python FP-Growth12is a module of a pure Python implementation of the previously mentioned
algorithm created by Eric Naeseth and was used in the FP mining methods experiments during this work.
3.3.9 RapidMiner
This tool is one of the leading products in the field of the visual design environments. It is ex-cellent to develop analytic workflows in a short period of time because it has numerous pre-built machine learning and data preparation techniques that were very useful to accomplish a
prelimi-nary analysis of the dataset13.
The solution RapidMiner Studio allowed a quick overview and accurate representation of the data which was a a guidance to the remainder of the data processing task.
3.3.10 SQLite
In this dissertation work there is no need to embed a overly complex database in the final product
so SQLite14 presents itself as the perfect solution. On top of being embedded in Django it is
one of the most used relational database management systems. SQLite is written in C and it is possible to find it in many browsers operating systems and multiple kinds of software such as mobile applications.
3.3.11 Web Services
Server and client applications that establish a connection and communicate across the World Wide
Web are called web services15. Usually the server side application provides information from data
storage to the client sided application, where it is presented in an interface that serves the purpose of the web service to the final user.
This concept is important due to the possibility of integrating the final results into a web page.
12https://github.com/enaeseth/python-fp-growth[June, 2017] 13https://rapidminer.com/products/studio/[June, 2017] 14https://sqlite.org/index.html[June, 2017]
Technologies for Activity Pattern Recognition Tasks
3.4
Conclusions
All the study exposed in this chapter and in the previous one will be the main basis for all the future work. In the subsections above the main algorithms were reviewed, dividing them into the different approaches possible to apply in this type of problems. A quick mention of the different types of visualization methods was also done before ending the chapter with a review of the main tools used in the field of this dissertation work.
Chapter 4
Data Analysis and Parsing
To accomplish the thesis goals, presented in the Section1.2, the first step is to gather and analyse
the whole dataset with the objective of producing an appropriate framework for the implementation of frequent pattern mining techniques.
This section has the purpose of describing the source and main features of the dataset as well as detailing the data analysis, parsing and framework definition processes. Lastly, the output of these steps will be used to implement the algorithmic core of the final product and the database to store its result will be presented.
4.1
SmartCompanion
SmartCompanion is a set of applications built for Android smartphones that was designed to meet
elderly people’s needs1. The user’s activity is recorded by the inertial sensor during the use of
the different solutions built in the system, such as the embedded launcher and the medication reminder, or even when the device is not being used, since activity monitoring is always running in the background.
This data is treated by the activity level monitoring and fall risk solutions and produces reports about the user’s physical activity. These applications are already capable of identifying various postures or activities and its related metrics, such as walking, running, sitting, standing and resting time, number of sit-to-stand transitions, walking speed, number of steps, energy expenditure,
dis-tance travelled and number of falls along the day [ASR+14]. The GPS coordinates are also stored
together with all the information previously mentioned.
Data Analysis and Parsing
4.2
Dataset
The test dataset that is going to be used is the result of an experiment that took place in the Netherlands and counted with 70 individuals that used the SmartCompanion mobile application during two weeks. It was also considered the use of data from other studies and from the debug version of the application but several disparities in the number of metrics stored combined with the lack of information about the days tracked led to the disregard of this data.
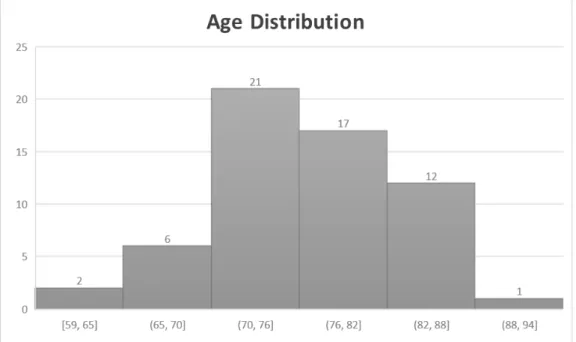
Analysing the study participants more deeply it was possible no notice that some of them did not use the device during the minimum 14 days of experience so they were discarded. The dataset was then composed by 59 users, where only 4 had more than the 14 days minimum usage time, up to 19 days. 55% of the subjects were females so the sample was almost evenly distributed gender wise. The youngest individual was 59 years old and the oldest had 89 years of age, being the sample’s mean value of 76 years. This and more information about the participants age can be
seen in the histogram in Figure4.1.
Figure 4.1: Histogram with the age variable distribution
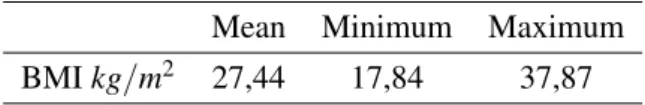
Other information was also pre-collected, specially if related with the user’s health. The height and weight of each user was used to calculate the body mass index(BMI) because it is a very
important analysis factor since it is related to the risk of developing chronic diseases [FPG+04].
The analysis of this variable led to an alarming conclusion that 64.4% of the participants were outside the ideal range of BMI, between 22 and 27, and among them more than 70% were above
Data Analysis and Parsing
Table 4.1: Statistics of the BMI variable
Mean Minimum Maximum
BMI kg/m2 27,44 17,84 37,87
Table 4.2: Percentage of users in each BMI category
BMI <22 22 <= BMI <= 27 BMI >27
Users % 16.9 35.6 47.5
Adding to these informations it was possible to gather other interesting facts like: half the participants had walking aid, 85% had impaired vision and 39% fell at least once in the past year, a value higher than expected as the typical incidence of falls in people older than 65 years old is
30% [MSS+16].
4.2.1 Retrieval
As mentioned before, the experiment was carried out abroad and the database was also located in the Netherlands without direct access from Portugal. To work around this difficulty a virtual machine with CouchDB installed was deployed and the whole database was copied with a script
written in Ruby2. After this, it was possible to create an SSH tunnel from the virtual machine and
get an hard copy of the database files written in JSON format.
4.2.2 Analysis
During the experiment period a copious amount of files were created for each user by the activity monitoring app, fall risk monitoring app and all the other solutions embedded in the SmartCom-panion’s system. All the files and information provided by them were construed and the documen-tation of the database was analysed in order to choose the most important records from the wide range of gathered data. Files about battery alerts, calls made and others were discarded due to not being related with the user’s daily physical activity.
The main records chosen will be explained in detail in the following subsections.
4.2.2.1 Personal Information
Each user has an object in the database that stores all his personal information. This information is a result of the user’s inputs in the SmartCompanion application which contains a personal infor-mation interface. Some of the data is mandatory and not all the inforinfor-mation is relevant. The main
items are displayed in the file template, portrayed in Listing4.1.
Data Analysis and Parsing
1 id: " SeniorSetting_Personal_Information_user_A ",
2 doc : {
3 Medications : "4",
4 type : " SeniorSetting ",
5 Allergies : " Grass Allergy ",
6 timestamp : 1454657611849 , 7 Weight : 86.2 , 8 RecentFalls : 3, 9 Birthdate : { 10 " Year ": 1948 , 11 " Month ": 10, 12 " Day ": 7 13 },
14 Blood Type : "AB -",
15 Medical Conditions : " Hypertension ",
16 Height : 170.4 ,
17 Name : " John Doe ",
18 Email : " jDoe@mail . com ",
19 subtype : " Personal Information ",
20 Gender : {
21 Male : false ,
22 Female : true
23 }
24 }
Listing 4.1: Template of the personal information file stored in the database
As the user’s personal information has a static property, it was not used as input in the posterior FP mining tasks but they were crucial to complete the final tool.
4.2.2.2 Activity Monitoring
The SmartCompanion’s activity monitoring solution stores records for various time frames: hourly, daily, weekly and monthly. Due to the duration of the experiment only the hourly and daily files were considered but the inclusion of longer time frames analysis can be done with little effort in the final solution.
Daily and hourly databases have the same structure, being the only distinctive factor the hour attribute present in the second one. Activity metrics like cycling were discarded because they had
no values associated. All the relevant information is displayed in Listing 4.2, a template of an
activity monitoring file.
1 id: " Daily_Record_user_A_1454626800000 ",
2 doc : {
3 user_database : " user_A ",
4 type : " MoverRecord ",
Data Analysis and Parsing 6 Month : 1, 7 timestamp : 1454713200626 , 8 Year : 2016 , 9 MoverADLStats : { 10 tilting : { 11 time : 10880000 , 12 energy : 690.24945000000002437 13 }, 14 sitting : {...} , 15 laying : {...} , 16 standing : {...} , 17 lookingAtPhone : {...} , 18 notUsingPhone : {...} , 19 walking : { 20 distanceTraveled : 831.80299999999999727 , 21 steps : 1373 , 22 time : 890000 , 23 energy : 59.49266399999999777 24 }, 25 running : {...} , 26 totalRealEnergy : 2854.3702659606933594 27 } 28 }
Listing 4.2: Template of the daily activity monitoring file stored in the database
The time measure is in milliseconds and the distance is in meters. When it comes to energy all the values are in kilocalories. It is important to notice that the daily records were a sum of all the hourly records but for a matter of efficiency it was better to analyse each daily file instead of doing the calculations.
4.2.2.3 Fall Risk Monitoring
Being closely related with several physical activity metrics, like the number of steps per day and the energy spent throughout the day, the Fraunhofer’s solution to monitor the fall risk of the sys-tem’s user was meant to analyse because it contains useful information.
The fall risk score presented by the SmartCompanion application is a value ranged between 0 and 10 that portraits the probability of that user falling in his daily life. All the metrics that take part in the calculation of this value are stored in daily records and, to each one of them, an individual value and the risk score connected to that same value are listed. This can be seen in
Listing4.3.
1 {
2 id: " FallRiskRecord_user_A_1454626800000 ",
3 doc : {
Data Analysis and Parsing 5 Year : 2016 , 6 FallRiskReport : { 7 AverageMotionSpeed : { 8 Value : 3.3645960999999999785 , 9 Risk : 0.90269089999999996277 10 }, 11 FES : {...} , 12 StrideTimeVariability : {...} , 13 Age : {...} , 14 BMI : {...} , 15 Gender : {...} , 16 NumberOfDrugs : {...} , 17 HealthConditions : {...} , 18 NumRecentFalls : {...} , 19 Energy : {...} , 20 WalkingTime : {...} , 21 NumberOfSteps : {...} , 22 RestingTime : {...} , 23 NumberOfToSit : {...} , 24 NumberOfToStand : {...} , 25 RiskScore : 3.162592599999999976 26 }, 27 user_database : " user_A ", 28 type : " FallRiskRecord ", 29 Day : 5, 30 Month : 1 31 } 32 33 }
Listing 4.3: Template of the fall risk monitoring file stored in the database
The metrics NumberOfDrugs, Gender, HealthConditions and NumRecentFalls presented in
the JSON file at4.3are static and for that reason were not considered in the upcoming FP mining
procedures.
4.2.3 Data Framework
After setting priorities in terms of metrics to analyse, as demonstrated in the previous section, it was developed a phased process to transform the original files into a data structure capable of serving as an input to the algorithms to be tested and implemented. In order to do so, several tasks were carried out and will be scrutinized in the following subsections.
4.2.3.1 Continuous to Interval Data
A continuous variable is a variable that has an infinite amount of possible values. The big majority of metrics stored in the various records were continuous and for that reason the task of parsing the
![Figure 2.1: Algorithmic process for activity recognition from sensory data [MSEI07]](https://thumb-eu.123doks.com/thumbv2/123dok_br/15575798.1048556/27.892.203.725.154.396/figure-algorithmic-process-activity-recognition-sensory-data-msei.webp)
![Figure 2.2: Graph representing activity pattern sequence using HMM and CRF[AR13]](https://thumb-eu.123doks.com/thumbv2/123dok_br/15575798.1048556/28.892.160.700.147.490/figure-graph-representing-activity-pattern-sequence-using-hmm.webp)
![Figure 2.3: Tree representation of routine patterns [AEA + 08]](https://thumb-eu.123doks.com/thumbv2/123dok_br/15575798.1048556/29.892.269.666.163.360/figure-tree-representation-routine-patterns-aea.webp)