Efficiency in Stock Markets with DEA: Evidence
from PSI20
Nuno Ferreira#1, Adriano Mendonça Souza*2
# Department of Quantitative Methods, IBS-ISCTE Business School, ISCTE
Avenida das Forças Armadas, Lisboa, Portugal 1
* Department of Statistics, Federal University of Santa Maria
Roraima Avenue, 100, Santa Maria, RS state, Brazil 2
Abstract - After the US subprime crisis, the first signs of
a sovereign debt crisis spread among European financial players. The regulation of the markets by European Commission and European Central Bank created limitation to obtained great amount of liquidity in commercial banking sector. In this context, the successful survival of some European banks became in a dangerous situation. The present study try to explore the crisis occurred in one of the largest private Portuguese banks through the analysis of the efficiency levels of twenty largest enterprises of the PSI20 since 1993. The input variables chosen were market value and return in a Data Envelopment Analysis model. Consistent with earlier studies, the results show substantial revenue inefficiencies among the Portuguese enterprises.
Keywords ‐ Stock Markets Indices; Interest Rates; Banking sector; EU Sovereign Debt Crisis; Efficiency.
1. Introduction
Financial researchers had dedicated a large effort to discover the factors that explain differences in the enterprises financial performance during several years. Around the world stock markets have fallen, large financial institutions have collapsed or been bought out, and governments in even the wealthiest nations have had to come up with rescue packages to bail out their financial systems. In this context, all agents focus their attention on productivity and efficiency gains since both are central to the growth of firms in any industry. For this matter, inefficiency can be due to structural problems or market imperfections or even other factors, resulting in firms producing below their maximum attainable output.
Efforts to measure how efficiently a firm (a Decision Maker Unit, known as DMU in literature) produces outputs with its inputs have led to the development of a number of efficiency concepts, including scale efficiency, scope efficiency,
economic efficiency, and technical efficiency. Whereas technical efficiency requires only input and output data, economic efficiency also requires price data. The simplest way to differentiate productive and technical efficiency is to think of productive efficiency in terms of cost minimization by adjusting the mix of inputs, whereas technical efficiency is output maximization from a given mix of inputs.
In literature, a large number of papers is based on an essentially nonparametric, programming approach to analysis of observed outcomes. In fact, the Data Envelopment Analysis (DEA) is by far the most used methodology to measure efficiency. Traditional DEA models compare the relative efficiency of each DMU (for instances: individual firms or, individual industries in the sector). Leontief-type input-output models characterize the different sectors dependence, each sector comprising several industries. In this context, it seems natural to explore the DEA efficiency models in so different economy sectors such as agriculture, manufacturing, transportation, and trade. Despite DEA efficiency models mostly emphasize technical efficiency (TE), and allocative efficiency (AE) concepts, alternative approaches are also covered with this methodology.
The purpose of DEA is to construct an envelopment production frontier. This frontier maps out the greatest output (least input) for a given level of input (output) based on observed outputs and inputs of the DMUs. In this context, all observed points lie on or below this frontier. Thus, the production frontier or the “best practices frontier” is constructed with the DMUs that lie on it (highest efficiency). The efficiencies of the remaining DMUs that lie below it measured by the distance relative to this frontier.
PSI20 (acronym of Portuguese Stock Index) is the main index of Euronext Lisbon. Eligible companies ____________________________________________________________________________________
International Journal of Latest Trends in Finance & Economic Sciences
IJLTFES, E‐ISSN: 2047‐0916
are required to fulfill the velocity threshold and minimum free float (corresponding to the value of €100 million). The base value of the PSI-20 date back to December 31, 1992 and was 3000 points.
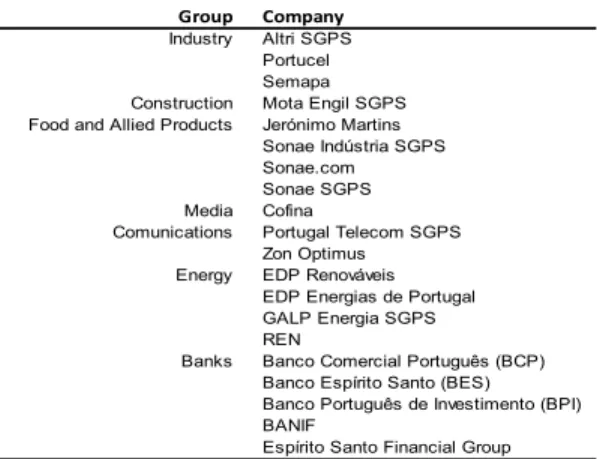
The Portuguese stock index includes 7 categories of companies, namely: Banks, Industry, Media, Energy, Food & Allied Products, Construction and Communications (5, 3, 1, 4, 4, 1 and 2 companies, respectively) [see Table 1].
Table 1. List of the studied Companies from PSI20 Index
Group Company
Industry Altri SGPS Portucel Semapa Construction Mota Engil SGPS Food and Allied Products Jerónimo Martins
Sonae Indústria SGPS Sonae.com Sonae SGPS Media Cofina
Comunications Portugal Telecom SGPS Zon Optimus Energy EDP Renováveis
EDP Energias de Portugal GALP Energia SGPS REN
Banks Banco Comercial Português (BCP) Banco Espírito Santo (BES) Banco Português de Investimento (BPI) BANIF
Espírito Santo Financial Group
Among the literature focused on the Portuguese stock market, we selected the following papers as relevant research on the topic under study. Nascimento (2007) analyzed the Portuguese market during 1997–2007. In this study the author concluded that 42% of the 26 selected stocks, which had a random walk in prices, held a significant part of the (weak) efficiency where the market players did not enjoy supernormal profits. Nevertheless, the author hinted at the possibility of the lack of efficiency due to the existence of information asymmetries, since 58% of the remaining assets of the sample allowed supernormal profits to be possible. Duque and Madeira (2004) presented empirical evidence on the existence of abnormal returns of asset prices in the Portuguese Stock Index (PSI) for the period 1996– 2001. The authors evidenced that the Portuguese stock market has a weak efficiency.
If we extend to international stock markets the proliferation of papers increase substantially. In this context, a large number of papers highlight the DEA importance. The acceptance of this methodology in financial markets is reaching more popularity in recent years. By using DEA to generate a “financial efficiency frontier”, each enterprise achieves an overall financial efficiency score comparable to that of its peer enterprises. One great advantage of DEA
was based on the evidence that DEA gives analysts an opportunity. This opportunity relies in the facility of calculating an overall efficiency score based on financial data, to examine different aspects of financial conditions and financial performance simultaneously rather than sequentially. In this context, Chen (2008) by using the size effect through DEA tried to model for stock selection to form portfolios and compare them against the benchmark market portfolio. Lopes et al. (2008) applying the same DEA model to the Brazilian stock market. But the focus of the analysis relied on into risk measures like variance and beta as inputs and quarterly returns as the output. Singh et al. (2009), used DEA to form efficient portfolio in their comparative analysis. Wang et al. (2010) formulated a model of stock classification to facilitate investors making investment decisions related to equity stock selection by two dimensions. These were performance shift and stock price evaluation (Malmquist productivity index based on DEA and Range adjusted Measure (DEA-RAM)). More recently Lim and Zhu (2014) proposed a way of using DEA cross-efficiency evaluation in portfolio selection. They presented an application to Korean stock market.
In the present study the revenue efficiency levels of twenty largest enterprises of the PSI20 since 1993 are analysed in order to better understand how efficiency or the lack of it, contribute to the crisis occurred in one of the largest private Portuguese banks (Banco Espírito Santo).
2. Methodology of DEA
The panel data defined to undertake the analysis considered the individual company’s return as the output variable and the market return and the market value as inputs. The DEA output-oriented approach to estimate the revenue efficiency (RE) of each stock return follows (Färe et al. (1985) :
∑ | , 1, … , , 1, … , 1 0, 1, … , 0, 1, … ,
This model considers n DMUs, defined by j (j=1,…,n), which use the inputs xij (x1j,…,xmj), to obtain the outputs yrj (y1j,…,ysj). In the formulation (1), prj0 is the value of output r for the DMU j0 under assessment. yr0 is a variable that, at optimal solution, gives the output r to be produced by DMU j0 to maximize revenue, subject to the technological restrictions imposed by the existing production possibility. The RE of each DMU j0 is given by as the ratio of current revenue observed at DMU j0 to the maximum revenue estimated by the optimal solution to model (2):
∑
∑ ∗ 2
The DEA model (1) and the revenue efficiency model (2), were estimated using the DEAP software (Coelli, 1996).
3. Results
The Tables 2 to 4 present the DEA scores by economical sector, year and enterprises. The results achieved with DEA consider the more efficient, the sectors of Media, Communications and Energy.
Table 2. DEA revenue efficiency scores by economical
sectors (between 1993 and 2013)
Group Mean Efficiency
Industry 0.81 Construction 0.69 Food and Allied Products 0.76 Media 0.82 Comunications 0.86 Energy 0.84
Banks 0.79
The results are along with the common sense since this sector usually has the greatest impact in an established crisis period. It would be expected that the Industry would be also more penalized, nonetheless this sector’s enterprises represented in PSI20 has an important percentage of the business directed to the export sector. This would be an important key to avoid a stronger impact. Media, Communications and Energy, are also affected by the crisis due the economic contraction of the business cycle. The analysis by year does not bring any
additional enlighten to the discussion, as the lowest score corresponds to the first year of the index establishment.
Table 3. DEA revenue efficiency scores by year Year Mean Efficiency 1993 0.24 1994 0.86 1995 0.81 1996 0.79 1997 0.89 1998 0.93 1999 0.89 2000 0.89 2001 0.83 2002 0.81 2003 0.81 2004 0.84 2005 0.87 2006 0.90 2007 0.92 2008 0.88 2009 0.85 2010 0.86 2011 0.84 2012 0.82 2013 0.76 Mean 0.82
Nonetheless, from Table 3, three important periods of economic tension are well identified. The Asian financial crisis in 1996-97; the Iraq and Afghanistan invasion in 2001; the Subprime crisis in the US housing sector and the Troika in 2011. Since the intervention of Troika, the PSI20 has fallen.
This slowdown can be explained by other additional factors: i) slowdown of economies the European Union (EU) and the United States of America (USA), due to deleveraging of economy and the sovereign debt crisis Euro zone; ii) lower rates of growth in emerging economies, affected by the reduction in consumption the most advanced economies and policies of rising interest rates to contain inflation, iii) events extraordinary, as the tsunami in Japan (who led the country into recession in 2011) and the instability in the Middle East (with an impact on the price of commodities), but whose effects are should blurring in 2012. Notwithstanding, the year 2013 was the most difficult for the euro area since the financial crisis 2008.
Table 4. DEA revenue efficiency scores by enterprises
Group Company Technical Efficiency As benchmark (%)
Industry Altri SGPS 0.91 1%
Portucel 0.79 0%
Semapa 0.74 0%
Construction Mota Engil SGPS 0.69 0%
Food and Allied Products Jerónimo Martins 0.85 16%
Sonae Indústria SGPS 0.68 0%
Sonae.com 0.72 0%
Sonae SGPS 0.80 0%
Media Cofina 0.82 7%
Comunications Portugal Telecom SGPS 0.89 0%
Zon Optimus 0.83 19%
Energy EDP Renováveis 0.82 9%
EDP Energias de Portugal 0.91 17%
GALP Energia SGPS 0.87 14%
REN 0.77 1%
Banks Banco Comercial Português (BCP) 0.92 7%
Banco Espírito Santo (BES) 0.93 5%
Banco Português de Investimento (BPI) 0.91 5%
BANIF 0.53 0%
Espírito Santo Financial Group 0.67 0%
Table 4 presents the efficiency levels by enterprise and the percentage of times that each one was used as benchmark to the remaining.
The analysis by enterprise denotes that the energy sector and communications, are the more used enterprises as benchmarks. The exception goes to Jeronimo Martins (Food and Allied products) considered as efficient by both methodologies.
Although achieving a good score (0.91) Altri SGPS didn’t was used as benchmark and the Espírito Santo Financial Group already revealed an efficiency’s low score (0.67, the second lowest following Banif (0.53)).
From an individual point of view, the more efficient companies are: Altri SGPS, Jerónimo Martins, Portugal Telecom SGPS, EDP Energias de Portugal, GALP Energia SGPS, Banco Comercial Português, Banco Espírito Santo and Banco Português de Investimento. From those, only Jerónimo Martins, EDP Energias de Portugal and GALP Energia SGPS were used as benchmark more than 10%. The company Zon Optimus also was used as benchmark (19%) although being below 85% of efficiency.
The lower efficient are namely: Mota Engil SGPS, BANIF and Espírito Santo Financial Group. The result of the last one, is quite curious considering the outcome of the BES crisis. Indeed, at the end of 2013, BES was the most penalized with the deterioration of credit quality due to its large concentration on corporate loans segment with a ratio of 11.6%.
4. Concluding Remarks
The results of DEA model formulated in the paper evidenced in terms of the more efficient sectors, the Media, Communications and Energy. The analysis by enterprise confirms this assumption since the best companies and the more used as benchmarks are from these sectors.
The mean technical efficiency of PSI20 market during the period 1993 to 2013 given by the DEA model was 0.82. This implied that 82% of the potential yield was being realized by the companies in the market. This score also indicated that there was a scope to increase the output further by 18% without increasing the levels of inputs.
Finally the evolution through years were stable if we eliminated 1993, the year of PSI20 creation and the years of extreme events in terms of economic and financial crisis and wars.
Our paper results showed comparable technical efficiencies between BES and BANIF. This fact imply that this bank is in the queue to ask for financial assistance. In fact on 21 January of 2013, the European Commission announced that it has temporarily approved, a recapitalization totaling €1.1 billion by Portuguese government to BANIF to meet regulatory capital ratios.
References
[1] Chen, H.-H., (2008). Stock selection using data envelopment analysis. Industrial Management and Data Systems, 108: 1255– 1268.
[2] Duque, J., and Madeira, G. (2004). Effects associated with index composition changes: evidence from the Euronext Lisbon stock exchange. Working paper, ISEG, Technical University of Lisbon.
[3] Fare R, Grosskopf S., Lovell CAK. (1985). The Measurement of Efficiency of Production. Kluwer-Nijhoff Publishing, Boston.
[4] Lim, S., Oh, K.O. and Zhu, J. (2014). Use of DEA cross-efficiency evaluation in portfolio selection: An application to Korean stock market”, European Journal of Operational Research, 236(1): 361-368.
[5] Lopes, A., Lanzer, E., Lima, M. and Newton da Costa, Jr. (2008). DEA investment strategy in the Brazilian stock market. Economics Bulletin, 13(2): 1-10.
[6] Nascimento, V. (2007). Eficiência Informacional do Mercado de Acções: O Caso Português, Master’s Dissertation, Faculty of Economics, University of Porto.
[7] Singh, A.K, Sahu, R., and Bharadwaj, S. (2009). Portfolio Evaluation using OWA-Heuristic Algorithm and Data Envelopment Analysis”, Journal of Risk Finance, 11(1): 75-88.
[8] Wang, M. and Chin, K.-S. (2010). Some alternative DEA models for two-stage process, Expert Systems with Applications, 37: 8799-8808.