CULTURAL EFFECTS ON REAL ESTATE MARKET:
AN EXPLANATION OF URBANIZATION
Ling Wang
Project submitted as partial requirement for the conferral of the degree of Master in Business Administration
Supervisor:
Prof. Rui Alpalhão, ISCTE Business School, Departamento de Finanças
Cultural effects on real estate market: an explanation of urbanization
Resumo
Este estudo investiga a Teoria do homem no comportamento do consumidor e as dimensões culturais de Hofstede, proporcionando uma compreensão mais profunda das atitudes dos consumidores relativamente ao investimento no mercado imobiliário para explicar a urbanização atual em diferentes países. Depois da quebra do mercado imobiliário e do processo de investimento imobiliário, os indicadores são seleccionados a partir de Atividades Económicas, Mercado Imobiliário, Risco e Limitação e dos Factores Culturais para explicar o fenómeno da urbanização para alcançar o objetivo deste trabalho. Após a realização do Stepwise, o resultado mostra que há ligação entre eles. Juntamente com o desempenho imobiliário, representado pelo Índice de Rendas e Índice de direito de propriedade, o índice cultural, representado pelo Índice de Incerteza e Prevenção e pelo Índice da Indulgência, bem como outros dois factores da Teoria do Comportamento do Consumidor – a Teoria do Homem é estatisticamente significativa para a urbanização.
Palavras-chave: Investimento imobiliário · Diferenças culturais · Urbanização. JEL Sistema de Classificação: R29, R30, Z10.
Abstract
This study investigates the Theory of Man in Consumer Behavior and Hofstede Cultural dimensions by providing deeper understanding of consumers‟ attitudes towards investment in real estate market to explain nowadays´ urbanization in different countries. After breaking down the Real estate market and RE investment process, the predictors are selected from Economic Activities, Real Estate Market, Risk and Limitation and Cultural Factors to explain the Urbanization phenomenon to reach the purpose of this paper. The result after conducting the Stepwise Regression shows there is connection among them. Together with „Real Estate Performance‟, represented by Rent Index and Property Right Index, „Cultural Index‟, represented by Uncertainty Avoidance Index and Indulgence Index, as well as other two factors from Consumer Behavior Theory- the Theory of Man are statistically significant for Urbanization.
Keywords: Real estate Investment · Cultural Differences · Urbanization. JEL ClassificationSystem: R29, R30, Z10.
Cultural effects on real estate market: an explanation of urbanization
Acknowledgement
In the whole process of accomplishing this project, I would sincerely express my gratitude to Professor Rui Alpalhão. His support is vital for the completing of this project. The patience he has paid, the professional guidance he has given and the encouragements from him are the moral support leads me in the road. I admire his wisdom and the wideness of his knowledge and his efforts in tutoring me in this project which helps me not only in completing the program, but also in showing me the way to get self-achievement. He kindly gives suggestions with respecting of my own opinions; without him I wouldn‟t reach so far.
Apart from that, I would also like to thank ISCTE, the International Master Program which gives me a chance to see the ability of myself and boards my vision into an international level. Fulfilling this project is more an opportunity than a task which I find is challenging and memorable.
Table of Contents
Resumo ... I Abstract ... II Acknowledgement ... III Table of Contents ... IV List of Figures and Tables ... V Introduction ...VI
1. Real Estate Market and Urbanization ... 1
1.1 Real Estate Market Segmentation ... 1
1.2 Residential Market ... 5
1.3 Commercial Market... 7
2. Real Estate Investment ... 11
2.1 The Equilibrium of Real Estate Use ... 15
2.2 Supply and Demand ... 18
2.3 Bubbles, Inflation and Saving ... 25
3. Cultural Differences ... 34
3.1Consumer Behavior ... 34
3.2 Decision Making ... 40
3.3Hofstede Theories ... 45
3.4Cultural Influences on RE Market ... 49
4. Methodology ... 52 4.1Research Overview ... 52 4.2Dummy Variables ... 53 5. Empirical Study ... 54 5.1Data Selection ... 54 5.2 Description of Variables ... 56
5.3 The Application of Dummy Variables ... 60
5.4 Multiple Regression Model ... 64
5.5 Output of Stepwise Regression ... 66
6.Conclusion ... 70
Cultural effects on real estate market: an explanation of urbanization
List of Figures
Figure 1: Three Major Participants in Real Estate Market ... 1
Figure2: The Components and Interactions of RE Market ... 2
Figure 3: The Areas of the RE Market……….4
Figure 4: Invested Property Ranking in 2014...…....5
Figure 5: Confidence Heat Map by Country………12
Figure 6: FDW Model………..17
Figure 7: Fundamental Law of Demand………..18
Figure 8: Housing Market Operation Mechanism………19
Figure 9: The Supply/Demand Analysis in RE Market………..….20
Figure 10: Changing in Demand………..21
Figure 11: Market Quadrants Cycles………...22
Figure 12: Theoretical Framework for Explaining Bubbles………26
Figure 13: Survey Responses on Housing as an Investment 1988 and 2003………...30
Figure 14: Low vs. High Involvement Decisions………34
Figure 15: Hierarchy of Needs between Different Cultural Groups………37
Figure 16: Demand for Specific Housing Characteristics at Various Levels of Human Motivation………....38
Figure 17: Consumer Decision Model……….40
Figure 18: Derived Internal Relation………...51
List of Tables
Table 1: The Three Stages of RE Market ... 3Table 2: Four Forces in Identifying Neighborhood……….7
Table 3: Investment Actually Completed by Enterprises for RE Development by Use in China...8
Table 4: Investment Style Definition………...13
Table 6: Characteristic of Efficient/Inefficient Market………19
Table 7: Global Growth Distribution of the Overseas Chinese Population since 1980 (million)...24
Table 8: Housing Price Index in China 2007………...………30
Table 9: Housing Supply Index in China 2007………...……….30
Table 10: Demand for Specific Housing Characteristics at Various Levels of Asian……….39
Table 11: Key Differences for Hofstede´s Culture Index in Consumption Behaviors and Decision- making Behavior………...47
Table 12: Consumer Style, Five Forces of Personalities and the Theory of Man………...49
Table 13: Determinants in Relation of Real Estate and Socio Economic………52
Table 14: Descriptive Statistics of Urban Population by Countries 2015………55
Table 15: Summary of Raw Data and Resources……….55
Table 16: Hofstede Six Dimension Scores by Countries……….59
Table 17: Summary of the Theory of Man………...61
Table 18: Dummy Variables for the Theory of Man………...………61
Table 19: Descriptive Statistics for all Variables...………..65
Table 20: MLR ANOVA Results...………..66
Table 21: MLR Model Summary……….67
Cultural effects on real estate market: an explanation of urbanization
Introduction
A crowd of empirical studies have investigated the determinants of real estate investment decisions, which bring attention to centralized investor behavior. Like any other investment, investment in real estate considers the investment return of its own. In general, the influences to this decision are strongly connected with the economic elements.
Many scholars have studied the relationship between consumer behavior or decision making and cultural influences. Within real estate market, several researches can be found, Simionescu, for example, has studied socio-economic and cultural aspects to the urbanization process in Romania (Simionescu, 1984); Halpern, 1966, presented peasant culture in explaining urbanization. There is rare research in providing sight view from a global prospective. Therefore, the main problem or flaw is the inability to accurately capture a cultural explanation from an international level.
Inspired by the Hofstede Theory and the Cultural Dimension Index in an international level, this paper intends to raise a concern from household of different countries as a proof for the rapid growing of city urbanization. Up to now, the Hofstede studies have provided the basis for the belief that cultural factors influence the organizational behavior. However, other scholars have applied his theory in other areas as an explanatory tool for behavioral study.
The literature review later on provides the basis for understanding and analyzing the market, as well as provides background for variable selection. In detail, macroeconomic variables connect to urbanization would be used in conducting the model; however, the paper sheds more light on cultural perspective. Real estate market, RE investment and consumer behavior was studied and variables were selected for certain reasons. The Theory of Man was introduced for an explanation of consumer behavior as a whole. Not surprisingly, the result brings indicators from these dimensions as expected, both macroeconomic and cultural.
The remainder of this thesis is as follows: Section 2 consists in a detailed Literature Review. Section 3 presents the Methodology applied to the variables in study. Section 4 deals with the data (i.e. selection of the macroeconomic variables, sources and expected outcome) and Empirical Results. Section 5 contains a Summary of the thesis and concluding remarks.
1. Real Estate Market and Urbanization
1.1 Real Estate Market Segmentation
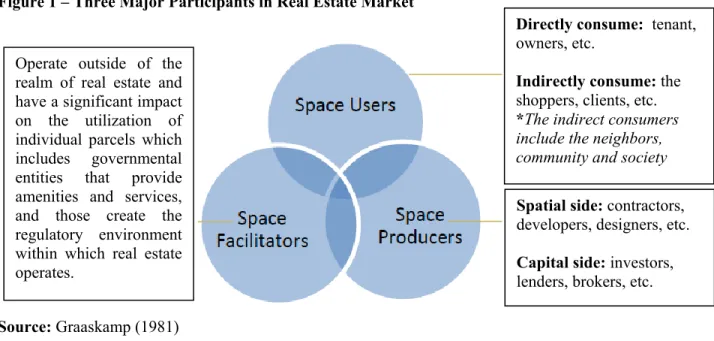
Identifying segments of the real estate market is essential for investors. DeLisle (2010) is relevant to explaining the composition of the real estate market which is important for better understanding of the market as a whole. He summarized the `three major participants´ in the real estate process and renamed them from Graaskamp´s (1981) research: space producers, space users, and space facilitators or infrastructure providers. As shown below, the overlap clearly displays the roles of these groups that create the real estate market.
Figure 1 – Three Major Participants in Real Estate Market
Source: Graaskamp (1981)
These three groups are directly and indirectly involved inthe market and the connection between them comes from the transaction of transferring ownership or usage for economic return. With some noteworthy exceptions (excess capital flow in 1980; flooded easy cheap credit in 2000, etc.), the transitions from one phase to another are fairly smooth with the market adjusting to changes in supply and demand.
In Graaskamp´s original research from 1981, he explains the real estate market´s function and the constant interaction between three groups of people. He classifies each group in detailed slices,
Spatial side: contractors, developers, designers, etc. Capital side: investors, lenders, brokers, etc. Operate outside of the
realm of real estate and have a significant impact on the utilization of individual parcels which includes governmental entities that provide amenities and services, and those create the regulatory environment within which real estate operates.
Directly consume: tenant, owners, etc.
Indirectly consume: the shoppers, clients, etc. *The indirect consumers
include the neighbors, community and society
Cultural effects on real estate market: an explanation of urbanization
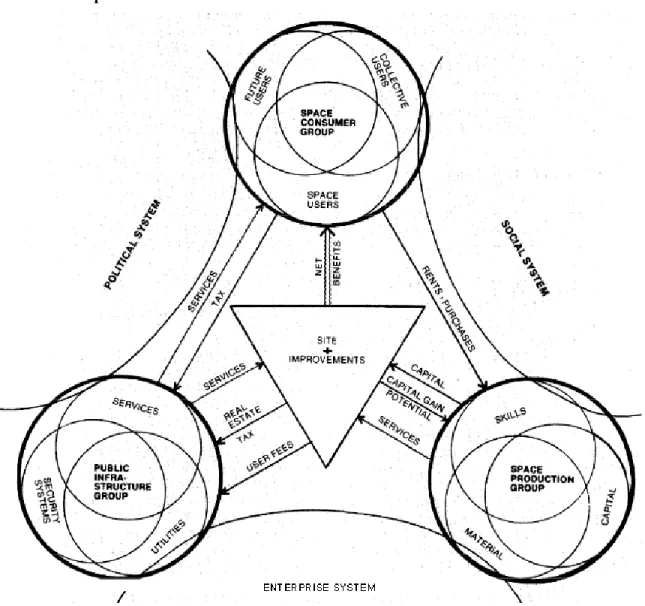
and conducts a functional real estate process as shown below. These relationships involve social, political and enterprise systems. Where the `space consumer group´ contains space users, collective users and future users; the `space production group´ involve skills, materials and capitals; and the `public infrastructure group´ covers services, utilities and security systems. These three sections were considered as the components of the real estate market. The arrows between each group show the principle of running this market and better explain the relationship. In the structure below, the `space consumer group´ pays rents or purchases and receives services; the `public infrastructure group´ supplies services and receives tax and user fees; finally the `space production group´ provides the capital for construction and services to clients but ultimately gains potential capital.
Figure 2 –The components and interactions of RE market
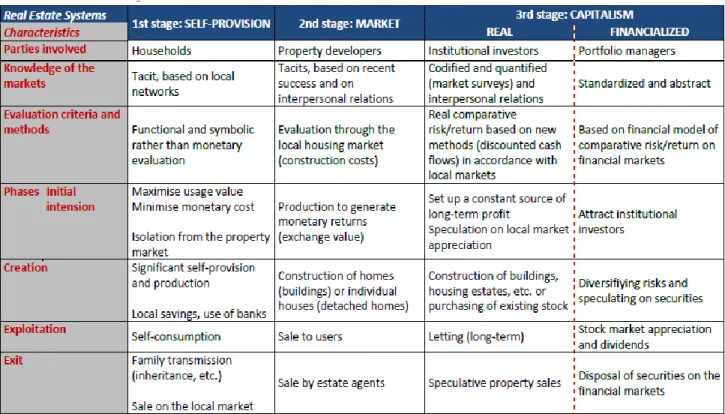
The modern French historian Fernand Braudel, emphasized (Braudel, 1985) the role of large-scale socioeconomic factors in the making and writing of history and identified three “stages” of economic life, which were seen as tools to deconstruct the structure of the real estate market by Theurillat, Rérat and Crevoisier (2004). They summarize and extend Braudel‟s representation of the stages of economic production and clarify the territorial situations in which property is produced, from rural areas to the heart of major cities. Their findings are displayed below:
Table 1 – The three stages of RE market
Source: Theurillat, Rérat and Crevoisier (2004)
As shown in this graph, there are three stages in the real estate system: Self-Provision, Market, and Capitalism. The first stage (Self-Provision) has generally held true. It characterizes situations in which household activities are shaped by needs or aspirations and by the use value of the goods they produce. The second stage (Market) is based on exchange value and is organized at a local level, where the key players are the real estate companies and construction companies which have a tacit understanding of a specific market. The third stage (Capitalism) covers professional investors who invest their capital in real estate with the aim of making a profit. More specifically, in the Financialized stage, the market emphasizes the extent of monetary outlay and
Cultural effects on real estate market: an explanation of urbanization
the size of the projects concerned. Furthermore, these authors show the overlap and hierarchy of the stages in terms of location and demonstrate the link between them:
Figure 3 - The Areas of the RE Market
Source: Theurillat, Rérat and Crevoisier (2004)
On the basis of their ideal real estate system model, the first stage refers mostly to rural areas, the second generally to urban areas and the third to metropolitan areas. In correspondence with the chart of stages before, in the third stage includes two types of Capitalism: the Real estate capitalism and the Financialisation of the city. The graph above shows how these categories increasingly coincide with the level of urban development. The proportion of new builds is theoretically balanced in different percentages. And the standard that categorizes the proportion is the location, from Rural to Major cities.
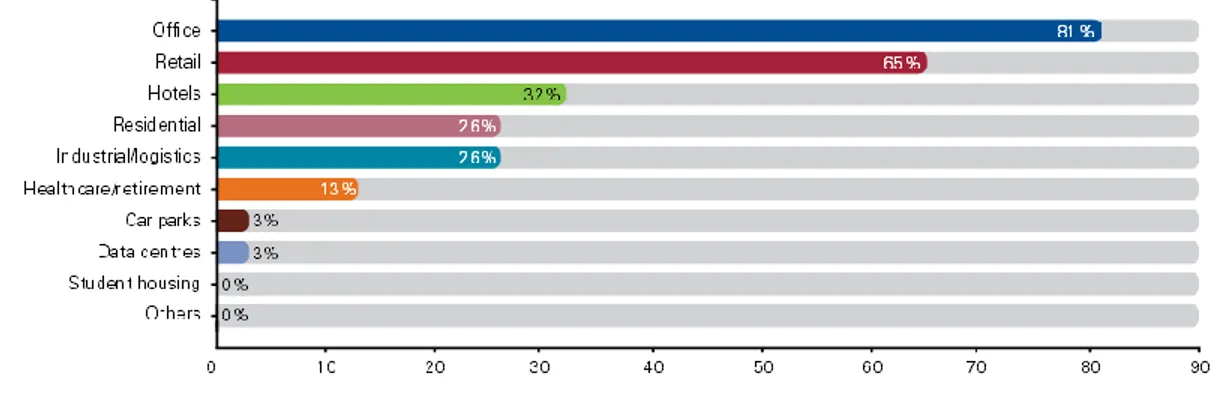
More practically, from the KPMG RE invest survey, the graph below displays the types of property being invested globally and the ranking of each segment in 2014. In general, the real estate market is composed of the residential market where owner-occupied housing is and the commercial market that includes offices, retail, industrial and other rented housing, as well as special real estate that includes untraded and public buildings. The spectrum of investable property has also widened to include car parks and student housing. In this data from 2014, office property turns out to be the most prevalent preference, with 81% respondents desiring it, while 65% showed an interest in retail property.
Figure 4 – Invested Property Ranking in 2014
Source: KPMG RE invest survey
1.2 ResidentialMarket
When defining real estate microeconomics, many economists have used Urban Land and Location, the famous land theory stated by Alonso (1960). The theory notes that a property buyer always considers land and location. Consumers tend to bid for a rent that is cheaper when further from the center. This rate should be just low enough to balance the cost of increased commuting expenses and the aversive effects of a long trip to work.
The term “good location” varies with the changes in the city´s growth. With increasing populations and city developments, most city´s areas have seen a 5 to 12 percent increase in land consumption during the last two decades, which has expanded their borders. This is expected to continue moving city boundaries outward with this rapid growth (Leinberger, 2003). Due to this, the mobility of the population and their location decisions has changed as well.
Without doubt, location has played an important role both for occupation or investment. Some economists, however, have challenged the rule and presented other factors that weigh heavily on this decision making. Except for locational factors, the effect of property-specific factors on real estate in terms of rents include amenities, services, physical attributes and characteristics of renters themselves and their willingness to pay; all of which may influence the value (Sirmans and Benjamin, 1991). Sirmans and Benjamin have examined multifamily housing amenities, and found that services and external factors such as swimming pools, gardens, paid utilities and modern kitchens with well-equipped appliances are consistently important positive determinants of rent. Kahn (2006) analyzed the economics of pollution in urban areas and found out once
Cultural effects on real estate market: an explanation of urbanization
urban areas were associated with dirty air that soiled buildings and damaged the health of city residents; it would influence the image of the neighborhood and in turn decrease investments.
In addition to these two theories, in the current product differentiated market, a house price can vary with the size, quality and character of a unit´s structure, and of course, location. Even though the units have similar features, for example, commuting time, access to work, qualities of the neighborhood and other amenities nearby, the prices for the units vary hugely mainly due to the location. Whereas, even in a highly desirable location, these non-locational factors can determine the house value with surprising results.
Along with the development of economy and society, the way people think must also change. The determinants might alter as they change their mind. I tend to agree that location is important but the other factors are relevant as well. No matter what the purpose for buying real estate is, the core motivation must be people. This is also what the microeconomical approach places emphasis upon. The empirical theory, Renter´s Characteristics and Willingness was devised by Smith, Johnson and Hill (1991). They demonstrate that differences exist in the marginal values placed on features of apartment tenants. These personal profiles include sex, marital status, income and children, etc. In fact, two years earlier, Smith and Kroll (1989) had already indicated that the real estate market needed behavioral consideration that related to renters. Because of this theory, I was inspired to think about different groups of people in the world and to consider more demographical and cultural differences. Different groups of families require different sets of amenities; this affects the price they are willing to pay for a unit, for example, not everyone appreciates having a 24hour guard in building. And because of this, the global market is influenced by personal preferences.
Carr, Lawson and Schultz (2003) summarized that there are four value forces that influence the neighborhood and district. The identification of a district or a neighborhood is usually based on the physical or environmental forces that affect its value; however, it is quite common to have one or more forces to be the most dominant determinant when identifying a district or neighborhood. These forces are listed as below:
Forces Characteristics
Social - Family composition
- Community and neighborhood organizations - Cultural or ethnic groups
Economic - Income levels of residents - Development trends - Employment Physical/Environmental - Topography
- Subsurface (Rock, marsh, etc.)
Governmental - Zoning
- School districts
- Police and fire protection - Land use plan
Source: Carr, Lawson and Schultz (2003)
Besides amenities and other factors, recent research has also shown the effect of property management companies (Benjamin and Lusht, 1992). The authors demonstrated that the bigger the property management company, the higher the rent. Meanwhile, Sirmans and Sirmans (1992) examined the relationship between the quality of property management and the value of apartment rent. The result of their linear model has shown that property management companies earn a higher average monthly rent, on average 4% higher. The term property management includes buying and maintaining rental properties, advertising vacancies and dealing with troublesome tenants, etc. (Trevor, 2008). Within urban areas, neighborhoods vary dramatically. Poverty-stricken, crime-ridden neighborhoods offer a striking contrast to beautiful, expensive neighborhoods with excellent schools and virtually no crime. In this paper, I want to show how personal preferences have grown in importance in regards to real estate investment decision making and the weight of cultural influences.
1.3 Commercial Market
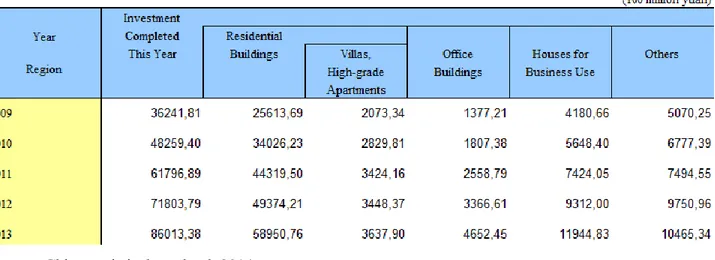
Commercial real estate, which includes office, retail, industrial, apartment and hotel properties, represents a significant proportion of the investment market. This market in general is divided into the industrial market, the office market and the retail market. From the data of the National Bureau of Statistics of China, the table below shows the figures for investment completed in China in real estate development from the years 2009 to 2013. Commercial use in 2009 was 29.3% of the total investment completed, which had increased to 31.4% in 2013, while the ratio of
Cultural effects on real estate market: an explanation of urbanization
investment in real estate to total investment completed in China in 2013 was 25.6%.
Table 3 – Investment actually completed by enterprises for RE development by use in China
Source: China statistical yearbook 2014
From the president and chief executive officer of JLL, Dyer (2015) identifies 30 cities in the world that, together, received half of the total $5 trillion directly invested in commercial real estate over the past decade. Megadeals helped four elite “supercities” retain their places at the top, where they have been for the past few years. Though the proportions of Commercial Investment Holdings are large figure of a country´s wealth, the analysis for real estate investment lags behind that of classic financial asset classes.
The lag is mainly caused by misuse of standard techniques and many concepts tend to be obsolete due to the fact that the studies are out of date and the rapid development of the market (Clayton, J, 1996). The classic Urban Land theory from Alonso (1964) illustrates that bid-rent functions reduce rent when they are further from the city center. Sivitanidou (1995) used data sources from Los Angeles and found that the distance and accessibility to work do have a significant relation to office rental function, however, she also discovered that the standard bid-rent function is incomplete when explaining office bid-rent relationships unless other variables like office amenities, zoning and local institutional control are included in the model.
More recently, Keiler (2013) stated that the measure of price for commercial property should follow a Land-structure split, which is determined by the cost of the land and the cost of the structure. The land structure split equation is listed as follow:
Property value = Land value + Structure value (1)
Keiler (2013) pointed out that in order to understand the determinants of commercial property value, the separation of value is not sufficient and it is very difficult to separate these two components to value a commercial property. He found that it is necessary to reconsider implications from index theory for discriminating sharply between the value, the price, the volume and the quantity of commercial property. The value of a commercial property is determined by the expected value of rent in the future, thus requiring a Discounted Cash Flow Method, which refers to rents and land-specific characteristics.
Özdilek (2011) explained the land value and structure value, focusing on the characteristics of each. A specific land obtains its value from various factors, such as proximity to city center, structure of the surrounding area or its shape and size, etc. However, the structural value is the cost to provide the characteristics of, for example, office and retail space, technical facilities or logistic areas. In summary, the most important considerations for office-use land can be divided into: accessibility, image, face-to-face contact and scales economies (Monetti, 2009), where the Image can attract people to a location which is related to social, cultural or environmental factors. The author didn‟t expand upon how cultural factors are involved in the location decision, which is what I am going to analyze in this paper.
Denise and William (1996) presented the idea that the commercial market is influenced by people, in this case, employment density. Recently, more offices are decentralizing to be closer to the workforce and lowering the cost of rent, moving to where the rent is acceptable for either residents or companies. The similarity is that the commercial market has to follow the pattern of people; if suburbanization is being more popular, the commercial market has to adapt to this trend. The retail market has to follow the mobility of people. Indeed, in a unitary city system, firms and retail units tend to locate together in the city center where it is more convenient for communication with both clients and suppliers. However, firms are heterogeneous and they have different standards for their location decision. The assumption of the agglomerative economies may not, therefore, be strictly binding (Sing; Ooi; Wong; Lum, 2004).
The location decision for retail market tends to be more violate because of the competition within its market. Indicated by Diego Puga and his various equally prolific coauthors, the agglomeration
Cultural effects on real estate market: an explanation of urbanization
of firms follows Krugman„s central issue about competing forces, show how firms begin to move away from this agglomeration, stimulating growth in other countries (Puga; Venables, 1996). Similarly, the cluster of retail shops is a strategy to cater for a public averse to more frequent and tiring shopping trips, thus, one store´s sales gain may occur at the expense of other stores, since one on sale could attract more loads of people to one certain shop. The principle could be applied to the cluster of shopping centers too (DiPasquale and Wheaton, 1996).
Meanwhile a new term `Subcenter´ has attracted attention in the commercial real estate market. It happened not only because of the suburbanization of the residential market, but also occurred naturally due to the growth of the Central Business District (CBD) which was first proposed by E. W. Burgess, an American urban geographer, in 1923 in his famous model of a concentric circle regional structure of a city.The CBD location is a result of the sunk costs and built-in infrastructure, which creates the first-mover disadvantage and accelerates firms‟ inertia to relocate from their CBD premises (Rauch, 1993). Because of its growth, it will reach a critical size that lowers the benefit of agglomeration, leads to traffic congestion, increases the office density and finally remove the difficulty of relocation. Plus the existence of new development around the fringe areas of the city, where the rent is lower and infrastructure is new, these all stimulate firms to relocate away from the center, named the Subcenter (DiPasquale and Wheaton, 1996). Along with the development of internet and transportation, the old barriers for face-to-face communication don‟t influence the decision that much as they used to, which accelerates the decentralization process rapidly and reasonably (Ball, Lizieri and MacGregor, 1998). Bollinger, Ihlanfeldt and Bowes (1998) also showed that a centrally located market is an important office location determinant only for the market-oriented firms, which find access to clients to be very important.
Leishman and Watkins (2004) used the behavioral approach and studied 119 office occupiers in the Edinburgh office market. They showed that the choice of the office type by the firms is dependent on the characteristics of the firms, such as their size, type of business and their market coverage- either locally, regionally or nationally. As with the personal preferences in the residential market, companies differed in terms of their characteristics and cooperative culture, and these might influence the decision making of firm or retail unit locations. Urban economists have pointed out that the spatial equilibrium in commercial markets and residential markets are quite similar. In general, land prices are the entrance fee for companies to enter the productivity
and the amenities of a labor area (Rosen and Roback, 2006). While these two sectors are closely connected, important differences exist (Gyourko, 2009). Other factors may lead to different results within these two markets.
2. Real estate investment
“Only when the tide goes out do you discover who's been swimming naked.
”
--Warren Buffett Real estate investment attracts and repels people, however, in general, it is still the trend of investment to gain return with relatively low risk. The most persuasive reasons for real estate investment are Inflation and Depreciation. Thanks to inflation, investors in the real estate industry are taking advantage of it because of the appreciation of products, in this case, rent. Historically, many economic experts doubted the market value of properties and claimed house prices had reached their peak and ultimately would decline.
The prices of houses seem to have reached a plateau, and there is reasonable expectancy that prices will decline. (Time, December 1, 1947)
The goal of owning a home seems to be getting beyond the reach of more and more Americans. The typical new house today costs about $28,000. (Business Week, September 4, 1969)
The era of easy profits in real estate may be drawing to a close. (Money, January 1981) A home is where the bad investment is. (San Francisco Examiner, November 17, 1996) The trends that have produced the housing boom . . . have nearly run their course. This
virtually guarantees . . . plummeting home prices and mass foreclosures. . . . (John Rubino, How to Profit from the Coming Real Estate Bust, Rodale, 2003)
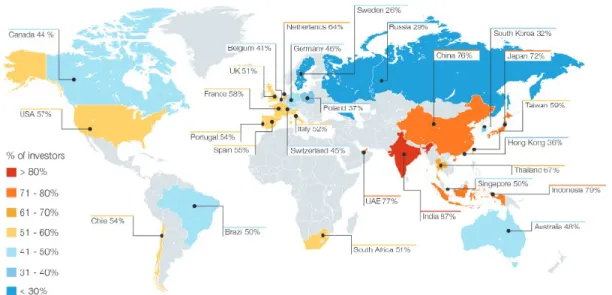
However, house prices won‟t drop as long as inflation exists. Eldred (2008) goes as far as stating that the price of housing will go up, no matter how high it is today. Worldwide, from the latest Schroder‟s Global Investment Trends Survey 2015 of Increasing Confidence, over half (54%) of retail investors globally feel more confident about investment opportunities in the next 12 months
Cultural effects on real estate market: an explanation of urbanization
than they were a year ago, especially for investors from Asia.
Figure 5 – Confidence Heat Map by Country
Source: Schroder‟s‟ Global Investment Trends Survey 2015
Real estate investment decisions must be based on an understanding of the economic environment of each parcel of property. As a discipline, economics is divided into two fields with similar distinctions, which are microeconomics and macroeconomics. In the real estate market, the micro forces that should be considered are those location-specific factors that influence the value of use of one particular site. On the other hand, macro forces refer to economic factors that affect market timing and influence the profit or use of all properties (DiPasquale and Wheaton, 1996). These variables are well-known: market prices, rents, vacancy, interest rates, inflation rates, etc.
Many investors now ensure they have three or four real estate investment styles within their overall real estate allocations, seeking a new and enhanced way to set investment strategy. The definitions for investment styles are:
a. Core - low risk/low return
b. Core plus/ Value-Added - moderate risk/higher returns c. Opportunistic - high risk/high return.
Baczewski, Hands and Lathem (2003) pointed out that the real estate market is far from unanimous, and the definitions may vary, and may not always produce the same results, because investors sometimes have particular needs, preferences and perceptions that drive the definitions above. They illustrate the key attributes for each style and define the investment styles further in detail:
Table 4–Investment Style Definition
Asset Level
Core Definition Value Added Definition Opportunistic Definition
Assets that achieve relatively high percentage of return from income and that are expected to exhibit low volatility.
Assets that exhibit one of more of the following attributes – achieve a significant portion of return from appreciation, exhibit moderate volatility and/or are not currently considered core property types. However, if the overall risk level is excessive, the asset should be classified as Opportunistic.
An asset that is expected to derive most of the return from
appreciation or which may exhibit significant volatility in returns. This may be due to a variety of
characteristics such as exposure to development, significant leasing risk, or high leverage, but may also result from a combination of moderate risk factors that in total create a more volatile return profile.
Core Attributes Value Added Attributes Opportunistic Attributes
Major property types only – office, industrial, retail (neighborhood/ community centers, regional/super regional malls), multifamily
Major property types, plus other retail, hospitality, senior living, storage
Non-traditional property types, including speculative development for sale or rent and land
Lifecycle: Operating Lifecycle: Operating, Leasing Development and redevelopment lifecycles
High occupancy Moderate to well leased,
substantially pre-leased development
Low economic occupancy
Low rollover concentration Moderate rollover concentration High rollover concentration Low total near term rollover Moderate total near term rollover High total near term rollover
Low leverage Moderate leverage High leverage
Institutional market/location Institutional or emerging markets Secondary and Tertiary markets and International Real Estate
Investment structures with
significant control Investment structures with significant or moderate control, but security or preferred position
Investment Structures with minimal control, unsecured positions
Portfolio Level Core Portfolio Definition Value-Added Portfolio
Definition
Opportunistic Portfolio Definition
Cultural effects on real estate market: an explanation of urbanization
A Portfolio that includes a
preponderance of core attributes. As a whole, the portfolio will have low lease exposure and low leverage. A low percentage of non-core assets is acceptable. As a result, such portfolios should achieve relatively high income returns and exhibit relatively low volatility.
A Portfolio that generally includes a mix of core investments and others that will have less reliable income streams. The portfolio as a whole is likely to have moderate lease exposure and moderate leverage. As a result, such portfolios should achieve a significant portion of the return from appreciation and are expected to exhibit moderate volatility.
A Portfolio of preponderantly non-core investments that is expected to derive most of its return from appreciation and/or which may exhibit significant volatility in returns. This may be due to a variety of characteristics such as exposure to development, significant leasing risk, high leverage, or a combination of moderate risk factors.
Source: Baczewski, Hands and Lathem (2003)
Besides investment style, an effective analysis of a real estate investment must consider many critical characteristics and the task of analyzing a real estate investment may be divided into three components: Cash flow, Tax effect and Future benefits (Poorvu, 2003). Recently, though the economy has been recovering, investors venture into real estate investments always with greater demands to accommodate their particular needs so as to maximize their potential return while minimizing their risk. The effect of tax turns to be more important since tax regulations can negatively impact an investor‟s return, as well as the volatility of returns in today‟s real estate markets (Sowell, 2012).
As with the perception of investment style, investors‟ treatment of risks will almost invariably differ because each of them has a different view relating to the fundamentals that make up the investment, for example, income requirements, market expectations, and attitudes towards both general market risks and property specific risks (Danish Property Federation, 2013). Though it is hard to list all of them, and because of the different opinions among individuals, the general risk and considerations that would affect the investor‟s decision of` buy and sell ´ and the investment yield required may be observed. These risk factors are labeled: Risk free rate of investment, Market risk and Specific risks.
Like any other investment, to reduce the risk, investors tend to use a portfolio to create diversification. In the real estate market, from an international perspective, the principle is similar. The first research on the topic of international diversification was completed by Ibbotson and Fall (1979), who focused on calculating the total value of assets, including real estate, in the U.S. More recent publications on this topic include Hartzell, Miles (1986), who examined several diversification categories for real estate investment. Hartzell, Shulman and Wurtzebach (1987), who took a closer look at criteria for regional diversification and Mueller and Ziering (1992),
who analyzed real estate portfolios using a combination of economic and geographic diversification. This research tells us that if the assets in the portfolio do not correlate, the result of each wouldn‟t diminish the final return of the investment, so that would cause a risk-reduction benefit. Therefore, from an international perspective, when talking about the real estate market, a well-diversified portfolio should consist of assets from different geographic regions with different economic characteristics (Geurts and Jaffe, 1995) and it is likely that cultural factors could play a role in this consideration.
2.1 The Equilibrium of Real Estate Use
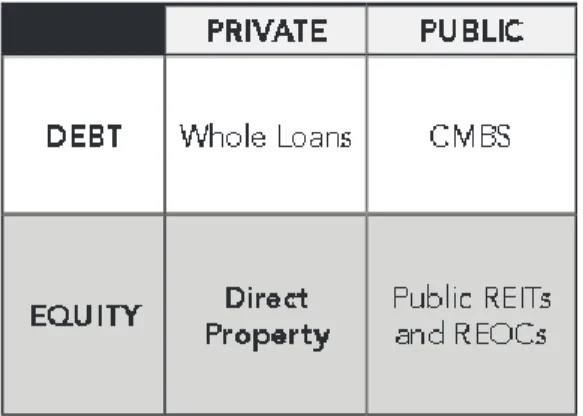
The evolution of the real estate market has enabled institutional investors to explore investment opportunities, and the market can be broken into a variety of structures and investment vehicles. The Four-Quadrant model shown below illustrates the different channels by which institutional investors can access the real estate market. Investments can be made through public or private vehicles and throughout the capital stack (Rogers, 2010). In this model, the four quadrants refer to the classification of real estate investing across all of the real estate related financial markets: public and private, debt and equity, which focuses on the links between real estate and capital markets. It reveals the fact that income from these investments relies on the performance of the underlying real estate notwithstanding the fact that the pricing, the risk and the liquidity will depend in which part of the spectrum (debt or equity) the investment occurs and whether it is traded in the public or private market (Harrington, Harris and Liossi, 2014). The authors gave the explanations and examples for each category, which are shown below.
Table 5 - Four-Quadrant Investment Model
Cultural effects on real estate market: an explanation of urbanization Private debt- Conventional mortgages, whole loans.
Public debt- Publicly traded mortgage securities, including residential and commercial mortgage backed securities (CMBS), securities issued by Fannie Mae, Freddie Mac, and private mortgage issuers.
Public Equity- Consists of real estate securities such as equity REITs or publicly traded real estate operating companies (REOCs).
Private Equity- Ownership of commercial real estate properties, either on a direct basis or indirectly through a commingled fund.
Historically, most office, retail spaces or industrial spaces have been built speculatively because the operation of the whole process required a sophisticated plan, beginning with site decisions, initial plans, the securing of necessary permits that may be required, etc. Land preparing and permission could take years. Considering the time value and the fact that people are risk averse, this enables the development company to ask for funds from other equity partners (DiPasquale and Wheaton, 1996). Because of the higher financial leverage, it differs with housing-based real estate. It is also noteworthy how risky commercial real estate tends to be when facing a general economic decline (Gyourko, 2009).
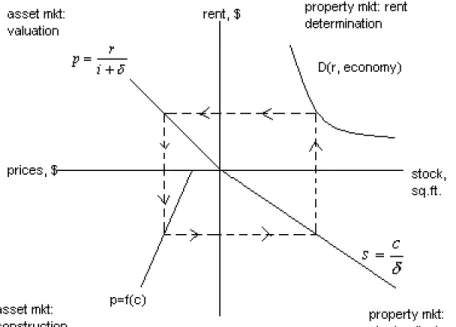
To understand rent, it is necessary to consider the market for the use of real estate (DiPasquale and Wheaton, 1996), since rent is determined in the property market as occupation of space, instead of in the asset market for ownership. Prior to DiPasquale and Wheaton, many authors completed research into the joint of capital and real estate market. Hendershott and Ling (1984) co-authored the first article on this topic. In 1987, Corcoran illustrates these two markets graphically and distinguishes them between short-term and long-term supplies of places. The most recent, formally published development in the field of diagrammatic integrated property and asset market models, is a quantitative version of the DiPasquale Wheaton model (1992), which was accompanied by Fischer, so that the term FDW was created (Toit and Cloete, 2003). The FDW model conceptualizes the interrelationships between Market for Space, Asset Valuation, the Construction Sector and Stock Adjustment.
According to the model, the connection between the asset market and the property market occurs in two areas which are demand for real estate assets, and increased supply in construction or development sectors. The relationships between these sectors are well illustrated in figure 6:
Figure 6 – FDW Model
Source: DiPasquale, Wheaton and Fischer (1992)
Many articles have talked about the FDW model. Based on DiPasquale and Wheaton, this model consists of four quadrants: the North-eastern quadrant (Quadrant I) which represents the demand for units by tenants; the North-western quadrant (Quadrant II) where price and rent are linked; the South-western quadrant (Quadrant IV) which is the supply curve of the construction industry; and lastly, the South-east quadrant (Quadrant IV) which details a certain level of construction and determines the level of stock that would be produced if that construction continued constantly. More specifically, quadrants I and II, represent the property market for the use of space, where III and IV quadrants deal with the asset market for the ownership of real estate. These four quadrants complete a 360-degree rotation around the diagram; shifts of certain variables in each quadrant will influence others, thus creating a new equilibrium in the market. Economic events could result in changes in movement in the model, but they would happen simultaneously. These economic events include decreasing employment rate, rising interest rate, changes in inflation rate etc. (Toit, 2003), which provide possibilities for cultural factors to be involved and influence the market.
The diagram should be seen as a dynamic movement of the market. The principle for the equilibrium of the real estate market is to have the same start and end value in the diagram, which
Cultural effects on real estate market: an explanation of urbanization
means balancing supply and demand. If the start value exceeds the end value, all the elements like rents, prices, and constructions must all rise to stay balanced. The same if the first quadrant has less value than the finishing one, all the elements have to decrease in order to be in equilibrium again. At the point at which the quantity of space demanded and supplied are equal to each other, the market is in equilibrium, and the observed rent is called market rent. To better understand the market it is important to analyze supply and demand.
2.2 Supply and Demand
The price of a certain product relies on supply-demand in relation to the market and it applies to the real estate market as well. In the real estate market, the supply of new real estate assets comes from the construction sector and depends on the cost of replacing or constructing the older ones; the demand comes from the occupiers of space which includes tenants and owners; firms and households (DiPasquale and Wheaton, 1996).
By looking the graph of supply and demand model below, unlike the conventional economic theory represented by model b, in real estate terms, a lower amount of space or number of units is demanded at an even higher price indicated by graph (a) shown in figure 7 (Sivitanidou, 2011).
Figure 7 – Fundamental Law of Demand
Source: Sivitanidou (2011)
Mayo, Malpezzi and Gross (1986) summarize a schematic diagram of how the housing market works. Inputs (land, labor, infrastructure, finance and materials) represent the Supply factors in the market, specifically, Infrastructure is provided by supply-side agents such as landlords and developers to produce housing services. Relative prices advise producers of housing services
about whether to provide or retain housing, and the input suppliers about providing more or fewer inputs.
Figure 8–Housing Market Operation Mechanism
Source: Mayo, Malpezzi and Gross (1986)
The differences between an efficient market and an inefficient market are shown in Carr, Lawson and Schultz´s chart in table 6 (2003). The main characteristic of an efficient market is that goods or services are easily produced and readily transferable, with a large number of buyers and sellers. An inefficient market is just the opposite: goods and services are not readily produced or easily transferable, with no readily recognized group of buyers and sellers active in a particular marketplace. Based on this description, the real estate market tends to be an inefficient market due to the long period of time between construction and sales. As displayed in the chart, in the inefficient market, the supply and demand level has a huge potential for being unbalanced for months or even years. Since the time for constructing an asset is relatively long, when the market is undersupplied normally a buyer would need to wait for the constructed home. Due to the uncertain period of time for delivery of the real estate, it is possible that demand changes, because the customer might no longer want the property due to the long period of waiting, which means it would cause oversupply. Historically the supply of buildings to meet people´s needs has been uneven: with too little space available during rapid growth time and too much supply when there is not much need in the market. This inconsistency between supply and demand is the major cause of volatility in real estate market cycles (Mueller, 2001).
Table 6 – Characteristic of Efficient/Inefficient Market
Characteristic Efficient Market (Stock market) Inefficient Market (real estate)
Products Homogeneous Unique
Inventory of Buyers and Sellers
Large number Few
Prices Uniform/Stable/Low (most can
afford)/Quality tends to uniformity at
Variable/ Inconsistent/ High (limited affordability)
Cultural effects on real estate market: an explanation of urbanization a set price
Restrictions Self-Regulating/ Few Government Restrictions
Many Restrictions
Supply and Demand Balanced (daily) due to competition Often Unbalanced (for months/ years)
Information/ Intelligence Fully Informed Participants Limited Accurate Information
Organized Conduit An Exchange None
Goods Readily Available/ Consumed
Quickly/ Supplied Easily/ Transportable
Years to Consume/ Months or Years to Supply/ Immobile Source: Carr, Lawson and Schultz (2003)
According to the Classical Supply and Demand Analysis in Real Estate, expounded by DeLisle (2010), the supply and demand relationship is illustrated as being seen to be in equilibrium.
Figure 9 – The Supply/Demand Analysis in RE Market
Source: DeLisle (2010)
The horizontal axis represents Quantity, which means the supply of property, and the vertical axis reflects the property command prices, Rent. Clearly, the relationship between Rent and Quantity is perfectly inversed in the chart, indicated by the slope that is labeled Demand. The demand slope suggests that the real estate market would find a point in which supply and demand are in equilibrium. The point also signifies that the rate of return will be determined by the market and will be commensurate with the relative risk. It is quite noticeable that if supply increases beyond that point, rents will fall since the market will be oversupplied and values will decline correspondingly. Though the graph is quite simple, it is dynamic and changes in factors are possible to move the curve, for example, changes in demand.
Source: DeLisle (2010)
As shown above, if demand increases significantly, rent would increase correspondingly due to the inelastic supply of buildings that generates the competition of tenants; ultimately, the higher price offer secures the house. On the other hand, if demand declines, the rents tend to fall as the market has an oversupply of space. The demand curve is the sensitivity of quantity demanded to price changes and this sensitivity is summarized by the concept of the Price Elasticity of Demand (Sivitanidou, 2011), which is calculated as the ratio of the percentage change in quantity demanded over the percentage change in prices.
ΔQ/Q [percentage change in quantity demanded]
εD = (2) ΔP/P [percentage change in price]
| εD| > 1 [demand is price elastic] | εD | = 1 [demand is unit elastic] | εD| < 1 [demand is price inelastic]
εD shows by what percentage the quantity demanded will decrease in response to a 1% increase in price. In general, if the price elasticity is less than one, demand is considered to be inelastic. Usually, the real estate market is price inelastic, the Price Elasticity is always lower than 1. If the Price Elasticity is equal to one then demand is considered to be unit elastic and increasing price would be exactly the same as the amount which decreases in quantity demand. Lastly, if the value is larger than 1, demand is considerable to be elastic. Developers and investors tend to like an inelastic market, since the increase in price would bring about higher revenue. Though demand would decrease; the gain from rent is high enough to be eliminated (Kau and Sirmans, 1985).
Cultural effects on real estate market: an explanation of urbanization
Stated by Mueller (2011), the real estate market has its equilibrium point for supply and demand in a more complicated model. He explained the theory by using the real estate cycle graph, which is separated into four quadrants that are connected because of the supply and demand relationship in the real estate market.
Figure 11 – Market Quadrants Cycles
Source: Mueller (2011)
The graph above depicts the supply and demand relationship through the Occupancy Level and the Time Period. The line which divides phases 2, 3 and phases 1, 4, is called `long-term occupancy average´ (LTOA) or `normalized occupancy level ´, both of which the market goes through during an up-cycle and a down-cycle. The Occupancy Level is the difference between total supply (including newly constructed space) and effective demand. As shown in the graph, the curve has an upside trend in phases 1 and 2(Recovery and Expansion), where demand growth rates are higher than supply growth rates. Phases 3 and 4 (Hypersupply and Recession) represent the opposite. Supply and demand would perfectly match each other only at the peak point (Demand/Supply Equilibrium Point), with existing space plus new construction exactly matching new demand so that at this point the oversupply ends and demand turns positive. After this peak, either the demand growth rate starts to decline or the supply growth rate accelerates. The supply and demand equilibrium might occur numerous times, since future demand cannot be precisely predicted and supply does not respond immediately to demand changes. Other economic activities which occur in everyday life and factors from a buyer´s willingness, etc. all influence the balance in the long run.
The typical and basic determinants for shifting the demand curve in the economic model are: (1) consumers‟ tastes (preferences), (2) the number of consumers in the market, (3) consumers‟ incomes, (4) the prices of related goods, and (5) expected prices (McConnell, Brue, and Flynn, 2010). In the real estate market, the factors that could change the demand could be seen as endogenous (prices and rents), but also should consider exogenous determinants (Sivitanidou, 2011), some of which are overlap with the traditional economic supply and demand model. In her opinion, the external factors are significant for assessing real estate market prospects, evaluating project viability, identifying real estate development and investment opportunities. She summarizes the drivers of the demand into four categories: Market Size (Population, Employment), Income/Wealth, Prices of Substitutes, and Expectations. She places more importance on the economic determinants, but did not deliberate the consumers‟ tastes in the category, which I think is essential for an investment decision, both for the buyer and seller.
Logan (2012) summarizes the housing demand factors from ECO Northwest‟s literature review by seeing the factors as a function of the interactions of population growth, income, housing prices, and housing preferences. These factors are well known as `the six P´s´: Population, Purchasing Power, Preferences, Prices (and costs) of Housing, Prices of Housing Substitutes and Policy. I tend to agree with the idea of paying more attention to socioeconomic factors in regards to the current real estate investment market. It is quite obvious that different households will value what they can get differently since they have different preferences which in turn is a function of many features which include: income, age of household, number of people and children in the household, number of workers and job locations, number of automobiles, and so on. The consumer‟s decisions are likely to be vastly different, and dozens of factors weigh disproportionally in their mind, these factors that directly or indirectly correlate with the results are socioeconomic and demographic characteristics. Lastly, since the demand of a certain region is composed by thousands of households, it is worthwhile to consider regional factors from a global perspective.
The globalization of businesses has increased demand for the kind of office buildings and infrastructures required by large businesses, which boost metropolitan markets fueled by international financial capital. Due to the change in demand, major development and construction groups and real estate consultants operate on an international scale (Cushman & Wakefield, Jones Lang Lasalle, etc.), the worldwide trend calling attention to cultural understanding. Investors tend
Cultural effects on real estate market: an explanation of urbanization
to add foreign real estate physical assets or foreign real-estate-related financial securities to their portfolio which increases the integration of global financial markets, which in this case tends to have an impact on the pricing of these assets.
The effect on current real estate markets of global migration is another example of the effect of globalization on real estate. Where the global movement of people is also connected to the hospitality sector (Bardhan and Kroll, 2007); analysts expect strong growth in global tourism in the coming years, primarily fueled by the large numbers of Chinese citizens venturing abroad. Besides the USA and the UK, Europe has become an attractive destination for Chinese citizens since 1980 (Latham and Wu, 2013).
Table7– Global Growth Distribution of the Overseas Chinese Population since 1980 (million)
Cities, meanwhile, have taken their own initiatives to manage migration at a local level and directly interact with migrants. The immigration policies and programs in some countries are now integral to their urban development and management, in this case, largely influencing the real estate market (IOM, 2015). Migrants are regarded as a resource and opportunities for low-middle income countries.
Bardhan and Kroll (2007) also point out that in spite of rapid globalization, it should be noted that real estate is still primarily influenced by indigenous factors. Local knowledge, local economies, local factors and local institutions will continue to play a significant role, albeit somewhat affected now by firms, consumers and economic influences from other, distant parts of the world. Regardless of what occurs on the supply and demand side, better understanding of local culture would bring about positive effects.
2.3 Bubbles, Inflation and Saving
A common phenomenon in big cities around the world is the rising demand for housing and the soaring cost of housing prices, which have caused real estate bubbles. The term `asset bubble´ is defined as inflation of the price of an asset relative to its fundamental value (Valadez, 2010).It is similar to the concept of ` irrational exuberance ´, which was used to describe the stock market‟s behavior in the 90s by Alan Greenspan, then Governor of the Federal Reserve (Greenspan, 1996).
Existing theories regarding housing bubbles have been ambiguous. In Lind (2008), the author attempts to review some literature on the subject. He references Case and Shiller (2003), who argue that clear evidence and indicators existed of a bubble in the USA. This conclusion was questioned by Quigley (2003), Himmelberget. al. (2005), Smith and Smith (2006). In the mainstream magazine The Economist in 2005, it was argued that the largest bubble in history could be observed in the housing market. But it is also easy to find popular articles arguing against this view, for example, Krainer (2003).
Holt (2009) believes the cause of a bubble in real estate market is affected by all the participants who contributed to the market: government regulators, mortgage lenders, investment bankers, credit rating agencies, foreign investors, insurance companies, and home buyers. The universal assumption of increasing house prices led the participants to make the decisions that created the bubble. In addition, low mortgage interest rates, low short-term interest rates, and relaxed mortgage lending standards all contributed to the housing bubble.
More straightforwardly, Walterskirchen (2010) explains the bubble´s existence by defining the real estate market as a speculative market (stocks, real estate, commodities), because of buyer´s abnormal reactions to changes in price. Generally, if prices go up, demand falls correspondingly. Conversely, in speculative markets purchases raise when prices grow since further price increases are expected. Expected price increases have a self-fulfilling tendency on all markets as purchases are carried forward; in asset markets, there is the additional expectation of an increase in real values.
Cultural effects on real estate market: an explanation of urbanization
Lind (2008) believes that the ambiguity for real estate bubbles comes from the unsatisfactory definition of `bubble´. He seriously doubted the original concept when it was coined by Stiglitz in 1990. Stiglitz believes that the reason that the price is high is only because investors trust that the selling price will be higher tomorrow- when `fundamental´ factors do not seem to justify such a price. In this case, a bubble exists. Lind finds this theory problematic: the lack of a bubble episode as a whole; the narrowing of the definition `only´ and the definition for `fundamental´ is vague. He sums this up in the diagram below, which explains and defines the components and influences for a bubble in the real estate market.
Figure 12- Theoretical Framework for Explaining Bubbles
Source: Lind (2008)
Using his explanation, I believe that `Beliefs, expectations and plans´ should be brought to the forefront. Like anything else, expectation has pros and cons. Indicated by the famous economist Hyman Minsky (Minsky, 1986), the holding of high expectation would lead to a speculative euphoria, and eventually cause the financial crisis accompanied with a bubble burst. This change in the financial system from stability to fragility, followed by crisis, is something for which Minsky is well-known, and where the phrase "Minsky moment" comes from. As I am emphasizing in this paper, it is important to take into account the perspectives of people. In regards to the bubble, it should be expected that certain buyers who bought assets during the price increase episode have heterogonous beliefs, higher expectations and plans for the future. These aspects are strongly connected with cultural factors; people who come from a country with high uncertainty avoidance are unlikely to venture their capital while the market is volatile.
Lind (2008) gives a list of indicators of a bubble which include: - Prices and incomes
- Housing expenditure - Housing supply
- Buyer expectations about prices
- Buyer impatience and financial risk taking - The credit market
- Speculative behavior
Many scholars have debated bubble indicators, and the term `Prices and Incomes´ has caused many disputes. For example, Case & Shiller (2003), found the ratio of price and income had remained very stable in some regions; Taipalus (2006) discovered many European countries have rent regulations that make the interpretation of the rent/price ratio difficult and unrepresentative. More persuasively, households care about the relation between housing expenditure and incomes, not the relation between price and income (McCarthy and Peach, 2004). I agree with Lind´s opinion regarding this issue, he explains that the ratio might not be acceptable because even in the fastest growing countries or regions, incomes do not grow more than around 10% per year, which means that any period with a dramatic rise in prices would be characterized by an increased price to income ratio, and the ratio would therefore not make it possible to distinguish periods where prices increase because of a structural shift or by factors that will not last.
Bearing in mind the perspective of people, I found Dean Baker´s (Baker, 2007) list of Housing Bubble Economic Indicators interesting. Though it is conspicuous, it is practical and comprehensive. Several indicators which do not overlap the ones found in Lind´s are contained: the Vacancy Rates, the Consumer Price Index, the Housing Starts, the Residential Construction, the Residential Investment and the Industry Employment. These are tools for researching the market. As I see it, the bubble is a result of various economic activities and is influenced by different indicators; it is impossible to simply use one indicator and assert the existence of bubble. The most important thing is to understand the principle of using these indicators instead of judging the preciseness of them.
Cultural effects on real estate market: an explanation of urbanization
Practically, Li summarizes an indicator system after analyzing the housing market in China in 2007. This system of indicators includes the Price to Income Ratios, the Price Increase Rate, the Rent to Price Ratios and the Investor Psychology which together indicate the bubble generation in China. She lists the standard of bubble reference in Housing Price and Housing Supply and compares the conditions in China at that time. These comparisons are shown below.
Table 8 - Housing Price Index in China 2007
Table 9 - Housing Supply Index in China 2007
The data sources from her research go back to 2006, when the housing inflation conditions `Little Bubble´ and the `Serious Bubble´ were occurring. As time passes, the level could increase. Due to the decade-long housing market boom in China, it is not hard to find other research regarding this subject. To Western people, it might be difficult to understand the willingness of households in China to endure such severe financial burdens for a home. This is not only because of a financial change, but it is a cultural matter as well. The importance of owning a piece of real estate and a sense of belonging has been handed for thousands years. Even during 2008-2009, though China was under severe financial pressure, the housing market remained strong especially in Shanghai, Beijing, Guangzhou, etc. The data from the National Bureau of Statistics clearly shows how diverse the economic development is in China´s different provinces. A different feature is that the housing market in China has a clear direction of commercialization. Compared with most western countries, commercialized residential buildings in the real estate market are more prevalent than secondhand housing due to the housing market revolution in 1998.
A recent piece of research about the housing boom in China was conducted by Fang, Gu, Xiong, and Zhou (2015) who investigated the bubble generation in different city tiers and point out that the housing boom in China is accompanied by economic growth. The performance regarding the housing market differs between regions because of the income growth differences. Demographic reasons of in-land migration are another key factor for a first tier city like Shanghai to grow rapidly, which helps a city´s economic growth and in turn maintains increasing buyer´s expectations. Their research confirms the article from Li (2007) - there are huge regional differences in the Chinese real estate market and certain factors result in different influences in different regions. Though first tier cities grow more rapidly with soaring prices than second and third tier cities, it tends to be more violate and fragile when facing any negative influences. Second and third tier cities, however, have a relatively steady increase.
A 2003 survey in Los Angeles, San Francisco, Boston and Milwaukee about investigating home buyer behavior during a housing price bubble period from Case and Shiller is useful. The survey sheds light on a number of aspects of buying behavior which include investment motivations, expectation of further price rises, the amount of local excitement and discussion about real estate, the sense of urgency in buying a home, the adherence to simplistic theories about housing markets, the occurrence of sales above asking prices, and the perceptions of risk-that suggest the