IOP Conference Series: Materials Science and Engineering
PAPER • OPEN ACCESS
Effect of Debris on the Local Scour at Bridge Piers
To cite this article: Ana Josefa Dias et al 2019 IOP Conf. Ser.: Mater. Sci. Eng. 471 022024
View the article online for updates and enhancements.
Content from this work may be used under the terms of theCreative Commons Attribution 3.0 licence. Any further distribution of this work must maintain attribution to the author(s) and the title of the work, journal citation and DOI.
Published under licence by IOP Publishing Ltd
WMCAUS 2018
IOP Conf. Series: Materials Science and Engineering 471 (2019) 022024
IOP Publishing doi:10.1088/1757-899X/471/2/022024
1
Effect of Debris on the Local Scour at Bridge Piers
Ana Josefa Dias 1, Cristina Sena Fael 2, Francisco Núñez-González 3
1 Faculdade de Engenharia, Universidade da Beira Interior, Covilhã, Portugal 2 C-MADE, Faculdade de Engenharia, Universidade da Beira Interior, Covilhã, Portugal
3 Leichtweiß-Institut für Wasserbau, Technische Universitat Braunschweig, Braunschweig. Germany
Abstract. Scour is one of the most recurrent causes of failure of bridge structures in alluvial
rivers. There is a variety of formulas for the assessment of bridge scour characteristics and for the design of suitable protection. Nevertheless, current approaches neglect the effect of debris carried by natural streams during floods, even when the accumulation of debris can extremely amplify the action of scouring processes. Until now, very limited efforts have been conducted to systematically investigate these effects. The present study focuses on the effect of debris on the maximum clear-water scour depth at cylindrical piers inserted in uniform, fully-developed turbulent flows in wide rectangular channels with flatbed composed of uniform, non-ripple forming sand. For these purposes, an experimental campaign was carried out by performing 17 long-duration (td = 7 days) experiments. The experimental tests were performed in the hydraulic
structures channel at the University of Beira Interior. The channel was 0.83 m wide, 12.0 m long and 1.0 m deep. In the central reach of the flume, a 3.0 m long and 0.30 m deep recess exists where scour is free to develop. The experiments were carried out with a cylindrical pier with 0.05 m diameter and two boxes, each with debris of different dimensions, either of triangular or rectangular shape. The tests were carried out with constant approach flow depth, d = 0.15 m, and average approach flow velocity, U, approximately equal to the average approach flow velocity for the threshold condition of sediment entrainment, Uc≈ 0.31 m/s. For this velocity, the scour
depth can be expected to be maximal. The experiments will give a special focus to the development of scour hole as the accumulated debris increase. Moreover, the experimental results will be compared with a reference experimental run without debris, so that the increments on scour depth due to the single debris clusters of different characteristics will be obtained and discussed. The following conclusions were obtained: i) The shape and position of the debris accumulation have a strong influence on the final scour depth. Debris placed on the bottom, upstream of the bridge pier, with a triangular shape, does not induce any increase in scour depths, the values are practically the same as the one obtained for the reference pier (without debris); ii) The method suggested by [3], as modified by [6], performed well, replicating the main trends observed in the experiments; and the influence of the relative submerged ratio of the debris on the scour depth, followed the trend observed previously by [8], with an increasing scour depth up to a critical value of the ratio, and then decreasing scour for ratios higher than this critical value.
1. Introduction
The analysis of the most frequent causes of deterioration and bridges' failures allows to conclude that the hydraulic issues are among those that lead to more serious situations. Among the most recurrent,
WMCAUS 2018
IOP Conf. Series: Materials Science and Engineering 471 (2019) 022024
IOP Publishing doi:10.1088/1757-899X/471/2/022024
2
and given its importance, are mentioned those associated with local scour next to bridge foundations (piers and abutments), and the hydrodynamic loading induced by floods or the debris accumulation in front of the bridge piers and abutments. The large wood debris carried by floods affects the morphology of the scour hole that develop next to the bridge foundations, increasing the probability of its failure. The interaction between the flow and the roughness of the debris increases the shear stress, the turbulence, and, consequently, the scour evolution process at bridge piers [1]. Consequently, the prediction of the maximum scour depth is a key issue in bridge engineering.
Regarding the impact of the woody debris accumulation on bridge piers, which has been the focus of several researchers since the 1990s and their interest are continuously growing. The motivations have been varied and, among them, their effect on the scour processes around single piers, [2], [3], [4], [5], [6] and [7], [1], among others (as mentioned by [8] and [9]). In spite of the progresses made on this topic, the effects of debris accumulation at bridge piers scour is still a concern due to lack of knowledge ([10] and [11].
In this scope, the objective of this experimental study was to evaluate the effect of the single debris clusters on the local scour at bridge piers. Tests were carried out under clear-water conditions, i.e., conditions in which the mean velocity of the undisturbed approach flow is below or at the threshold velocity for the beginning of motion. Two positioning of the debris were considered, in the two extreme situations, either debris floating on the water surface or debris placed at the sand bed. These situations are comparable to the extreme cases described on [7], where a photographic archive served to identify common size and shapes of accumulated debris at bridge piers. Furthermore, the maximum depth of the local scour developed in the presence of the debris was compared with the maximum depth of the local scour developed without them.
2. Framework for analysis
In the case of the approach flow being fully developed and uniform in wide rectangular channels, whose bed is composed of uniform non-ripple forming sand, assuming that the local scour phenomenon around an isolated cylindrical pier occurs in clear-water conditions in the approach flow and the flow inside the scour hole is rough turbulent, it can be demonstrated that the scour depth is described by the following set of non-dimensional parameters [12]:
= ∅ ; ; ; (1)
where dS is the scour depth at the instant t; Dp is the pier diameter; d is the approach flow depth; U is the
average velocity of the undisturbed approach flow; Uc is the approach flow velocity for the threshold
condition of the sediment entrainment; D50 is the median grain size; d/Dp is the flow shallowness, U/Uc
is the flow intensity; Dp/D50 is the sediment coarseness and Ut/Dp is the non-dimensional time.
In the case of debris accumulation on bridge piers, the previous equation comes to include new parameters and can be generalized as follows:
= ∅ ; ; ; ; ; ; ; (2)
where T is the thickness of debris; W is the width of debris; L is the stream-wise debris length and hd is
the debris centre distances from the flow surface.
For: i) equilibrium situation, where ds no longer depend on time - taking the maximum value, dsm; ii)
U/Uc are constant (usually U/Uc≈ 1.0 in laboratory conditions so as to maximize the scour depth); and
WMCAUS 2018
IOP Conf. Series: Materials Science and Engineering 471 (2019) 022024
IOP Publishing doi:10.1088/1757-899X/471/2/022024
3
= ∅ ; ; ; (3)
The function φ that describe the influence of the debris variables on the local scour was defined by [6], for the range of conditions tested in laboratory, through the coefficient Kdb or ad*
𝐾 𝑜𝑟 𝑎∗ = 𝑓 ; ; ; (4)
According to [3], for design purposes, the scour depth with floating debris may be estimated by assuming an effective diameter, like an equivalent diameter of the pier, which is evaluated from the dimensions of the pier and debris. They provided the following equation for the calculation of the equivalent width, be, at bridge piers in the presence of debris accumulation.
𝑏 = (5)
where Kd1 is the dimensional coefficient equal to 0.52 [2].
Reference [7] based on laboratory data, proposed a modification to the equivalent width equation, since only the width and thickness of debris were considered. As there was no vertical location of the submerged debris position, it was proposed to modify the equation (5) and is denoted by ad* and is given
by:
𝑎∗ = / (6)
where Kd1 is the shape factor of debris; and Kd2 is the plunging flow intensity factor. For debris with a
rectangular shape, Kd1 = 0.39 and Kd2 = −0.79, while for triangular-conical shapes, Kd1 = 0.14 and Kd2 =
−0.17.
The recommended design equations for estimating an equivalent pier width for use with the HEC-18 pier scour equation are, therefore:
𝑎∗ = / 𝑓𝑜𝑟 > 1.0 (7)
𝑎∗ = 𝑓𝑜𝑟 ≤ 1.0 (8)
where, on the equation (7) for debris with a rectangular shape, Kd2 = −0.79 and for triangular-conical
shapes, Kd2 = −0.17 and for the equation (8) and for debris with a rectangular shape, Kd1 = 0.79, while
for triangular-conical shapes, Kd1 = 0.21. 3. Experimental setup and procedure
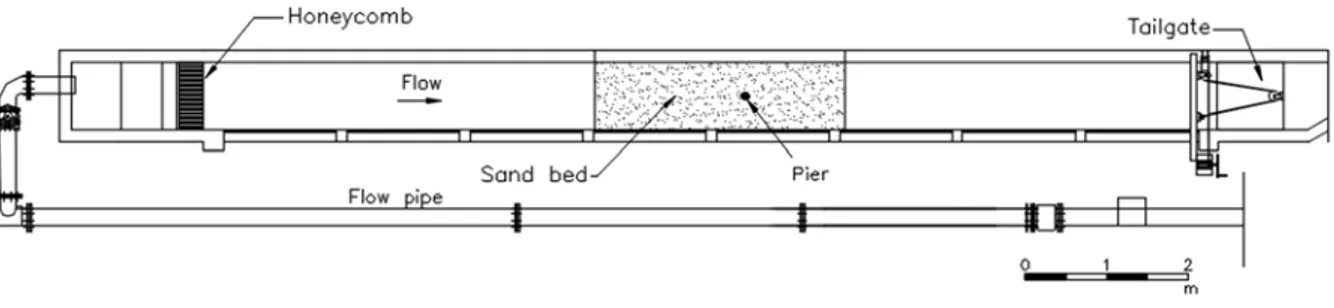
Seventeen experiments were carried out in a 12.00 m long, 0.83 m wide and 1.00 m high concrete flume located at the University of Beira Interior. Figure 1 presents the plan view of the experimental setup. The right lateral wall is made of glass panels that allow the observation of the flow in the central reach where the local scour develops. The central reach of the flume, starting at 5.15 m from the entrance, included a 3.00 m long and 0.30 m deep recess box in the channel bed. The recess box was filled with natural quartz sand of which the median diameter is D50 = 0.86 mm and the gradation coefficient is σ =
1/2(D84.1/D50 + D50/D15.9) = 1.36 (ρs = 2650 kg/m3). The flume includes a hydraulic circuit where the
WMCAUS 2018
IOP Conf. Series: Materials Science and Engineering 471 (2019) 022024
IOP Publishing doi:10.1088/1757-899X/471/2/022024
4
reservoir. At the downstream end of the flume, a tailgate allows the regulation of the water depth, which was kept equal to 0.15 m. At the entrance of the flume, one honeycomb diffuser aligned with the flow direction smoothed the flow trajectories and guaranteed the uniform cross-wise flow distribution.
Figure 1. Plan view of the experimental setup
The pier was simulated by a 0.05 m diameter PVC pipe, and the single clusters debris was simulated by wood inserted in boxes made of wire mesh, i.e., all rough and permeable. Two types of boxes were used, rectangular prism (rectangular in planform and profile) and triangular prism (triangular in planform), each one in four sizes, according to table 1, where the associated values of the width of debris normal to the flow, W, thickness of the debris, T, and the length of the debris upstream from pier face, L, are summarized. The boxes were inserted upstream of the pier at the beginning of the tests, in two forms, floating at the water surface or placed at the sand bottom, both at a distance hd measured between
the debris center and the flow surface. It should be noted that when the triangular-shaped debris are placed on the sand bottom they are placed in their inverted shape (collapsed form), as suggested by [4].
Table 1. Tested debris shapes and dimensions Debris shape Dimensions
W(cm) x L(cm) x T(cm)
Debris position Depth
hd (cm) Retangular (RT) 10 x 5 x 5 10 x 5 x 10 2.5 12.5 x 6.25 x 5 12.5 x 6.25 x 10 5.0 Triangular (TR) 10 x 5 x 5 10 x 5 x 10 10.0 12.5 x 6.25 x 5 12.5 12.5 x 6.25 x 10
Before starting each experimental test, the experimental procedure was performed: i) The pier with or without the debris was placed and fixed to the recess box floor; ii) The sand bed in the recess box was carefully leveled with the adjacent flume bed; ii) The area located around the pier or around the pier with debris was covered with a thin metallic plate; iv) The flume was then filled gradually, imposing a high water depth and a low flow velocity; v) The discharge corresponding to the approach flow velocity, measured by an electromagnetic flow meter with an accuracy of ± 0.5% of full scale, was then adjusted to pass through the flume; vi) The flow depth was manually adjusted operating the downstream tailgate;
WMCAUS 2018
IOP Conf. Series: Materials Science and Engineering 471 (2019) 022024
IOP Publishing doi:10.1088/1757-899X/471/2/022024
5
vii) Once the discharge and flow depth were established, the metallic plate was removed and the experiment started; and viii) When a given experiment was stopped, the flume was slowly drained.
Figure 2. Scour depth time evolution, tests T1, T3, T7, T11, and T15 (td = 7 days)
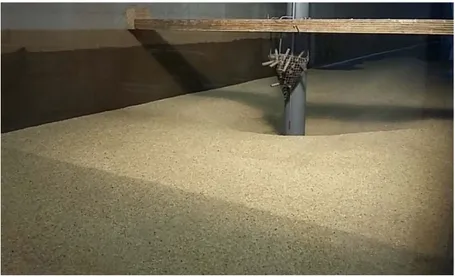
Figure 3. Typical sand-bed reach of the piers at the end of the tests (test T11)
The scour depth time evolution was monitored by measuring the scour depth with the help of a point gauge, to the accuracy of ± 1 mm, every 5 minutes during the first half hour, every 10 minutes during the next half hour, every 15 minutes during the second hour, every 30 minutes during the subsequent two hours, and then one hourly measurements were taken during four hours. On the following days, 2 to 3 measurements per day were performed. When the seventh day was completed, the experiments were stopped, in agreement with [13]. Figure 2 shows the scour depth time evolution for the reference test without debris (test T1) and runs with debris in their four variants: with rectangular and triangular boxes, either with floating debris at the water surface or debris on the sand bottom (tests T3, T7, T11 and T15), for a given size of the boxes, being similar to the remaining tests. The sand bed reach upstream of the experimental pier stayed undisturbed through the entire duration of the experiments; this long term stability ensured that the scour depth was not supplemented by upstream bed degradation, as documented in figure 3. It should be noted here, that no ripples developed along the tests since the practically uniform sand used prevents the development of such bed forms, as referred by [17].
0,00 0,05 0,10 0,15 0 20 40 60 80 100 120 140 160 180 ds (m ) t(h) Test without debris, T1
Rectangular floating debris, T3 triangular floating debris, T11 Triangular debris in the bottom, T7 Rectangular debris in the bottom, T15
WMCAUS 2018
IOP Conf. Series: Materials Science and Engineering 471 (2019) 022024
IOP Publishing doi:10.1088/1757-899X/471/2/022024
6
4. Results and discussions
4.1. Data characterization
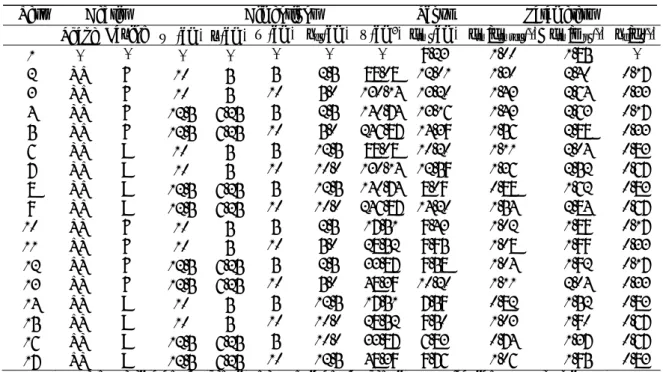
The values of the control variables and non-dimensional parameters characterizing the experiments carried out in this study are summarized in table 2. Where dsm is the scour depth measured at end of each
experiment and dsm ref is that value obtained to the pier scour depth without debris, considered as a
reference. As mentioned before, the pier diameter is constant with a value of 0.05 m, and the values considered for high relative flow depth (d = 0.150 m; d/D50 = 174.42) was guaranteed. The average flow intensity, U/Uc, was kept constant and equal to 0.96, with Uc being calculated through the predictor of
[14]as Uc≈ 0.31 m/s. The approach flow Froude number, expressed by Fr = U/(gd)0.5 is about ≈ 0.25.
The ratio of channel width to flow depth, B/d, was kept equal to 5.5, this way avoiding significant wall effects on the flow field. The ratio of channel width to pier diameter, B/Dp, is equal to 16.6. This result
agrees with others reported in [15], who have suggested that contraction scour is negligible for values of B/Dp as low as 2.0 to 2.5. Also, according to [16], contraction scour is null for B/Dp ≥ 10. Thus, it is
safe to state that contraction effects were not present in the present study. In fact, contraction scour seemed absent since no bed degradation was observed over the contracted cross sections [17]. From table 2 it can be concluded that the scour depth is lower for the cases where the debris are on the sand bottom in comparison to floating debris. Conclusion that goes in line with the one mentioned by [1], where it refers that the debris accumulation was found to generally increase scour. However, when placed at the and bottom tends to reduce the scour depth.
Table 2. Characteristics of control variables and non-dimensional parameters carried out in this study
Test Debris Dimensions Scour Parameters
Shape Laying W (cm) L(cm) T (cm) hd (cm) V(cm3) dsm (cm) dsm/dsmref (-) dsm/Dp (-) hd/d(-)
1 - - - 9.23 1.00 1.85 - 2 RT F 10 5 5 2.5 88.08 12.01 1.30 2.40 0.17 3 RT F 10 5 10 5.0 130.14 13.20 1.43 2.64 0.33 4 RT F 12.5 6.25 5 2.5 140.74 13.16 1.43 2.63 0.17 5 RT F 12.5 6.25 10 5.0 246.87 14.39 1.56 2.88 0.33 6 RT B 10 5 5 12.5 88.08 10.20 1.11 2.04 0.83 7 RT B 10 5 10 10.0 130.14 12.59 1.36 2.52 0.67 8 RT B 12.5 6.25 5 12.5 140.74 8.09 0.88 1.62 0.83 9 RT B 12.5 6.25 10 10.0 246.87 14.20 1.54 2.84 0.67 10 TR F 10 5 5 2.5 17.51 9.43 1.02 1.89 0.17 11 TR F 10 5 10 5.0 28.52 9.95 1.08 1.99 0.33 12 TR F 12.5 6.25 5 2.5 33.87 9.58 1.04 1.92 0.17 13 TR F 12.5 6.25 10 5.0 48.39 10.20 1.11 2.04 0.33 14 TR B 10 5 5 12.5 17.51 7.59 0.82 1.52 0.83 15 TR B 10 5 10 10.0 28.52 9.50 1.03 1.90 0.67 16 TR B 12.5 6.25 5 10.0 33.87 6.83 0.74 1.37 0.67 17 TR B 12.5 6.25 10 12.5 48.39 9.76 1.06 1.95 0.83
RT – Rectangular debris; TR – Triangular debris; F – Floating; B – Bottom 4.2. Effect of debris shape
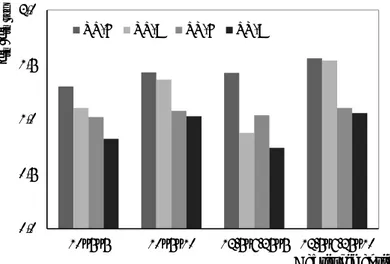
As previously mentioned, in this study two boxes of debris with rectangular and triangular shape, floating or placed at the sand bottom were tested. In figure 4 the effect of the debris shape on the relative scour depth, dsm/dsm ref, is presented. As can be seen, the rectangular shape leads to greater scour depths.
A similar conclusion to that is described by [9]. It is still possible to verify that the scour depth is more sensitive to the shape than to the increase in the size of the debris. Excluding test 8, the same conclusion may be drawn with respect to its relative submersion, hd/d, presenting an average value of 44% higher
WMCAUS 2018
IOP Conf. Series: Materials Science and Engineering 471 (2019) 022024
IOP Publishing doi:10.1088/1757-899X/471/2/022024
7
hand, the triangular configuration does not induce any increase in scour depths, the values are practically the same as the one obtained for the reference pier (without debris). According to [9], the higher depths of the scour hole at bridge piers with rectangular debris results from the drastic deflection of the current lines when they collide with the pier, leading to a greater separation of the flow and the formation of stronger wake vortexes behind them.
Figure 4. Variation of dsm/dsm ref with the debris shape
4.3. Maximum scour depth
Figure 5 shows the variation of the maximum scour depth measured, dsm, with the effective volume of
the debris, V. The figure also includes the curve obtained in the present study, excluding in that evaluation the tests 8, 14 and 17, given that they have values smaller than the obtained with isolated pier. From the results, it can be concluded that dsm increases with the effective volume of the debris, as
seen in the obtained equation,
𝑑 = 5.243𝑉 . (9)
whose correlation coefficient is R2 = 0.88.
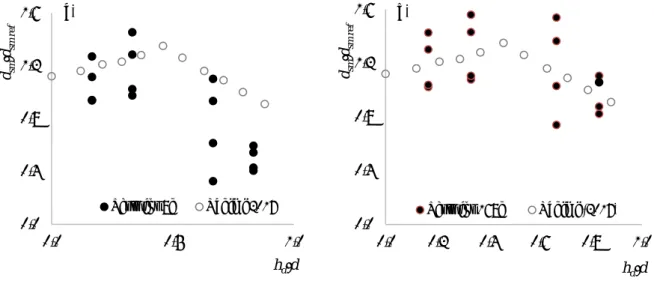
Then, the dsm measured are compared with the results obtained by [9], for simple piers. The figure 6
a) presents the values of the relative scour depth, dsm/dref, with the relative submerged ratio, hd/d, for 8h
runs and 8 b) for 168h (7 days) runs. It should be noted that [9] only obtained results for 8h runs. The conclusion is similar to that reported by [9]. Where it was found that the maximum scour depth increased by increasing the debris relative submerged ratio and reached a maximum value at hd/d = 0.33; for higher
relative submerged ratios, [9] found that the scour depth decreased, and eventually reached a smaller value than at piers without debris. In other words, [9] found that by increasing the distance between the debris and the flow surface, the strength of the down flow jet increased, while further increments of hd/d
caused decreasing scour depths [9]. 0,0 0,5 1,0 1,5 2,0 10x5x5 10x5x10 12.5x6.25x5 12.5x6.25x10 dsm /dsm ref Debris dimension RT-F RT-B TR-F TR-B
WMCAUS 2018
IOP Conf. Series: Materials Science and Engineering 471 (2019) 022024
IOP Publishing doi:10.1088/1757-899X/471/2/022024
8
Figure 5. Variation of dsm measured width debris effective volume
Figure 6. Variation of dsm/dref vs. hd/d: a) for td= 8h; b) for td = 168h
Lastly, the measured dsm values for all runs with debris are compared with those predicted based on
the CSU equation, as suggested in HEC-18 [18]:
= 2𝐾 𝐾 𝐾 𝐾 . 𝐹 . (9)
where, Dp is the effective pier width with debris, K1 is the correction factor for pier nose shape, K2 is the correction factor for angle of attack of flow, K3 is the correction factor for bed conditions and K4 is the
correction factor for armouring by bed material size. In the conditions of the present study, K1 =K2 = K4
= 1.0 and K3 = 1.1, and the equation 9 reduces to:
= 2𝑥1.1 . 𝐹 . (10) 5,0 10,0 15,0 0 100 200 300 dsm (cm ) V(cm3) dsm refence RT-F RT-B TR-F TR-B 0,0 0,4 0,8 1,2 1,6 0,0 0,2 0,4 0,6 0,8 1,0 dsm /dsm ref hd/d b)
Tests for 168h Rahimi (2017)
0,0 0,4 0,8 1,2 1,6 0,0 0,5 1,0 dsm /dsm ref hd/d a)
WMCAUS 2018
IOP Conf. Series: Materials Science and Engineering 471 (2019) 022024
IOP Publishing doi:10.1088/1757-899X/471/2/022024
9
For that, it will be necessary to evaluate previously the effective pier width with debris. In figure 7 the equivalent diameters proposed by [3] are analyzed and are obtained through the coefficients Kd1 and
Kd2 of [7]. Also included were the results obtained by [7] for the case of floating debris at the water surface and U/Uc = 1.0. It should be noted that the Melville-Dongol equation does not take into account the shape of the debris (e.g., rectangular vs. triangular) and nor does it consider the debris length extending upstream from the pier. The comparison existing in figure 5, is done through the values considered by [3] (equation (6)) with values proposed by [7] and for be the values considered by [2].
The results obtained from be and ad* are similar for rectangular debris with an average deviation of 6%,
whereas for triangular debris the differences is higher, with an average deviation of 14%.
Figure 7. Variation of the modified effective width to the effective width
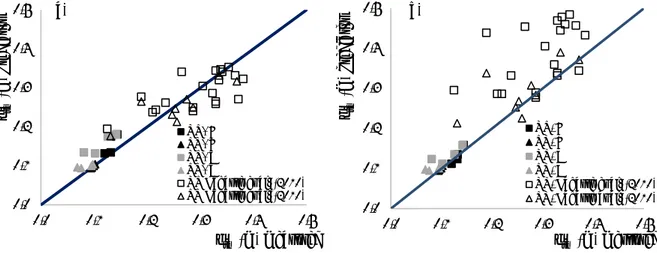
In figure 8 a) and b) the CSU equation was use, in the figure 8 a) considering that the Dp is the pier
width calculated using the modified version of Melville-Dongol equation (equation 6) whereas in the figure 8 b) the Dp is the pier width calculated using the recommended version of the Melville-Dongol
equation (equation 8). Also included were the results obtained by [7] for the case of the floating debris at the water surface and U/Uc = 1.0.
Figure 8. Measured dsm vs. corresponding predictions according to CSU equation; a) Melville-Dongol modified equation; b) Melville-Melville-Dongol recommended equation
0,0 0,1 0,2 0,3 0,0 0,1 0,2 0,3 be (m ) ad* (m) RT-F TR-F RT-B TR-B RT, Lagasse et al. (2010) 0,0 0,1 0,2 0,3 0,4 0,5 0,0 0,1 0,2 0,3 0,4 0,5 dsm (m ) predictor dsm(m) measured a) RT- F TR- F RT- B TR- B RT Lagasse et al. (2010) TR Lagasse et al. (2010) 0,0 0,1 0,2 0,3 0,4 0,5 0,0 0,1 0,2 0,3 0,4 0,5 dsm (m ) predictor dsm(m) messured b) RT, F TR, F RT, B TR, B RT, Lagasse et al. (2010) TR, Lagasse at al. (2010)
WMCAUS 2018
IOP Conf. Series: Materials Science and Engineering 471 (2019) 022024
IOP Publishing doi:10.1088/1757-899X/471/2/022024
10
From the analysis of Figure 8, it can be seen that the prediction made with Melville-Dongol recommended equation is higher than the measured one and that the Melville-Dongol modified equation gives a better prediction since it fits better to the experimental results.
5. Conclusions
The present study focus on the effects of debris shape on the maximum scour depth at uniform single pier. It covers two different debris shapes. Experiments were run for clear-water flatbed uniform flow, in a rectangular channel whose bed is composed of uniform, non-ripple forming sand. From the previous discussion, it can be concluded that:
i) The shape and position of the debris accumulation have a strong influence on the final scour depth. Debris on the bottom, upstream of the bridge pier, with a triangular shape, act as a scour countermeasure, reducing in our experiments the maximum scour depth up to a 26%;
ii) The method suggested by [3], as modified by [7], performed well, replicating the main trends observed in the experiments;
iii) In the experiments, the influence of the relative submerged ratio of the debris on the scour depth, followed the trend observed previously by [9], with an increasing scour depth up to a critical value of the ratio, and then decreasing scour for ratios higher than this critical value. Nevertheless, such a trend was only evident when scour depths at the end of 168h were considered, which gives evidence that scour experiments of this type must be carried out over long time periods.
Acknowledgments
This work is supported with Portuguese national funds by FCT - Foundation for Science and Technology within the UID/ECI/04082/2013 project.
References
[1] S. Pagliara, and I. Carnacina, “Temporal scour evolution at bridge piers: effect of wood debris roughness and porosity,” Journal of Hydraulic Research, 48(1), pp. 3–13, 2010.
[2] M. S. Dongol, “Effect of Debris Rafting on Local Scour at Bridge Piers,” Report No. 473, School of Engineering, University of Auckland, Auckland, New Zealand, 1989.
[3] B. W. Melville, and D. M. Dongol, “Bridge Pier Scour with Debris Accumulation,” ASCE Journal of Hydraulic Engineering, 118(9), pp. 1306–1310, 1992.
[4] T. H. Diehl, and B. A. Bryan, “Supply of Large Woody Debris in a Stream Channel,” 1993 National Conference on Hydraulic Engineering, American Society of Civil Engineers, vol. 1, pp. 1055–1060, 1993.
[5] D. Lyn, T. Cooper, A. Rao, Y. Yi, and R. Sinha, “Debris Accumulation at Bridge Crossings: Laboratory and Field Studies,” Joint Transportation Research Program 10, pp. 2–59, 2003. [6] L. W. Zevenbergen, P. F. Lagasse, and P. E. Clopper, “Effects of Debris on Bridge Pier Scour”,
World Environmental and Water Resources Congress 2007, 2007.
[7] P. F. Lagasse, P. E. Clopper, L. W. Zevenbergen, J. W. Spitz, and L. G. Girard, “Effects of Debris on Bridge Pier Scour,” NCHRP Report 653, Transportation Research Board of the National Academies, Washington, 2010.
[8] P. N. D. Cicco, E. Paris, and L. Solari, “Flume experiments on bridge clogging by woody debris: the effect of shape of piers”, 36th
IAHR World Congress, The Netherlands, 2015.
[9] E. Rahimi, K. Qaderi, M. Rahimpour, and M. M. Ahmadi, “Effect of Debris on Pier Group Scour: An Experimental Study,” Journal of Civil Engineering, pp. 1–10, 2017.
[10] C. Sok, J. H. Park, and Y. D. Kim, “Experimental study on the effects of debris accumulation on bridge pier scour,” Korea Water Resources Association, 2013.
WMCAUS 2018
IOP Conf. Series: Materials Science and Engineering 471 (2019) 022024
IOP Publishing doi:10.1088/1757-899X/471/2/022024
11
[11] J. H. Park, C. Sok, C. K. Park, and Y. D. Kim, “A Study on the Effects of Debris Accumulation at Sacrificial Piles on Bridge Pier Scour: I. Experimental Results,” KSCE Journal of Civil Engineering, 20(4), pp. 1546–155, 2016.
[12] C. Fael, “Local scour at bridge abutments and countermeasures,” PhD Thesis, Portugal, 2007 (in Portuguese).
[13] G. Simarro, C. Fael, and H. Cardoso, “Estimating equilibrium scour depth at cylindrical piers in experimental studies,” Journal of Hydraulic Engineering, 137(9), pp. 1089–1093, 2011. [14] C. R. Neil, “Mean velocity criterion for scour of coarse uniform bed-material,” the 12th
IAHR Congress, 3(C6), pp. 1–9, 1967.
[15] H. N. C. Breusers, and A. Raudkivi, “Scouring, hydraulic structures design manual,” A. A. Balkema, Rotterdam, The Netherlands, 1991.
[16] F. Ballio, A. Teruzzi, and A. Radice, “Constriction effects in clear-water scour at abutments,” ASCE Journal of Hydraulic Engineering, 135(2), pp. 140–145, 2009.
[17] C. Fael, R. Lança, and H. Cardoso, “Effect of pier shape and pier alignment on the equilibrium scour depth at single piers,” International Journal of Sedimentation Research, vol. 31, pp. 244–250, 2016.
[18] E. V. Richardson, and S. R. Davis, “Evaluating scour at bridges,” 4th ed.: U.S. Department of Transportation, Federal Highway Administration, Hydraulic Engineering Circular 18, Publication FHWA NHI 01-001, 2001.