Department of Information Science and Technology
Constructed Response or Multiple-Choice for Evaluating Excel
Questions? That is the Question
Yolanda Vidigal Belo
A Dissertation presented in partial fulfillment of the Requirements for the Degree of Master’s in Computer Science and Business Management
Supervisor:
Doctor. Sérgio Moro, Assistant Professor, ISCTE - Instituto Universitário de Lisboa Co-supervisor:
Doctor. António Martins, Assistant Professor, ISCTE - Instituto Universitário de Lisboa
i
Dedication
To my dear parents, as Rick & Renner said: "Daughter wherever you go, there may not be a place for your parents, but we are sure that we will always be by your side wherever you go”. I make these words mine "I will be the one taking you wherever I go” _____________________________________ Aos meus queridos pais, já cantavam Rick & Renner “Filha onde você vai, pode não sobrar um lugar pro seus pais, mas temos certeza que vamos sempre estar perto de você onde quer que vá”. Faço destas palavras as minhas “Eu que vou vos levar onde quer que eu vá” …
ii
Acknowledgement
The biggest challenge besides writing this thesis, was having only one page to thank the people who took part on my two-year trajectory at ISCTE-IUL.
Thank you so much to my parents, who have always prioritized my education. Thank you, Mr. Belo and Mrs. Tilinha, for, besides offering me the opportunity to study abroad, you have always been present and patient, most of the time like my best friends than as my parents, and I am very grateful to God for that. My sisters Denise and Tainara, for always crying with me and encouraging me to overcome at this stage of my life, particularly for being away from home.
I express my gratitude to Professor Sérgio Moro, who guided this thesis, for his sympathy since our first meeting, for his full support, criticism and advice, but above all for his encouragement and help in achieving the project.
I thank Professors António Martins and Pedro Ramos for their trust and for being always available to answer my questions, providing me very significant pedagogical experiences.
To my colleagues Daniela Almeida, Sabrina Alves and Hugo Santos, among others, who were always present during this phase, for companionship, strength and support me in several difficult times.
Finally, to all who have been directly and indirectly involved, there is my great Khanimambo [Mozambican dialect meaning "Thank you"].
iii
Abstract
Evaluation plays a fundamental role in education, with a view to improve the teaching-learning process, which helps to identify factors that can contribute not only to the teacher in developing pedagogical methods and evaluation tools, but also to an academic evolutionary process of the student, and to achieve the objectives defined in the course or curricular unit.
In this dissertation project, it is proposed to develop explanatory models using Data Mining techniques and tools to predict the results obtained by students in performing Excel exams, more specifically, to verify if there is a difference in student performance when performing exams with Constructed Response questions and for exams containing Multiple Choice Question equivalent to the questions of the previous format. The samples were obtained in Advanced Excel exams performed at ISCTE-IUL, to verify the difference in the exams as stated before, and identify which factors influence this, extracting knowledge from them, and using them to decision making (to assist teachers improving the exams’ preparation, either by the format of the question or by the content of each one).
Using CRISP-DM methodology, the students' responses were organized in the data set, where it was used to construct 6 predictive models from regression techniques, such as support vector machines and neural networks (other identified during the research), and for training and tests errors calculations.
The results show that the SVM model is the one with better performance, indicating the MCQ format as the one in which the students are most likely to succeed.
Keyword: Essay questions, Multiple Choice Questions, Educational Data Mining,
iv
Resumo
A avaliação desempenha um papel fundamental na educação, numa perspetiva de melhorar o processo ensino-aprendizagem, pois auxilia na identificação de fatores que possam contribuir na elaboração de métodos pedagógicos e instrumentos de avaliação, e num processo evolutivo académico do aluno, atingindo os objetivos definidos na unidade curricular.
Neste projeto de dissertação, propõe-se desenvolver modelos explicativos usando técnicas de Data Mining para avaliar resultados obtidos pelos alunos na realização de exames de Excel Avançado, ou seja, verificar se existe diferença na performance do aluno ao realizar exames compostos por questões abertas e por exames com questões de escolha múltipla equivalentes às do formato anterior. As amostras foram obtidas em exames realizadas no ISCTE-IUL com o objetivo de além de se pretender verificar tal diferença nos exames, identificar quais fatores influenciam para que isto ocorra, e extrair conhecimento a partir destes, conduzindo-os à tomada de decisão (auxiliar os docentes na melhoria na elaboração dos exames, seja pelo formato da questão como pelo conteúdo de cada uma).
Seguindo a metodologia CRISP-DM, organizaram-se as respostas dos alunos dando origem ao data set que foi usado para a construção de 6 modelos preditivos a partir de técnicas de regressão, algumas como máquinas de vetores de suporte e redes neuronais (outras identificadas durante a pesquisa), e para cálculo de erros de treinos e testes.
Os resultados obtidos mostram que o modelo de máquinas de vetores de suporte é o melhor dos modelos construídos, indicando o formato de exame em múltipla escolha como aquele em que os alunos têm maior probabilidade de acertar.
Palavras-chave: Perguntas Abertas, Múltipla Escolha, Mineração de Dados
v
Index
Dedication ... i Acknowledgement ... ii Abstract ... iii Resumo ... iv Index ... vList of Tables ... vii
List of Figures ... viii
List of Abbreviations ... x
Chapter 1 – Introduction ... 12
1.1. Topic and Research Problem ... 12
1.2. Topic Motivation ... 13
1.3. Research Objectives and Methodology ... 14
1.4. Structure and Organization of the Dissertation ... 15
Chapter 2 – Prior Literature ... 16
2.1. Teaching and Academic Evaluation ... 16
2.2. Bloom’s Taxonomy Applied to Evaluation ... 17
2.3. Constructed Response versus Multiple Choice Questions ... 19
2.3.1. Constructed Response ... 20
2.3.2. E-Learning ... 21
2.3.3. Multiple Choice Questions ... 22
2.3.4. Constructed Response versus Multiple Choice Questions: where do they differ? ………...23
2.4. Teaching and Excel Learning ... 26
2.5. Data Mining and Knowledge Extraction ... 27
vi
2.5.2. Data Mining Methodologies ... 29
2.5.3. Methods and Techniques of Data Mining Modeling ... 33
2.5.4. Mining Educational Data ... 37
Prior Literature - Conclusions ... 39
Chapter 3 – Methodology ... 41
3.1. Business Understanding ... 41
3.2. Data Understanding ... 42
3.3. Data Preparation ... 50
3.4. Modeling and Evaluation ... 56
3.5. Project Development ... 58
Chapter 4 – Results and Discussion ... 60
4.1. Results and Evaluation ... 60
4.2. Discussion ... 80
Chapter 5 – Conclusions ... 82
Chapter 6 – Limitation and Future Research ... 84
References... 85
Annex and Appendices ... 89
Appendix 1: Excel Functions and Formulas ... 89
Appendix 2: Features Description ... 90
Appendix 3: Class and Course Attributes ... 94
Appendix 4: Bloom´s Taxonomy Categories and Verbs ... 96
Appendix 5: CR and equivalent MCQ examples/ Question Difficulty ... 98
vii
List of Tables
Table 1: Data Mining Techniques and Tasks ... 34 Table 2: Attribute Analysis ... 51 Table 3: Metrics Analysis ... 62
viii
List of Figures
Figure 1: Bloom's Taxonomy. [Adapted from: Using a Learning Taxonomy to Align Your
Course] ... 18
Figure 2: KDD Processes. (adapted Quintela, 2015)... 29
Figure 3: CRISP - DM Phases ... 30
Figure 4: CRISP - DM Phases and Tasks ... 31
Figure 5: SEMMA Methodology (source: Ohri, 2013) ... 32
Figure 6: Data Mining Methods and Techniques. Adopted in (Quintela, 2005) ... 33
Figure 7: ExamPeriod Frequency in Percentage ... 43
Figure 8: ExamVariant Frequency in Percentage ... 44
Figure 9: Gender Frequency in Percentage ... 45
Figure 10: Schedule Frequency in Percentage ... 45
Figure 11: Status Frequency in Percentage ... 46
Figure 12: Course Frequency in Percentage ... 46
Figure 13: Difficulty Frequency in Percentage ... 47
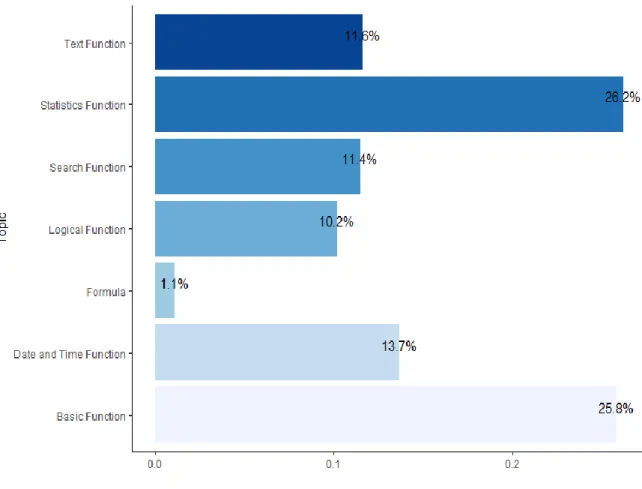
Figure 14: Topic Frequency in Percentage ... 48
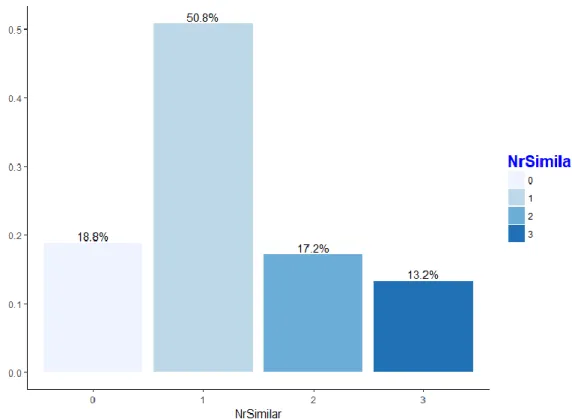
Figure 15: NrSimilar Frequency in Percentage ... 49
Figure 16: AnsweredCR Frequency in Percentage ... 50
Figure 17: ScoreDifference Boxplot with Outliers... 55
Figure 18: ScoreDifference Boxplot without Outliers ... 55
Figure 19: Modeling Evaluation Approach. [Source: Silva et al. (2018)] ... 56
Figure 20: Holdout and K-fold Process ... 58
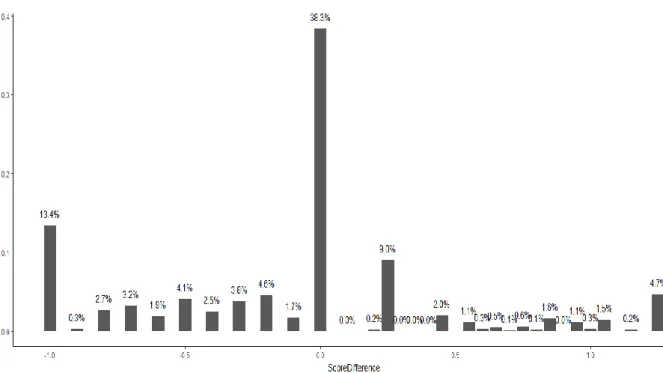
Figure 21: Score difference in absolute values ... 60
Figure 22: Score difference in real values ... 61
Figure 23: Data set excerpt illustrating both ScoreDifference ... 61
ix
Figure 25: Attributes Relevance ... 64
Figure 26: NrCharacterTextCR and ScoreDifference ... 65
Figure 27: Topic and ScoreDifference ... 65
Figure 28: NrWordTextMCQ and ScoreDifference ... 66
Figure 29: Probability of NrWordTextMCQ ... 67
Figure 30: NrWordTextCR and ScoreDifference ... 67
Figure 31: NrCharacterTextMCQ and ScoreDifference ... 68
Figure 32: AnsweredCR Probability ... 69
Figure 33: AnsweredCR proportion by ScoreDifference ... 69
Figure 34: BloomLevelMCQ and ScoreDifference ... 70
Figure 35: BloomLevelCR and ScoreDifference ... 71
Figure 36: NrDistractors and ScoreDifference ... 72
Figure 37: NrDistractors Probability ... 72
Figure 38: NrSimilar and ScoreDifference ... 73
Figure 39: Schedule and ScoreDifference ... 74
Figure 40: Course and ScoreDifference ... 75
Figure 41: ScoreDifference proportion per Course and Difficulty... 76
Figure 42: Difficulty and ScoreDifference ... 77
Figure 43: ScoreDifference proportion per AnsweredCR and Difficulty ... 78
Figure 44: Gender and ScoreDifference ... 79
x
List of Abbreviations
BI Business Intelligence CR Constructed Response
CRISP – DM Cross Industry Standard Process for Data Mining
DM Data Mining
DSA Data-Based Sensitivity Analysis
DT Decision Trees
ICT Information and Communications Technology K-NN K-Nearest Neighbors
KDD Knowledge Discovery in Databases MAD Mean Absolute Deviation
MAE Mean Absolute Error MCQ Multiple Choice Questions MED Mining Educational Data MLP/MLPE Multilayer Perceptron
MSA Measurement System Analysis MSE Mean Squared Error
NB Naive Bayes
NN Neural Network
REC Regression Error Characteristic
RF Random Forest
RMSE Root Means Squared Error
RSC Regression Scatter Plot Characteristic SEMMA Sample, Explore, Modify, Model SSE Sum Squared Error
xi TF True/False
12
Chapter 1 – Introduction
1.1.Topic and Research Problem
Assessment is essential in education to evaluate the acquired knowledge when dealing with problems, questioning and reflection on action (França & Amaral, 2013). Therefore, it plays a fundamental role in promoting learning, producing information that can help students and teachers. Thus, assessment is not merely an instrument of certifying learning but one which acts directly in the process of teaching and learning, permeating it and aiding it as if it was an activity at any one moment (Cerny, 2001 cited by França and Amaral, 2013).
It should be noted that the evaluation of student learning is one of the critical components of the educational process. If it is used in an appropriate way, it can be a decisive factor for achieving the objectives of the subject, or even of the course. Otherwise, it may put at risk any efforts to innovate and improve the quality of pedagogical methods and techniques, since the tests on the one hand are a source of motivation and evaluation, on the other, students will tend to study only what they believe will be asked in the tests (Camilo & Silva, 2008).
Thus, there are several test models, from the most traditional paper-based ones up to electronic format (using computer materials), composed by questions requiring Constructed Response (CR) where questions are directly asked, also called essay questions/ open questions/ open ended and for Multiple Choice Questions (MCQ) with the presence of several alternatives with only one of them is correct, in true-false format, open space and so many other ways to express this type of test format.
Nowadays, many teachers tend to pass assessments on paper, using Constructed Response (CR) to electronic platforms using Multiple Choice Questions (MCQ) as a means of evaluation, highlighting the central problem of this study: when students use MCQ, do they obtain the same results (identical) as CR? So, if the results are not identical, what would be the reasons to explain this discrepancy? These questions compose a sample of tests from the academic year 2016/2017, carried out on the curricular unit of Advanced Excel of ISCTE-IUL.
For example, Kuechler and Simkin (2003) consider that, since most teachers have a greater preference for CR over MCQ, the fact is that students with a high level of
13 performance in the subject must assess the questions themselves, a task which is more protracted than MCQ which requires more subjectivity (Zeidner, 1987, cited by Kuechler and Simkin, 2003). If students’ responses to MCQ correlate with CR results and such a relation is sufficiently high, lecturers may conciliate both methods, opting for MCQ, should they so choose, for example in exams in which there is a high number of students in the group, and the questions are easy to classify, and results can be given equitably.
On the other hand, it is necessary to question how converging is the commitment of the student in MCQ in relation to the commitment of CR. For these and other reasons, for many years researchers have tried to respond to these types of questions, in a way to take advantage of the teaching-learning process in its entirety, both for students as well as teachers.
1.2.Topic Motivation
Teachers in academic institutions can use a large variety of testing methods to assess the student concerning the topics in the course or the key curricular unit, including MCQ, CR, filling in in blank spaces, essay question or experimental and observations methods (Miranda, 2015). This author also considers that, usually, tests and/or exams tended to be composed just of CR, so that students created their own answers, instead of selecting the correct answer from a set of alternatives offered; however, currently the scenario is different, with some tests being composed of both models for questions, others only of MCQ.
As previously stated, in using MCQ, would the results be the same, or would there be any difference with the results obtained from assessments done by CR? Still working with the same analogy, would it be possible for a teacher to measure objectively the learning of his students if the choice of one method or another (on the same content), and would it have an impact on the involvement of the students and on the results at the end of the assessments?
In fact, concerning the quality of the assessments, the formulation of questions, the pedagogical quality of the teacher and all the factors involved in the teaching-learning process, there would be a greater flexibility if the teacher had help in the choice of one of
14 the testing methods, if the model chosen is adapted to the intended evaluation technique and stimulates the part played by students, whether in CR or in MCQ.
1.3. Research Objectives and Methodology
The choice of the research theme to be elaborated revolves around the following investigative question to be answered as the work progresses:
Is there a difference in assessing by CR or MCQ on the same subject in terms of the results performed by the student? That is, in using Multiple Choice Questions (MCQ), do students obtain the same (or similar) results to those obtained by Constructed Response (CR)? And if these are not identical, what are the reasons that can explain this divergence? This question is associated to a generic objective analyzing to what point there is a discrepancy in the performance of students assessed by MCQ and by CR in the same content. Still on this objective, the following tasks are highlighted:
• Measure the existing discrepancy between the results obtained by students from CR and MCQ tests;
• If necessary, explain the possible reasons that may have influenced the existing discrepancy.
For obtaining of results and optimizing research, the samples’ data will be analyzed using Data Mining techniques (this method will help the execution of the first task previously described). The intention is to obtain an explanatory model that illustrates the presence of variables relevant to the study, the implication of each one of these in the results obtained, and to confront similarities and differences in the two assessment methods, and with the aid of revision of the literature, one will be able to reach the second task associated with the principal objective.
Therefore, to validate the study, the results are presented using Data Mining techniques from data collected from a sample of 300 Excel Advanced assessment tests in which 50% are open and 50% are MCQ carried out at ISCTE-IUL. The questions are paired, that is, a topic of the subject is used in the two assessment methods in the same test.
15
1.4. Structure and Organization of the Dissertation
The present study is organized in four chapters that aim to reflect the different phases as far as their conclusion.
The first chapter introduces the theme of the investigation and contextualization of the problem, the motivations and relevance of the research, as well as the description of the objectives and corresponding methodology.
The second chapter reflects the theoretical context, designated revision in the literature, involving the synthesis effected from the researched literature, grouping the theme with its respective involving aspects, from a vision of teaching and academic assessment in a general sense, followed by the educational objectives of Bloom, details related to CR and MCQ, while certain concepts related to teaching will be explained, creating a bridge with that learnt using an Excel Spreadsheet. Afterwards, study cases related to the same theme of the present research will be approached, ending with a theoretical approach to the concepts of BI, Data Mining and respective application techniques and modulation of data.
The third chapter is dedicated to the Methodology used in the process of gathering and treatment of data, obtaining results, description of research cases and of all the work done, as well as the tools and techniques used.
Finally, the verification of results obtained during the study carried out, the conclusions that can be arrived at, and what the pertinent questions are, limitations and contributions of the dissertation and a declaration of the starting point for future projects.
16
Chapter 2 – Prior Literature
2.1. Teaching and Academic Evaluation
In the last decades, there has been an increase in the student population at all levels of education, and with this, educational problems related to the high number of pupils are common in several geographical areas, which does not dispense the university level as well. Solutions to these problems have been sought through diversified education systems, whether by individualized teaching or by group teaching. Related to these systems and their constant changes and updates, we find the evaluation, which can be from a set of methods to test performances, promote learning or even add grades to students (Buchweitz, 1975).
Starting from “Guia De Elaboração E Revisão De Questões E Itens De Múltipla Escolha (2011)1”, learning is a cognitive process, inherent to the human being, but not
observable directly. To evaluate it, it is necessary to have visibility, being one of the roles of assessment instruments, such as school tests, which act as stimulants whose function is to provoke responses that are the expression of learning and manifestation of the knowledge and skills that constitute it. In fact, knowledge assessment is an important aspect of the educational process to determine the extent to which learning outcomes are achieved (Čandrlić, Katić, & Dlab, 2014).
However, it is important to consider the clear and structured definition of educational objectives, since the acquisition of knowledge and skills appropriate to a professional profile to be acquired should be directed from a teaching process with adequate choices of strategies, methods, delimitation of specific contents, assessment tools, and consequently it will lead to effective and lasting learning (Ferraz & Belhot, 2010).
As a result, will it be possible to plan an evaluation and its set of objectives so that the result reflects something more than a simple memory of what is written in the manuals or was mentioned in the classes? To answer this question, it is necessary to know which the highest thought processes are, as well as the specific measurement methods of these
1 Manual available in http://www.adventista.edu.br/_imagens/area_academica/files/guia-de-elaboracao-de-itens-120804112623-phpapp01(3).pdf
17 processes that can be evaluated in the school environment (Pinto, 2001). This requires a typology of processes and objectives of learning, among the several, it stands out that the greater of the academic contribution to educators over time, is the Bloom Taxonomy (Ferraz & Belhot, 2010).
2.2. Bloom’s Taxonomy Applied to Evaluation
Bloom’s Taxonomy is one of the instruments to help the identification, declaration and control of educational objectives linked to a set of processes from the acquisition of knowledge, skills and attitudes, to the planning of teaching and learning, although few educators take the maximum advantage of this tool because they do not know an appropriate way to use it (Ferraz & Belhot, 2010).
In fact, it proposes a more effective way for educators to dominate their abilities/capacities and to draw strategies from the simplest to the most complex ones, aiming that the student also acquire specific skills or to be required without distancing himself from the previously proposed instructional objectives (Ferraz & Belhot, 2010). They also consider that, although the three domains (cognitive - encompasses intellectual learning, affective - related sensibility and values, and psychomotor - skills of performing tasks that involves movements and actions) have been widely discussed and disseminated by several researchers, the cognitive domain has been the best known and used when addressing issues related to teaching and evaluation.
However, Bloom’s Taxonomy suffered some revision (despite being used for four decades) in 1999 by Anderson (2001) cited by Ferraz & Belhot (2010) and his collaborators, who made a retrospective to the original version, changing some existing categories and maintaining a balance with the new positions declared, as you can see in Fig. 1, the levels organized in hierarchy.
18
Figure 1: Bloom's Taxonomy. [Adapted from: Using a Learning Taxonomy to Align Your Course]2
In this case, in the view of Salume et al. (2012) this taxonomy is intended not only to be a classification of the behavior expected by the students, as they must think, feel or act, but also brings with it other advantages according to Ferraz and Belhot (2010), such as:
• Provide a basis for the development of differentiated assessment strategies and instruments, stimulating students’ performance and their acquisition of knowledge;
• Encourage educators on helping their students in a structured and consistent way, the process of acquiring specific skills linked to their simpler skills and transition to the most complex domain.
Note that, related to the taxonomy categories, the first four Bloom´s objectives (knowledge, understanding, application and analysis) can be applied in MCQ format exams, while the last two (synthesis and evaluation) would be better evaluated in essay questions format, not discarding the possibility of being also indicated for the previous objectives (Gronlund, 1998, cited by Salume, et al. 2012) (see appendix 4 for more details).
2 Available in: http://www.ucdenver.edu/faculty_staff/faculty/center-for-faculty-development/Documents/tutorials/Assessment/module2/index.htm
19
2.3. Constructed Response versus Multiple Choice Questions
Evaluations by CR and MCQ are particularly included in a teaching - learning process in which a student is submitted throughout the school process.
Generally, CR have been the preference than MCQ by several educators, based on the belief that the first method measures a greater number of skills (and even the most important) on students’ comprehension and ability to apply their knowledge, while MCQ reflects less cognitive aspects regarding the application of knowledge and the art of producing a response according to Chan and Kennedy (2002), although there is a frequent illusions on students in choosing MCQ than CR because they find it more "easy" to solve. However, these can become complex, for example, when the number of alternatives is higher and the distractors very similar to each other.
MCQs are usually referred to as "objective" tests, although the purpose of these tests is limited only to correction systems that are quite reliable in relation to alternative systems that can be done "mechanically" (Pinto, 2001). These differ in their most common type of presentation: questions with 3 to 5 options (only 1 correct); paired items; double choice TF items (true / false); questions with spaces to complete, and much more. Particularly in this study, the form used by the samples are the questions with 4 options.
While the CR consisting of a set of tests, in the form of a question or statement, the student is asked to answer in writing by evoking knowledge and proceeding in greater or lesser degree to an analysis, description, explanation, comment and synthesis of a content, topic or subject (Pinto, 2001). Note that the number of cognitive skills is greater and memory recall by evocation can be also more complex and difficult, for example, in daily tasks it is easier the familiarity of a face and a voice than the memory of the person´s name (Pinto, 2001). Pinto (2001) also considers that a MCQ test is apparently a simpler task by making an analogy to the simple recognition of people, beings, objects, and events whose familiarity or lack of it is soon detectable.
Therefore, it is necessary to describe and analyze in more details the advantages and disadvantages of one type of evaluation in relation to the other, that is, multiple choice evaluations regarding the alternative for constructed response.
20 2.3.1. Constructed Response
CR brings an indirect benefit, since its content can provide suggestions to teachers about what is important to teach and to students about what it is important to learn, according to Lukhele, Thissen, and Wainer (1994). In fact, stimulation for organization and cooperation, propitious environment for comments, clarifications, examples and explanations that allow content analysis and interpretation, are some beneficial aspects of CR. In this case, the student only produces a response (instead of selecting an option from a set of items), whether short, explanatory, filling some blank spaces, represent graphs, among others, although in some cases there is difficulty in expressing the correct information to be provided to the examiner.
However, even for Lukhele, Thissen, and Wainer (1994), many students dislike open-ended assessments, since they require a high level of skills to organize, framing responses, formulate ideas, knowledge about the subject area, and finally, a convincing answer that correctly expresses what is questioned and that does not leave the subject, although, giving a wrong or not so convincing answer, the examiner can deduce the score of the question. In this sequence, there is no clear standard of possible answers, and there is great difficulty in interpretation and subjective compilation by the teacher (because they consume more time to be analyzed in relation to the MCQ), then the CR carries limitations to ensure a uniform and quality evaluation, especially if there are several teachers.
Also, another disadvantage of CR is related to the fact of the large amount of time needed to elaborate and classify, thus adding a cost to the examiner’s time and effort according to Simkin and Kuechler (2005). In the opinion of Hickson and Reed (2009), although the evaluation of the student’s answers in CR may consume time to the examiners, they should not be neglected, since it is possible in this way measure the understanding of the subject and the students’ abilities to solve some types of problems and express ideas in writing.
In this way, according to Čandrlić, Katić, and Dlab (2014) with online tests, there has been a transition from evaluations on paper - based and using Constructed Response, to electronic platforms using Multiple Choice Questions tests as their evaluation tools, returning to the problem of this research, being necessary understand first how the
21 electronic platforms teaching, or evaluating, and what repercussions or advantages they will have on student learning.
2.3.2. E-Learning
Information and Communication Technologies (ICT) raise challenges and at the same time offer to the teachers numerous tools that allow the creation of differentiated learning opportunities for students as reported by Azevedo (2017). Concerning the use of ICT in the evaluation process, this author considers to be an added value, in which they are used throughout the evaluation process from the design of the tests to the correction and storage of the results, through the electronic format/e- assessment, where the application of MCQ (despite portfolios or discussions) is verified.
Furthermore, a major advantage of e-assessment is the automatic correction that makes work easier for teachers (Hickson & Reed, 2009), obtaining privilege in relation to CR in teacher’s involvement as stated above. On the other hand, this form of evaluation carries with it the guarantee that the tests are fair and do not harm the student in the evaluation process, when it comes to the scoring factor for example. In contrast, Čandrlić, Katić, and Dlab (2014) also adds the fact that the subjective factor of the teacher plays a crucial role in the evaluation of the answers coming from CR, since it has the possibility to evaluate this as partially correct or to identify the "hidden knowledge" in the given answer, although it suggests a form of combining online tests with the at least 30% of subjective questions.
A research based on the analysis and comparison of results based on traditional paper and online tests that the students solved in computer held in the Department of Informatics of the University of Rijeka by Čandrlić, Katić, and Dlab, (2014), had the objective to determine if and which online tests can replace the traditional paper-based ones. Using a model based on MudRi, objective and subjective (test and short answer) questions were used in evaluations in the courses of Data Modeling, Process Modeling and Information Systems, in which the results obtained for the first two courses were that, there was no significant difference in the mean values of both types of tests, whereas for the last course (consisting only of objective questions), the scenario was different, with better results in the tests performed online. Consequently, it was concluded that online tests can replace
22 traditional paper-based tests to assess student knowledge but giving special attention to their composition.
By choosing the questions that will be used in an e-assessment test, the teacher can define a fixed set of questions, allowing the system to randomly choose items from a category or combination of several, being appropriate grouping by chapter, difficulty of question, or other criteria (Hickson & Reed, 2009).
Considering the above, E-Learning systems must be based on objective answers due the limitations described and the researches performed until then, giving rise to the evolution and increasing use of the multiple-choice questions (MCQ).
2.3.3. Multiple Choice Questions
The use of MCQ dates to the beginning of the 20th century, with Azevedo (2017) stating that even before the existence of the e-assessment, in which the objective was to reduce the ambiguity and consequent differentiation in the evaluations made by the teachers for the students. Since then, these have been gaining space in research fields, bringing with them advantages in relation of the limitation on the use of CR in terms of objectivity and consistency.
In this follow-up, Xu, Kauer, and Tupy (2016) in their research showed that there are ways to optimize the construction and use of MCQ to benefit the instruction and assessment in classrooms, learning and student performance, and yet using instructor’s time and energy more efficiently.
In addition, the use of MCQ in the format of evaluations, are easy to apply and analyze because they do not require elaborate student responses as it happens in the CR, they offer quick response (depending on the degree of difficulty of the question), present several options that ends on assisting the student in choosing the best alternative through a process of eliminating alternatives that do not seem very satisfactory until it is only approximately one correct, and consequently can be objectively registered and classified by the teachers. However, concerns about academic dishonesty are common in these cases in relation to CR, since it is simpler for students to copy responses (from another student, book, or online resource), but this problem can be reduced by using alternative forms of testing, with variants, paired questions, alternating seats (if the test is realized in the classroom), among others, as reported by Xu, Kauer, and Tupy (2016). Sometimes there
23 is not only a limitation in the expression of ideas and concrete and ideal solutions, but also these kinds of questions are susceptible to guessing.
Therefore, in addition to its ability to evaluate appropriate cognitive capacities, any assessment tool should be able to withstand content examination and build validity, reliability, fidelity, and at the same time discriminate the student’s performance levels. Thus, a well-constructed, peer-reviewed MCQ is suggested to meets multiple educational requirements and is, above all, is considered a serious format to evaluate student (Palmer & Devitt, 2007).
There have been many discussions recently about the best choice for evaluation method, by CR or MCQ, in which the latter is preferred, in cases where, for example, the damage in the CR process is considered for both students and teachers. In fact, if there is an anticipation of which objectives an evaluation wants to achieve, whether by CR or MCQ, dealing into its advantages and disadvantages, both methods are effective, but the latter is still preferred because it provides greater objectivity to an evaluation and making it trustworthy.
2.3.4. Constructed Response versus Multiple Choice Questions: where do they differ?
In educational literature research on MCQ versus CR appears in the form of various debates generating controversy from the results of assessments that contain MCQ while for other students obtaining more positive results when they undergo assessment by MCQ, and finally authors that defend traditional CR, tending to show greater capacity of knowledge in relation to the previous.
On the one hand, comparing the results of categories MCQ and CR in the point of view of Simkin and Kuechler (2005), there is difficulty in constructing MCQ that reach a high level of learning in relation to the CR when referring to the level of application of Bloom’s Taxonomy. In addition, his research concludes, the results tend to be positive in MCQ if these are developed around the understanding of the level of taxonomy, and CR respectively for a higher level as well as for application to higher levels. On the other hand, according to Martinez (1999); Hancock (1994) cited by Simkin and Kuechler (2005), and Kastner and Stangl (2011), CR and MCQ measure the same level of knowledge only in the first four dimensions of the taxonomy (knowledge, understanding,
24 application and analysis), the difference being revealed in the last two categories, in which the degree of difficulty is greater.
In this point of view, Miranda (2015) also sought to analyze test formats, comparing MCQ to CR in computer and paper on the performance and satisfaction of a sample of 31 students of the Universidade Federal de Goiás coursing Administration. Therefore, the results that showed the differences between the means of presentation (by computer and paper) are small, but between the formats (MCQ and CR) is evident, presenting the best results in favor of the format of MCQ performed in paper followed by the MCQ computer model.
According to the empirical studies of Hickson and Reed (2009), using a set of data compiled from Introductory Microeconomics and Introductory Macroeconomics classes in the years 2002-2007 with approximately 8400 students, the CR does not measure the same as the MCQ, because for these authors, the student’s performance in a subsequent exam in the same course, and the academic performance in other courses, are factors that influence significantly so that there is a difference in the results obtained by CR and in MCQ, since the CR provide extra information to the student’s perception, as well as in the correction for the teacher that is not contained in MCQ for example. In the same way as Čandrlić et al. (2014) and Pinckard et al. (2009) cited by Mullen and Schultz (2012), these authors also propose the combination of CR components with those of MCQ to achieve better results and a deeper learning than just evaluations performed only in MCQ. Sheaffer and Addo (2012) conducted a research on the Pharmaceutics II Course at the Bernard J Dunn School of Pharmacy at Shenandoah University, with the object of measuring and comparing the performance of students in CR and MCQ in exams done in this course, being possible, on the one hand, to conclude that they responded more accurately to MCQ in relation to CR (77.4% vs. 70.4%) and they felt more confident respectively, and on the other hand, that there must be other methods and techniques that can be added to the previous CR, in such a way as to improve learning in pharmacy education.
The work of Chan and Kennedy (2002), on data collected from the two types of exam done by 196 students, using the t-statistics method on expected difference, concluded that students have higher results in MCQ than in the equivalent assessment by CR and, in an
25 unexpected difference, they measure the same. It is important to stress here that the main conclusion was that for certain types of MCQ, students have better results than those in the equivalent CR, even if the adjustments have been done by guesswork, memory or deduction.
However, Buchweitz (1975), in his studies, compared the results of MCQ with those of CR applied to the students of the General Physics course in UFRGS, concluding that there is no significant difference between evaluating by the first type or the other. Initially, the comparison of the results of the average of the tests was performed using the t-test (Spiegel, 1971 cited by Buchweitz, 1975), because the population presented a normal distribution, concluding from the studies, that there was no difference in the evaluation method has said previously for all educational levels described by Bloom’s Taxonomy, although considering a level of significance below 1%, the difference of the means tends to increase in favor of the MCQ and finally, both types of questions are considered good instruments of different levels of behavior and learning in General Physics. Additionally, similar studies that consider that there is no difference between CR and MCQ, or even if they evaluate the same were performed by Ackerman and Smith (1988); Van den Bergh (1990); Wainer and Thissen (1993) cited by Kastner and Stangl (2011).
It also happens to the conclusions of the Kastner and Stangl (2011) survey at the Vienna University of Economics and Business in order to compare the CR and MCQ tests using three different scoring rules, such as NC (Number Correct - only correct responses are counted while incorrectly ignored, NA (All-or-Nothing) and US (University Specific - subtracting a of each false alternative) and aided by the FACETS software and the MFRM approximation, the results indicated that both tests are equal, that is, they measure the same thing when it is considered the NC rule, since it does not penalize the wrong answers and considers them to be partially correct, which does not happen with other rules, so CR tests can be replaced by MCQ in these cases.
Given the above, there seems to be no consensus as to the best method to best assess the student’s learning, considering the opinions of each author supported by his research, particularly this research, which aims also to measure the distance between the types of questions; the samples are based on Excel Advanced assessment tests in which 50% of the questions are open and 50% are MCQ, being necessary therefore an exposition on this type of teaching material.
26
2.4. Teaching and Excel Learning
Spreadsheets are commonly used, whether in accounting, health, marketing or in areas requiring a little more programming, such as engineering, which include a set of design activities, documentation, debugging, testing, maintenance, storage and qualities (Maresca, 2016).
Maresca (2016) also adds that the most commonly used calculation tool every day is Microsoft Excel, although its users only use a fraction of the many Excel features, it has a very strong impact on the way companies apply in their business.
As an example, the work of Nossa and Chagas (1997) focused on the usefulness, efficiency and effectiveness of the linear programming technique demonstrating with practical examples of different situations in the daily life of professionals in Accounting for decision-making purposes, as these can benefit this technique especially when associated with the use of spreadsheets, specifically the use of the "SOLVER" MS Excel feature.
Thus, in an educational formation that involves a combination of practical knowledge and abstraction, using the computer and Excel, Silva (2009) states that there is a contribution to the establishment of an educational process that allows both the student to understand about the importance of knowledge as a new process of evaluation that allows the replacement of calculator, paper, pencil, pen and other materials, where the student faced with situations and problems, will learn to develop strategies that acquire spirit to research, experiments , data organization, systematization of results, validation of solutions as well as the expansion of new knowledge.
For example, Denari, Saciloto, and Cavalheiro (2016) in their article, evaluate Excel as a teaching tool in the discipline of Qualitative Analytical Chemistry for higher education students using calculations of concentrations of species in equilibrium in acid solutions, with the intention to observe some form of learning, where the students criticize the data and correlate it with the graphs also generated by the spreadsheet and other computational forms. In a critique and repetition process, where the graphs with conceptual or formal errors were returned for correction, the authors noticed a significant improvement at each iteration, and then arriving at the conclusion that Excel proved to be
27 a motivating software for the content of the subject and an alarm clock for learning interest in students, although it is little used in teaching.
According to Cherinda (2016), on a survey carried out to a group of students about satisfaction with the use of the Excel tool, they realized that the tool has many functionalities that allow them to manipulate formulas, identify variables, and managing academic work. Nevertheless, for a sample that did not have a conscience of the potentiality of Excel, these students confirmed by the questionnaire that they were developing positive attitudes regarding the model and form of learning in the course in which they were enrolled, more concretely, in the Mathematics and Statistic calculations. In this perspective, Cymrot (2006) used Excel to analyze students’ understanding of content, learning and ease of calculation in the discipline of Statistics for Engineering II by using some statistical techniques commonly used in the Six Sigma quality management program, such as Multiple Regression, Statistical Quality Control, Measurement System Analysis (MSA) and Factorial Experiments, concluding that there is no difference in the learning of these techniques, considering the use of Excel as imperative, but the latter demonstrated a different behavior, dissociating from the rest. However, students consider it important to use Excel in the topics covered by making calculations easier.
2.5.Data Mining and Knowledge Extraction
2.5.1. KDD Process and Data Mining
Since the earliest times, from the massive use of paper to the present day in the age of digitization, companies have large amounts of data and information, stored either physically (as the first scenario) or as using (devices, tools, software, etc.). Quintela (2005) believe that, the process of extracting information and knowledge, to create new strategies and to continue business operation, consequently to decision-making, an aspect that has been considered an essential element of BI. Thus, the term BI is commonly defined as a process of collection, organization, analysis and all other information management that supports the organization’s business, and since there may be scenarios with an immense amount of data, where the Data Mining arises (as a step of the KDD) to make this process efficient.
28 The terms KDD and Data Mining are confused in some literatures, described as being synonymous, but most of them points to Data Mining as one of the activities of the KDD, since the first one is related to a robust process of development of methods and techniques that help in the extraction of knowledge, while the DM phase encompasses the process of data visualization, with the objective of automatically inferring models and rules that have an implicit knowledge of the data studied (Quintela, 2005).
In this sequence, Thomé (2017) consider also that Data Mining as an activity of the KDD, and by the latter being known as interactive, involving several loops within a same stage and going through phases until a result is concluded, there is a need to graphically represent and describe all KDD steps including Data Mining, always remembering the distinction between the two terms.
According to Quintela (2005), these are the phases of KDD process (see Fig. 2): • Selection: where there is a collection of useful data after a definition of the
purpose and objectives of the work;
• Pre-processing: the whole process of transforming the data, eliminating the noise, omissions, errors, etc.;
• Transformation: identification of variables with greater value, as well as modification of the same in a way that becomes important;
• Data Mining: selection of appropriate methods and algorithms to extract data patterns;
• Interpretation and Evaluation: by visualization of the knowledge, and aid of graphs/ diagrams or another form of representation, make possible its interpretation, and evaluation, finishing the goal or initiating a new iteration.
29
Figure 2: KDD Processes. (adapted Quintela, 2015)
2.5.2. Data Mining Methodologies
Currently, there are two main Data Mining methodologies: CRISP-DM (Cross Industry Standard Process for Data Mining) and SEMMA (Sample, Explore, Modify, Model) as the methodologies in which projects in this area have been most developed (Nogueira, 2014 cited by Almeida, 2017), which aid in organizing phases to achieve results, since the DM has an iterative life cycle, and its phases do not have a rigid sequence, only dependent on the result of each phase.
30
CRISP-DM
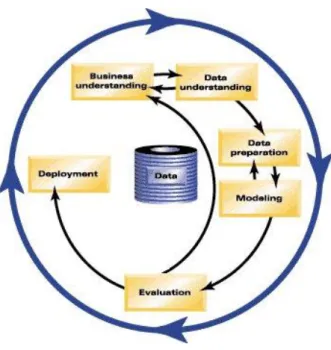
The CRISP-DM is a model that has iterative processes, of non-mandatory sequence, having also a life cycle (Fig.3), which occurs in the phases that have their tasks respectively (Fig. 4).
Figure 3: CRISP - DM Phases3
31
Figure 4: CRISP - DM Phases and Tasks4
The first phase of this methodology, according to Quintela (2005), is Business Understanding, which seeks to understand the objective to be reached with the DM and serves as a starting point for next phases. Next, Data Understanding, identifying the relevant data for the case, which problems exist and formulation of hypotheses. It follows, Data Preparation, which involves the cleaning of the data, combination of these and treatment of errors, in short, the production of the dataset to be used. The Modeling phase, involving the modeling techniques according to the initially defined objective. Then the Evaluation of the results obtained, where several graphical tools assist in the visualization process, and finally Deployment to produce reports and turning knowledge accessible to the others involved in the process.
4 Adapted in: https://decisionstats.com/2013/04/10/visual-guides-to-crisp-dm-kdd-and-semma/ •Determine Business Objectives
•Assess Situation
•Determine Data Mining Goals •Produce Project Plan
Business Understanding
•Collect Initial Data •Describe Data •Explore Data •Verify Data Quality Data Understanding •Select Data •Clean Data •Construct Data •Integrate Data •Format Data Data Preparation
•Select Modeling Technique •Generate Test Design
•Build Model Parameter Settings •Assess Model
Modeling
•Evaluate Results •Approved Models •Determine Next Steps Evaluation
•Plan Deployment
•Plan Monitoring and Maintenance •Produce Final Report
•Review Project Deployment
32
SEMMA
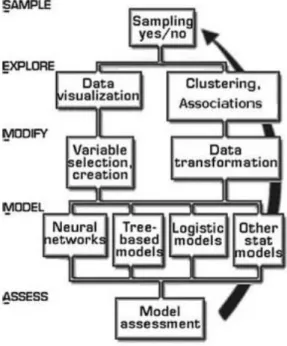
The SEMMA methodology, developed by the SAS Institute (which defines DM as the process of extracting valuable information and complex relationships from large volumes of data), divides the DM process into 5 stages in which the nomenclature composes the SEMMA acronym: Sample (step where a sample is selected, which corresponds to the subset of data belonging to a universe in which the assumptions of completion of each element must be the same), Explore (exploitation of data with the help of techniques, the search for trends unforeseen and anomalies on data), Modify (transformations necessary to correct the anomalies of the previous phase), Model (according to the defined objectives and the results expected to be achieved, Data Mining techniques are applied), and Assessment (evaluation of the model performance, presentation of the test results in the data and completion of all work done), which correspond to a cycle, where internal tasks are performed repeatedly until the objective is verified (Quintela, 2005).
Figure 5: SEMMA Methodology (source: Ohri, 2013)
In this work, CRISP-DM was chosen as the model because it is considered one of the most used and widely accepted methodologies, as well as an extensive literature available on the model (e.g., Moro et al. 2011).
As stated by Quintela (2005), there is no universal Data Mining model that efficiently solves all problems (Harrison, 1998 cited by (Quintela, 2005)). The choice of an
33 algorithm is somehow an art (Fayyad et al, 1996 cited by (Quintela, 2005)), since there are different models for the same tasks of DM with intrinsic advantages and disadvantages, and it is necessary to choose the techniques according to the objective of Data Mining that we intend to solve the problem.
2.5.3. Methods and Techniques of Data Mining Modeling
Data Mining Objectives
A DM goal influences the choice of algorithms and modeling techniques to use. Therefore, Quintela (2005) among the various types of DM objectives, highlights the following:
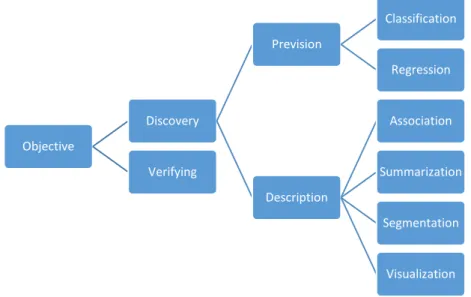
Figure 6: Data Mining Methods and Techniques. Adopted in (Quintela, 2005)
• Classification: As one of the most common and commonly used objectives in supervised learning, it corresponds to the discovery of a function that associates a case with a class within several discrete classification classes, that is, to identify a class in relation to the group that it belongs to.
• Regression: or prediction, consists in predicting future or unknown values of a dependent variable, from samples, there is usually the presence of numerical and non-categorical values.
• Association: or dependency, searches for a model that describes significant dependencies between variables, starting from a group of strongly identified and associated data. Objective Discovery Prevision Classification Regression Description Association Summarization Segmentation Visualization Verifying
34 • Summarization: Use of methods to find a robust description for a subset of data. • Segmentation: one in which allows the identification of a finite set of categories
to describe data.
• Visualization: use of graphs, diagrams, or another visual form to present results (final or intermediate) of DM.
Methods and Techniques
The DM methods are usually divided into supervised (predictive) and unsupervised (description) learning, where the supervised methods are provided as a set of data that have a predefined target variable and the records are categorized in relation to it, and the latter does not require a target attribute (in some cases the classification can also fit into this group). Once there is this separation in advance, it is also important to highlight the techniques associated with each objective (or task) of DM, presenting the main ones in the Table 1:
Table 1: Data Mining Techniques and Tasks
Techniques/ Tasks
Classification Regression Segmentation Association Summarization Visualization
Decision Trees ✓ ✓ ✓ ✓ ✓ Rule Induction ✓ ✓ ✓ ✓ Neural Networks ✓ ✓ ✓ ✓ Genetic algorithms ✓ ✓ ✓ ✓ Neighborhood Roughs ✓ ✓
Source: Camilo & Silva (2009)
Starting from the beginning of the previous table, there are several techniques that can be applied for each task, and therefore, as the research problem is related to the Regression method, will be described the Decision / Regression (DT) Trees, Random Forest (RF), the Neural Networks (NN) on their variances MLP (Multilayer Perceptron) and MLPE,
35 K-NN (K-Nearest Neighbors) and finally the Support Vector Machines (SVM), considering the scientific work of Moro, Cortez, and Rita (2015).
It is important to note that, one of the methods to assess and validate the built model consists in applying cross-validation, that is, if the original data set is very large, there is no problem in splitting it into training and a test set. However, available datasets are always “too small”, so that we need to make sure we use the available data most efficiently, using a process known as cross-validation (Janert, 2010). The objective of cross-validation is to estimate the expected level of fit of a model to a set of data that was used to train the model.
The model to be built works as an estimator looking for the best model. There are large mechanisms to measure the estimation of the error, being MAD (Mean Absolute Deviation), SSE (Sum Squared Error), MSE (Mean Squared Error), RMSE (Root Means Squared Error), MAE (Mean Absolute Error) and NMAE (Normalized MAE) (more information at Quintela, 2005). Particularly to this research, it will be used only two last metrics, where according to Silva et al. (2018), as far as error metrics are concerned, MAE is one of the most frequently used metrics for assessing forecast accuracy and it consists of the mean of the absolute difference between the total of predicted values (Predi) for a given output variable and its actual values (Truei) for all its n observations. The same with NMAE, which consists in entailing the distribution of the MAE through the difference between the interval of the values of the output variable.
According to Abreu (2016), it is important to compare errors metrics in order to evaluate the models, where the difference between the actual value and the predicted value (designated by error or residue) is as less as possible. Thus, all statistics compare true values with their predicted, despite the different formats, all illustrate "how far" are the predicted values from the true values. It is still important that the model with highest correlation and with estimates of smaller errors is the candidate with the best performance.
Decision Trees automatically test all values of a given data to identify those that have a strong connection to the output records selected for the test. Graphically, like a tree, consisting of a structure that connects a set of nodes through branches resulting from a recursive partition of the data, from the root node to the leaves, each branch representing
36 a conjunction of conditions, as well as the leaves (pure nodes) correspond to classes / objects, internal nodes to attributes, and branches to attribute values (Quintela, 2005). Still, decision trees can be categorized in both classification trees and regression trees, the latter estimating the value of a numeric variable while the former qualifies the records and tries to associate them with a correct class.
The RF model is based on building a series of DT and use them in combination. Thus, it works by creating multiple decision trees with random distribution of the attributes in the nodes and selects the one that has the best result, that is, as if each tree in the forest was a decision tree, voting for the class returned by it, in the end, the forest chooses the most voted class as its decision (Barbosa & Rolim, 2017). In fact, the RF cannot be directly interpretable as it happens for DT, although it is still possible to provide explanatory knowledge in terms of its input variable relevance (Cortez & Silva, 2008).
Quintela (2005) states that NN are strongly associated with the nervous systems of living beings, the human being, where many researchers believe that these sub-symbolic models offer a more promising approach in the construction and operation of real intelligent systems. During the learning process, the NN, through a learning or training algorithm, adjusts the connection weights until a satisfactory result is achieved.
An alternative to the linearity problems that are identified in NN, we can search for great accuracy of the results by adopting more intermediate layers of neurons and an output layer, also called MLP. Although the perceptron network is simple, with only one layer of neurons (and MLP for several layers), they are best used in classification problems with good predictive capacity, but they are also applied in a regression context, changing the fact that there is no discretization imposed by the choice of the neuron with the highest output in the prediction (Gama et al. 2012).
Next, according to Gama et al. (2012), the k-NN algorithms are called paradigms where objects with similar characteristics belong to the same group. Although the prediction is considered costly in k-NN algorithms (because in a large set of training objectives this process can be time consuming), as it is affected by the presence of redundant and irrelevant attributes, these algorithms are applied in complex problems, where its algorithm training is very simple, consisting of memorizing training objects, and naturally increment them (Gama et al. 2012). These authors also consider that this
37 algorithm is widely used by the knowledge extraction community because it is simple to apply and presents a good predictive rate in several datasets.
On the other hand, the SVM are based on algorithms that have their variants, initially created for classification problems, and nowadays also applied in regression, and has as objective the implementation of distance between the classes of a dataset (Quintela, 2005).
As reported by Gama et al. (2012), the most commonly used NN in practice are the MLP networks (although the research also benefits from the MLPE variation - ensemble architecture of neural networks), as well as the SVM, these techniques are considered "black box", that is, the extraction of knowledge is encoded in equations with difficulty on interpreting, in contrast to the models generated by symbolic techniques such as decision trees.
Therefore, according to Baker et al. (2011) cited by Camilo and Silva (2009), Data Mining techniques can be applied in different decision-making contexts, whether in finance, education (currently called MED), health, or marketing, logistics and manufacture. In fact, it is possible through the technique, the process of obtaining student data to verify the relationship between their learning on a pedagogical approach, thus allowing the teacher to understand whether their approach has been or not effective in both the development of the student, as in the elaboration of their teaching methods.
2.5.4. Mining Educational Data
Mining Educational Data has been considered a research area that is concerned with the search for methods that explore educational data, or when it comes from educational environments, in which exist an objective on perceiving students and their academic performances, as well as to explore better ways of learning for the same.
For example, Brito, Júnior, Queiroga, and Rêgo (2014) which aimed at the identification of students who needed didactic support in science disciplines in the course of Computing Sciences, which through a set of real data applying the techniques of Data Mining, where variables were chosen (within the existing ones), students’ entrance notes, performance in the first period of the course, final average in each discipline, it was possible, with an accuracy of 70% to show that it is feasible to predict student performance using the variables (student entry grade) and applied modeling techniques,
38 allowing educators to take measures that prevent low student performance, or to improve pedagogical techniques until then.
Under the same point of view, França and Amaral (2013) presented results through the application of segmentation (a method where data share similar trends and patterns) on data collected from evaluations, to group students with similar learning difficulties in a Programming discipline. It was possible too to detect which content and at what level of learning (categorized in Bloom’s Taxonomy) was assimilated by the students and what could be the methods to be adopted to overcome the identified learning problem.
Within the studies by Almeida (2017) and Cortez and Silva (2008), the aim was the identification of the factors that influences the classification obtained by a student, in exams of Advanced Excel and Introduction to Excel, and the prediction of the results of the students with the identification of the factors that influence their educational success/failure in Mathematics and Portuguese classes, both applying DM techniques: MLPE, SVM, DT, NB and other techniques respectively. Therefore, it was possible to conclude that the examinations that had a very long MCQ enunciation are one of the main causes that can influence negatively the results obtained by these questions, either by the student’s interpretation or even misunderstanding of the objective of the question, the degree of difficulty and the topic of the subject, as well as, it is also possible to predict student outcomes, especially when associated with social and educational factors.
39
Prior Literature - Conclusions
Much has been discussed recently concerning the teaching and learning process, particularly the form in which educational objectives are defined and in which way these can guarantee the acquisition of knowledge and competence for a student; assessment is one of the most used strategies to measure theoretical and practical performance.
That being so, it is necessary to consider the existence of a plan, a guide or even a methodology that aids and guarantees integrity and concordance between all the stages involved in this learning process. Whether to analyze the educational process (acquisition of knowledge, competence or ability) of the student, or to create an assessment that is in accordance with defined objectives, Bloom’s Taxonomy, composed of educational objectives (knowledge, understanding, application, analysis, synthesis and assessment), is used now.
Seeing that assessment is an object in all this process, it is important to mention that apart from the objectives included in the same, the format of the test also is part of the assessment method, where from the various existing formats this research centered only on multiple choice and open question tests. Bearing in mind the frequent transition of tests carried out on paper to electronic platforms, it is meanwhile necessary to understand the transition of assessments on paper (whether CR or MCQ) to electronic format also considered in some e-assessment literature, this latter being elaborated only in MCQ to deal with objective questions, thus giving the motive for the problem of research, to try to understand if some difference exists in the performance of the student between using CR on paper or MCQ using e-assessment, or, whether in the final analysis, there is no difference, employing the revision of works by authors who had already approached the matter and by methodology adopted by work using the techniques of Data Mining.
However, the literature shows that there is no consensus regarding the equality of questions in measuring the same things, or if both are distinct, the tendency being to favor MCQ to measure higher positive results, while there are those who defend an assessment system that includes both types of questions.
In the literature researched, there are several works on Data Mining, that approach the use of the technique for identifying student learning over a pedagogical approach, in a wider concept defined by Mining Educational Data, which includes the activities of
40 estimating/foreseeing positive/negative results in a curricular unit, while there is a dearth of articles using Data Mining (since the majority used statistical methods) to verify the relation between the results of students obtained in CR and MCQ assessments (which revolve round the objective of this research).
![Figure 1: Bloom's Taxonomy. [Adapted from: Using a Learning Taxonomy to Align Your Course] 2](https://thumb-eu.123doks.com/thumbv2/123dok_br/18233786.878292/19.892.265.653.113.366/figure-bloom-taxonomy-adapted-using-learning-taxonomy-course.webp)

![Figure 19: Modeling Evaluation Approach. [Source: Silva et al. (2018)]](https://thumb-eu.123doks.com/thumbv2/123dok_br/18233786.878292/57.892.205.699.216.838/figure-modeling-evaluation-approach-source-silva-et-al.webp)