Article
Printed in Brazil - ©2013 Sociedade Brasileira de Química0103 - 5053 $6.00+0.00
A
*e-mail: [email protected]
Degradation of the Herbicide Paraquat by Photo-Fenton Process:
Optimization by Experimental Design and Toxicity Assessment
Alam G. Trovó,*,a Oswaldo Gomes Junior,a Antonio E. H. Machado,a
Waldomiro Borges Netoa and Jader O. Silvab
aInstituto de Química, Universidade Federal de Uberlândia (UFU), CP 593, 38400-902 Uberlândia-MG, Brazil
bDepartamento Municipal de Água e Esgoto de Uberlândia (DMAE), 38400-606 Uberlândia-MG, Brazil
Este trabalho descreve a influência e otimização dos reagentes de Fenton (concentração de Fe2+ e H2O2) na eficiência da mineralização do herbicida paraquat (PQT, 50 mg L–1) em água, após 60 min (equivalendo a 642 kJ L–1 de radiação UVA acumulada) de tratamento por processo foto-Fenton em escala de laboratório, usando planejamento composto central (CCD). Sob condições otimizadas, experimentos cinéticos foram feitos, avaliando a remoção do PQT, sua mineralização e toxicidade em escala de laboratório, usando irradiação artificial, e em planta piloto sob irradiação solar. A mesma eficiência de remoção e mineralização do PQT foram obtidas em ambos os reatores utilizados. A toxicidade das amostras, estimada em termos de mortalidade de
Artemia salina, diminui simultaneamente com o decaimento da concentração de PQT, sugerindo
a formação de intermediários de menor toxicidade. Dessa maneira, o processo foto-Fenton/solar pode ser considerado uma alternativa viável para o tratamento de águas residuais contendo PQT.
This study describes the influence and optimization of Fenton’s reagent (concentration of Fe2+ and H2O2 ) on the efficiency of mineralization of the herbicide paraquat (PQT, 50 mg L
-1) in water, after 60 min (equivalent to 642 kJ L–1 of accumulated UVA radiation) treatment by photo-Fenton process in laboratory scale, using central composite design (CCD). Under optimized conditions, kinetic experiments were done, evaluating the PQT removal, its mineralization and toxicity in laboratory scale, using artificial irradiation, and in a pilot plant under solar irradiation. The same removal efficiency and mineralization of PQT were obtained in both reactors. The toxicity of the samples, estimated in terms of mortality of Artemia salina, decreases simultaneously with the decay of concentration of PQT, suggesting the formation of intermediates of lower toxicity. In this way, the solar photo-Fenton process can be considered as a viable alternative for the treatment of wastewater containing PQT.
Keywords: pesticides, detoxification, pilot plant, wastewater treatment, solar light intensity
Introduction
Since 2008 Brazil has overtaken the United States in pesticides consumption, becoming the largest consumer.1
The herbicide paraquat dichloride (PQT, Figure 1) has been widely used for application in post-emergence of weeds and also as desiccant.2 Its residence time in soils can
vary from 1.4 to 7.2 years depending on the concentration, soil characteristics (organic matter), temperature and rainfall.3 In river water samples, it has been observed
that PQT is not easily microbiologically degraded, since, even after 56 days of incubation, more than 80% of the initial concentration remains unchanged, suggesting to
PQT considerable recalcitrance.4 In addition, PQT is
polar, showing high solubility in water, as well as a low octanol-water partition coefficient (log Kow = –4.5), which
provides a great mobility in some soils, arriving easily until the next water supplies.5 It has been found in the range of
2-12 µg L–1 in groundwater,6 and, for example, at average
concentration of 0.78 µg L–1 in surface waters in Spain.7
In acute toxicity studies performed by US Environmental Protection Agency using laboratory animals, PQT has been shown to be highly toxic by inhalation route, having
been classified in toxicity category I (the highest of four levels). The high toxicity of this compound has also been observed in studies involving the use of bacteria, small crustaceans, algae and aquatic plants.8-12 Thus, its presence
in the environment can cause adverse effects in aquatic and terrestrial organisms. Therefore, it is desirable for the development and optimization of viable technologies with a focus on disposal of such waste.
Since the traditional biological treatments are not effective in the PQT removing, an alternative can be the use of advanced oxidation processes (AOPs) due to their recognized efficiency in the treatment of recalcitrant organic matter, through the efficient generation of HO• radicals.13-15
From the variety of existing AOPs, particular attention has been given to photo-Fenton process and heterogeneous photocatalysis due to the possibility of use of solar radiation,16 reducing the energetic costs. The photo-Fenton
process has the advantage to be a homogeneous process, avoiding an additional step of removal of catalyst, usual when dealing with a heterogeneous process. Another advantage is the fact that homogeneous processes favor a greater contact between reagent species, with favorable implications for process performance.
The use of different AOPs for degradation of PQT has been reported, such as immobilized TiO2 and/or
in suspension, combined with UV irradiation,17-21
UV-ozonation,22,23 Fenton’s reaction,24 activated carbon
modified with iron and combined with hydrogen peroxide, and electrochemical methods.25,26 However,
a study by applying experimental design and response surface methodology that provides conclusions which result in the optimization of Fenton’s reagents for PQT degradation was not reported until now. In addition, a kinetic study on the degradation of PQT by photo-Fenton process and toxicity assessment was also not published. Therefore, the aim of the present work was to evaluate the role of each variable (Fe2+ and H
2O2 concentration)
on the percentage of mineralization of a commercial formulation of PQT (HelmoxoneTM) at lab-scale, and, under
optimized conditions, monitor the kinetic of PQT removal, mineralization, toxicity and the carbon oxidation state (COS) during photo-Fenton treatment not only at lab-scale but also in a solar pilot plant.
Experimental
Reagents
All solutions were prepared using ultrapure water.
FeSO4.7H2O (Vetec) was used to prepare aqueous
0.25 mol L–1 Fe2+ stock solution; H
2O2 (30% m/m), H2SO4,
NaOH and Na2SO3, all from Vetec, were used as received. A
solution of ammonium metavanadate (Vetec) was prepared at a concentration of 0.060 mol L–1 in 0.36 mol L–1 H
2SO4 and
used for H2O2 quantification.
All experiments were carried out using the commercial formulation (276 g L–1 of PQT, C
12H14Cl2N2 = 257 g mol –1),
diluted to obtain 50 mg L–1 PQT in solution. Although the
PQT concentration is higher than that found in aquatic environments, it was chosen to permit an adequate evaluation of the toxicity. An analytical standard of PQT for chromatographic analysis was purchased from Sigma-Aldrich. High performance liquid chromatography (HPLC) analyses were done using HPLC grade methanol (Vetec).
Experimental design
The central composite design (CCD) was applied to optimize the concentration of the variables (Fe2+ and
H2O2), able to induce a high percentage of mineralization
of commercial formulation by the photo-Fenton process, as well as to evaluate the interactions among these two variables. The percentage of mineralization, measured by total organic carbon (TOC) decay after 60 min of reaction in relation to the initial TOC value, was chosen as the response factor of the photo-Fenton process. CCD is a star type project that consists of three series of experiments: (i) a 2k
factorial design (all possible combinations of codified values between +1.0 and –1.0) for k = 2 variables consists of four experiments; (ii) axial or star points (+1.4 and –1.4), and 0 for two variables (four experiments); and (iii) replicates of the central point (0) (five experiments). Thus, for this design, it was necessary to do thirteen experiments, in which the two variables were codified in five levels, varying within the following ranges: Fe2+
(7.2-12.8 mg L–1) and H
2O2 (39.8-232.2 mg L
–1). The
ranges of the variables were chosen according to previous studies.27-30For CCD, the equations used to quantitatively
describe each system and draw the response surface and contour plots were built using STATISTICA 6.0 software. Statistical validation was obtained using the analysis of variance (ANOVA) test at 95% confidence level.
Photodegradation procedures
Lab-scale experiments
the center of the reactor, as described and schematically presented by Oliveira et al.31 The average irradiance of UVA
radiation measured for the lamp32 is 1100 W m–2, which
presents a photonic flux of 3.3 × 10⁻⁶ einstein s–1 between
295 and 710 nm.33 The measurements were done using a
Solar Light PMA 2100 photometer/radiometer, equipped with an UVA detector (320-400 nm) and a radiometric/ photometric setup,33 built with components furnished by
Ocean Optics, Inc.
The irradiated volume of the reactor was 0.280 L and a total volume of 4 L of commercial formulation was recirculated, by pumping at a flow rate of 2.14 L min–1
after the addition of iron solution, pH adjustment between 2.5 and 2.8 (the optimum pH range for the Fenton reaction) and addition of H2O2. The lamp was only turned
on when the reactor was filled with solution.
For CCD experiments, aliquots of the photolyzed solutions (20 mL) were collected only after 60 min of reaction, while for the kinetic experiment, samples (70 mL) were collected at 20 min intervals up to 120 min. The initial conditions used in CCD design are described in the section of the experimental design.
The kinetic experiments were carried out using initially 50.0 mg L–1 PQT, 11.8 mg L–1 Fe2+ and 188.1 mg L–1
H2O2, the last replaced in 60 and 100 min of reaction due
to its consumption. After sampling and before analysis, a calculated volume of 2.0 mol L–1 Na
2SO3 solution was
added to the samples, according to the stoichiometry between H2O2 and Na2SO3, and H2O2 concentration. This
procedure ensures the removal of the remaining H2O2,
interrupting the Fenton reaction. Also, it eliminates the interference caused by traces of H2O2 in toxicity assays and
avoids the sulfite interference on the chemical oxidation
demand (COD) measurements.34
For the toxicity assays, the pH value was adjusted in the range between 6 and 8 after adding the Na2SO3
solution. The solution temperature was controlled using a thermostatic bath (Tecnal TE-184), keeping close to 25 ± 2 ºC. Control experiments were performed using the same experimental setup previously described for the kinetic photo-Fenton experiments.
Experiments in a pilot plant: use of solar radiation
Experiments using solar radiation were carried out during Autumn, under clear sky conditions, using a solar pilot plant. The solar irradiance was measured using a radiometer (PMA 2100, Solar Light, Co.) in the UVA region (320-400 nm), with the sensor attached with the same inclination of the reflective surface of the reactor.35 Under this
condition, an average solar irradiance of 36.4 ± 5.4 Wm–2 was
obtained between 9:45 and 11:45 am in May/2012.
The solar reactor is a compound parabolic collector (CPC) with an irradiated surface of 1.62 m2 (irradiated
volume: 12 L) and a reservoir with maximum capacity of 120 L.35 A volume of 50 L of the PQT solution was
circulated under turbulent flow (33.3 L min–1) into the
CPC absorber tubes in a closed recirculating system. The photoreactor hydraulic circuit consists of a continuously stirred tank and a 0.50 HP centrifugal pump. At the beginning of the experiment, with the collectors covered, the same initial conditions defined for the reagents in kinetic experiments using lab-scale reactor were used. The cover was then removed and samples were collected at intervals of 20 min up to 120 min. The same treatment previously described, using Na2SO3 solution, was done to stop the
Fenton reaction.
In this experiment, new additions of H2O2 were done
at 60, 80 and 100 min of reaction.
Measurements of the accumulated UVA energy
It is important to mention that due the differences of the reactors, like as the average irradiance, surface area, total volume of solution, the accumulated UVA energy (QUVA,n,
kJ L–1) was calculated for each time of sampling in each
reactor to allow a good comparison of the results. Equation 1 allows to estimate the amount of accumulated UVA energy (QUVA,n) received on any surface per unit of volume, for a
solution inside the reactor, in a time interval ∆t.36
(1)
where tn is the sampling time, Vt is the total reactor volume,
Ar the illuminated collector surface area and UVAG,n the
average solar or artificial UVA radiation, measured during the period ∆tn (tn – tn-1).
Table 1 presents the accumulated UVA energy for each reactor corresponding to the sampling times of 20, 40, 60, 80, 100 and 120 min. A significant difference in the accumulated UVA energy was obtained for both reactors. An accumulated UVA energy 10 times higher than that provided by solar radiation to the pilot plant is provided by the mercury lamp to the lab-scale reactor. In the X-axis of Figures 3 and 4, the sampling time was maintained for comparison with control experiments done in the dark, in function of the reaction time.
Analysis
diameter of 0.45 µm. Mineralization, conversion of the organic matter to carbon dioxide and water, of PQT present in a commercial formulation was followed measuring the TOC decay using a TOC analyzer (Shimadzu TOC-VCPH/CPN) equipped with an ASI-V auto sampler. The determination consists of two analyses: first the total carbon (TC) of the sample is determined after catalytic oxidation at high temperature, while the total inorganic carbon (TIC) is determined by equilibrium shift after addition of phosphoric acid to the sample. In both analyses, the CO2 released is
determined by infrared spectroscopy.
The TOC concentration includes the carbon content of the target compound, the intermediates generated during the experiment and the excipient of the commercial product. It is calculated by the difference between TC and TIC. Hydrogen peroxide was quantified spectrophotometrically using ammonium metavanadate, monitoring the absorption of the red-orange peroxovanadium cation, at 450 nm (equation 2).37
VO3
– + 4H+ + H
2O2→ VO2 3+ + 3H
2O (2)
Kinetic experiments were also carried out by HPLC analyses aiming to evaluate the PQT removal, as well as the toxicity and COS. The PQT concentrations were determined by reversed phase HPLC, using a VWR-Hitachi L-2130 chromatograph with UV-Vis detector (Merck-Hitachi L-4250) and a C18 column (Lychrispher,
5 µm, 250 × 4.6 mm). The separation occurred using a mixture of 3 mmol L-1 HCl and methanol (25:75, v/v) in
isocratic mode, at a flow rate of 1 mL min–1. The detection
was performed by UV absorption at 257 nm. The injection volume was 20 µL. Under these conditions, the retention time for PQT was between 2.6 and 2.8 min, with a limit of quantitation of 1.0 mg L–1.
COD, quantity of oxygen required to chemically oxidize organic matter without the intervention of microorganisms, was estimated by absorbance measurement at 420 nm by means a standard photometric method (5220 D).38 This
parameter was determined after digestion of the organic
matter with dichromate solution in closed reflux vessels at 150 °C for 2 h.
COS of the solutions treated by photo-Fenton process was estimated according to equation 3, where TOC and COD are expressed in mg C L–1 and mg O
2 L–1, respectively.
COS is between +4 for CO2, the most oxidized state of
C, and –4 for CH4, the most reduced state of C.34
(3)
The toxicity tests were done evaluating the immobilization of Artemia salina, as described by Trovó et al.30
Results and Discussion
Optimization of Fenton’s reagents for the mineralization of PQT in a commercial formulation using experimental design
Before evaluating the degradation kinetics of PQT, CCD was held with the purpose of evaluating the role of each reagent, optimizing their concentration, so as to ensure maximum efficiency for photo-Fenton reaction. Table 2 shows the experimental planning in CCD as well as the response obtained in each experiment in terms of mineralization of PQT present in a commercial formulation.
Equation 4 was obtained using statistical analysis of the experimental data presented in Table 2.
(4)
The effect of each process independent variable can be directly correlated to its coefficient.27,30
From equation 4, although negative quadratic coefficients have been obtained for Fe2+ (–2.30) and H
2O2 (–0.002), the
expressive positive linear coefficients for Fe2+ (+44.01) and
H2O2 (+0.20), and the positive coefficient found for the
interaction between Fe2+ and H
2O2 (+0.05), suggest that the
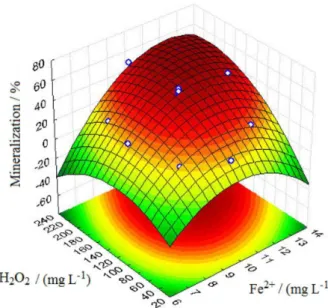
mineralization is favored increasing their concentrations. The overall effect can be observed in Figure 2, that presents a diagram that represents the polynomials related to photo-Fenton reaction, constructed from the results presented in Table 2. An analysis of the surface (Figure 2) suggests that a high percentage of mineralization can be obtained using 11.8 mg L–1 Fe2+ and 188.1 mg L–1 H
2O2.
An experiment was performed in order to check the optimized values, predicted by the mathematical model. The theoretical result, calculated using equation 4, shows a very good agreement with the experimental results
Table 1. Accumulated UVA energy per unit of volume (QUVA) for the
experiments carried out at lab-scale and in a solar pilot plant
time / min QUVA / (kJ L
–1)
Lab-scale Solar pilot plant
20 214 21.7
40 428 42.8
60 642 65.9
80 856 92.1
100 1070 119.5
obtained for the optimal concentration of Fe2+ and H 2O2
(Table 3), assuming a standard deviation of ± 3.1% for mineralization (value obtained from five replicates in the central point of CCD). This demonstrates that the surface response methodology can be useful as a tool to optimize the degradation of organic matter in reactions mediated by photo-Fenton process.
Kinetics of PQT degradation and toxicity assessment
Using the optimized conditions defined by the analysis of the response surface from the results obtained
at lab-scale, the degradation profile of PQT and its mineralization in a commercial formulation (Figure 3), as well as assessment of the toxicity and COS (Figure 4) during photo-Fenton process at lab-scale and in a solar pilot plant was obtained.
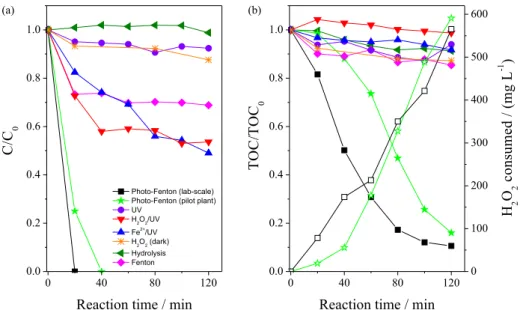
The PQT concentration reached the limit of quantitation (1.0 mg L–1) at lab-scale after 20 min (214 kJ L–1 of UVA
radiation) while 40 min (42.8 kJ L–1 of UVA radiation)
were necessary when the solar pilot plant was used (Figure 3a). Similar behavior was also observed during the mineralization of PQT by photo-Fenton treatment (Figure 3b). A rapid decay of mineralization at lab-scale was obtained in relation to the solar pilot plant. This can be attributed to the higher accumulated UVA energy at lab-scale (Table 1). However, after 120 min of photo-Fenton treatment, a similar efficiency was reached for both reactors (89.4 at lab-scale and 84.1% at solar pilot plant), even assuming a standard deviation of ± 3.1% for mineralization (Table 2). In addition, a lower accumulated UV energy at solar pilot plant (146.9 kJ L–1 of UVA radiation) was
necessary to obtain the same efficiency in relation lab-scale (1284 kJ L–1 of UVA radiation). Nogueira et al.39
evaluated the influence of the solar light intensity on the TOC removal and observed that the degradation rate
Table 2. Central composite design and experimental results for mineralization of PQT in a commercial formulation after 60 min (642 kJ L–1 of UVA
radiation) of photo-Fenton process
Experiment Concentration (codified value) Consumption of H2O2 / % Mineralization / %
Fe2+ / (mg L–1) H
2O2 / (mg L–1)
1 8.0 (–1) 68.0 (–1) 100 17.6
2 8.0 (–1) 204.0 (+1) 56.4 14.8
3 12.0 (+1) 68.0 (–1) 98.8 27.2
4 12.0 (+1) 204.0 (+1) 100 54.1
5 7.2 (–1.4) 136.0 (0) 78.9 22.8
6 12.8 (+1.4) 136.0 (0) 100 50.1
7 10.0 (0) 39.8 (–1.4) 98.2 16.8
8 10.0 (0) 232.2 (+1.4) 96.7 51.5
9 10.0 (0) 136.0 (0) 100 51.5
10 10.0 (0) 136.0 (0) 100 49.8
11 10.0 (0) 136.0 (0) 100 47.3
12 10.0 (0) 136.0 (0) 100 55.6
13 10.0 (0) 136.0 (0) 100 52.8
Standard deviation of central points (experiments 9-13) 3.1
Figure 2. Response surface of quadratic models for the mineralization of PQT in a commercial formulation after 60 min (642 kJ L–1 of UVA
radiation) of photo-Fenton process.
Table 3. Optimized values for the studied variables and comparison between experimental and theoretical results
Variable Concentration /
(mg L–1)
Mineralization / %
Theoretical Experimental
Fe2+ 11.8
58.4 64.6
increases linearly with the light intensity for values up to 15 W m–2, but above this value, the degradation is best
described by a square root relationship, which justifies the results obtained in this work. Although a 400 W high pressure mercury vapor lamp (average irradiance of 1100 W m–2) was used as irradiation source at lab-scale,
the same efficiency was obtained in a solar pilot plant
with an average solar irradiance of 36.4 ± 5.4 Wm–2. The
consumption of hydrogen peroxide agrees with the results of mineralization (Figure 3b). After 120 min (146.9 and 1284 kJ L–1 of UVA radiation, respectively under solar
irradiation and in lab-scale) of photo-Fenton treatment, 565 and 591 mg L–1 of H
2O2 were consumed at lab-scale and
solar pilot plant experiments, respectively (Figure 3b). The H2O2 consumption profile shows a linear correlation
with the reaction time (α = 4.7 and 4.9 mg H2O2 min –1 at
lab-scale and in a solar pilot plant, respectively). For this same sequence, under the operating conditions, 10.8 and
12.4 mg H2O2 were consumed for each mg of TOC
mineralized (Figure 3b).
Control experiments at lab-scale were also performed for an initial PQT concentration equal to 50 mg L–1 in the:
(i) absence of Fe2+ and H
2O2 (direct photolysis at pH 6.3,
natural pH of the solution); (ii) dark, without Fe2+ and in
the presence of H2O2 (188.1 mg L–1); (iii) presence of UV
irradiation and 188.1 mg L–1 H
2O2 at pH 6.3, without Fe 2+;
(iv) hydrolysis at pH 2.5; (v) presence of UV irradiation and 11.8 mg L–1 Fe2+ at pH 2.5, without H
2O2; and (vi) presence
of 11.8 mg L–1 Fe2+ and 188.1 mg L–1 H
2O2 in the dark
(Figure 3). A lower removal of PQT and mineralization was obtained for all control experiments, when compared to the photo-Fenton process, evidencing its high efficiency and assuring that the results found are consistent and not due to hydrolysis, thermal Fenton process, and/or direct or due to hydrogen peroxide photolysis (Figure 3).
COSs for the samples in reactions mediated at lab-scale, and toxicity at lab-scale and using a solar pilot plant,
Figure 3. Profiles of (a) PQT and (b) TOC removal (solid symbols) and consumption of H2O2 (open symbols) during the degradation of PQT present in
a commercial formulation by photo-Fenton process at lab-scale and in a solar pilot plant, compared to control experiments (lab-scale). Initial conditions: [PQT] = 50 mg L–1 (TOC = 59 mg C L–1), [Fe2+] = 11.8 mg L–1, [H
2O2] = 188.1 mg L–1 and pH = 2.5-2.8. New additions of H2O2 were done at 60 and
100 min lab-scale (642 and 1070 kJ L–1 of UVA radiation) and 60, 80 and 100 min at solar pilot plant (65.9, 92.1 and 119.5 kJ L–1 of UVA radiation,
respectively) during the photo-Fenton process.
Figure 4. Profiles of evolution of toxicity (at lab-scale and in a solar pilot plant) and COS (at lab-scale) during the degradation of PQT in a commercial formulation by photo-Fenton process. Initial conditions: [PQT] = 50 mg L–1 (TOC = 59 mg C L–1), [Fe2+] = 11.8 mg L–1,
[H2O2] = 188.1 mg L–1 and pH = 2.5-2.8. New additions of H
2O2 were done
at 60 and 100 min lab-scale (642 and 1070 kJ L–1 of UVA radiation) and
60, 80 and 100 min at solar pilot plant (65.9, 92.1 and 119.5 kJ L–1 of
were also analyzed during PQT degradation aiming to evaluate the toxicity behavior and COS variation during application of the photo-Fenton process under optimum conditions. The assessment of the toxicity during the degradation of pesticides is critical when a process is studied as an alternative to wastewater treatment, or when this same process is regarded as the first stage in a treatment process coupled to a subsequent biological process.40
The solution containing 50 mg L–1 of PQT showed a high
value of COS (+ 3.44), suggesting that the compound has a high COS (Figure 4). However, this value does not show correspondence with the theoretical value. The experimental COD value obtained for the experimental TOC initial concentration of commercial formulation is equivalent to only 14.0% of the theoretical value (157 mg O2 L
–1).
This low experimental COD value obtained in relation the experimental initial TOC (59 mg C L–1) contributes
to generate a high experimental COS (equation 3), higher than the theoretical value (COS = 0.0008). This lower value measured for COD is probably due to the presence of two pyridine rings on PQT structure, a refractory species to APHA method for determination of COD.34
Applying the photo-Fenton process at lab-scale, the PQT concentration reached the limit of quantitation (1.0 mg L–1) with 18% of TOC removal (Figure 3) and
an increase in COS from +3.44 to +3.84 (Figure 4), in only 20 min of reaction (214 kJ L–1 of UVA radiation),
after consumption of 78 mg L–1 H
2O2. In this same
period, the acute toxicity, calculated by the inhibition of mobility of A. salina, decreased from 87 to 33% (Figure 4), which is related with the PQT concentration reduction (Figure 3a). With the increase of the reaction time up to 40 min (428 kJ L–1 of UVA radiation), a
consumption of 174 mg L–1 H
2O2, a TOC removal of
50% (Figure 3b), the same COS value of +3.84 and a decrease in the toxicity from 33 to 10% (Figure 4) were reached. Although the COS values obtained do not show correspondence with the theoretical data, the application of photo-Fenton process contributed to the formation of intermediates more oxidized and a lower toxicity than the verified for the initial sample containing only PQT. After 60 min (642 kJ L–1 of UVA radiation) of
reaction and consumption of 213 mg L–1 H
2O2, 69% of
TOC removal (Figure 3b) and a toxicity of 13% (Figure 4) were obtained. It was not possible to calculate the COS value after 60 min (642 kJ L–1 of UVA radiation) of
reaction, once that the COD values obtained were null. For an irradiation time up to 120 min (1284 kJ L–1 of
UVA radiation) and consumption of 565 mg L–1 H
2O2,
89% of TOC removal (Figure 3b) and a toxicity of 20%
were reached (Figure 4). Similar behavior was obtained to toxicity when the experiment was carried out in a solar pilot plant, however with a lower accumulated UVA energy (Figure 4 and Table 1). The residual toxicity, between 10-20% in both reactors (Figure 4) is probably due the formation of carboxylic acids, as already observed for Daphnia magna and Vibrio fischeri during degradation of sulfamethoxazole and amoxicillin.41,42
On the other hand, Santos et al.24 observed a decrease
in the biodegradability and no toxicity reduction during PQT degradation by the Fenton’s process after 25 h using the initial conditions: 100 mg L–1 PQT, 28 mg L–1 Fe2+ and
221 mg L–1 H
2O2. Probably this difference, compared to our
best results, may be due to different initial concentration of PQT and reagents, the removal of TOC reached and/or the concentration of intermediates generated in solution.
In general, it can be observed that after short periods of photo-Fenton process (between 20 and 40 min), the toxicity tends to decrease with the PQT concentration reduction and intermediates more oxidized were obtained (Figure 4). So, after these times, probably a biological process could be coupled with the photo-Fenton one, reducing the operational costs of the oxidative treatment. Similar behavior has been observed for other compounds/ wastewaters, during the application of Fenton and photo-Fenton processes.43-46
Conclusions
Based on the experimental results obtained, it is possible to conclude that experimental design and response surface methodology are powerful tools to optimize, in a short set of experiments, the concentration of Fenton reagents, obtaining a high percentage of mineralization of PQT in a commercial formulation. Under optimized conditions, the same efficiency was obtained for both reactors. These results demonstrates that the photo-Fenton process can be applied as an alternative to the wastewater treatment containing this herbicide in large scale and using solar radiation, once that the toxicity decreased significantly with the paraquat concentration reduction and intermediates more oxidized were obtained. In addition, the use of solar radiation is completely advantageous, mainly in tropical countries like Brazil since the energetic costs of the process are reduced to zero.
Acknowledgments
CEX-APQ-02425-10), CAPES, CNPq (300.587/2008-2 and 304.576/2011-5) for the financial support of this work. A. E. H. Machado is particularly indebted to CNPq and CAPES for his research grants. The authors also thank to Dr. R. Ruggiero for providing access and use of the HPLC/UV equipment.
References
1. http://portal.anvisa.gov.br/wps/content/anvisa+portal/anvisa/ sala+de+imprensa/menu+-+noticias+anos/2012+noticias/sem inario+volta+a+discutir+mercado+de+agrotoxicos+em+2012 acessed in November 2012.
2. http://portal.anvisa.gov.br/wps/wcm/connect/7bfd7800474594 009b90df3fbc4c6735/P01++Paraquate.pdf?MOD=AJPERES accessed in November 2012
3. Cheah, U-B.; Kirkwood, R. C.; Lum, K.-Y.; J. Agric. Food Chem.1998,46, 1217.
4. Wang, Y.; Yen, J.; Hsien, Y.; Chen, Y.; Water, Air, Soil Pollut.
1994,72, 1.
5. Tomlim, C. D. S.; The Pesticide Manual, 12th ed.; British Crop
Protection Council: UK, 2000.
6. Vidal, J. L. M.; Vega, A. B.; López, F. J. S.; Frenich, A. G.; J. Chromatogr., A2004, 1050, 179.
7. Fernández, M.; Ibáñez, M.; Picó, Y.; Mañes, J.; Arch. Environ. Contam. Toxicol.1998, 35, 377.
8. Alberdi, J. L.; Saenz, M. E.; DiMarzio, W. D.; Tortorelli, M. C.; Bull. Environ. Contam. Toxicol.1996,57, 229.
9. Ruiz, M. J.; López-Jaramillo, L.; Redondo, M. J.; Font, G.; Bull. Environ. Contam. Toxicol. 1997, 59, 619.
10. Qian, H. F.; Chen, W.; Sun, L. W.; Jin, Y. X.; Liu, W. P.; Fu, Z. W.; Ecotoxicology2009, 18, 537.
11. Mohammad, M.; Itoh, K.; Suyama, K.; Arch. Environ. Contam. Toxicol. 2010, 58, 605.
12. Jamers, A.; De Coen, W.; Environ. Toxicol. Chem. 2010,29, 893. 13. Malato, S.; Fernández-Ibáñez, P.; Maldonado, M. I.; Blanco, J.;
Gernjak, W.; Catal. Today2009, 147, 1.
14. Zapata A.; Oller, I.; Sirtori, C.; Rodríguez, A.; Sánchez-Pérez, J. A.; López, A.; Mezcua, M.; Malato, S.; Chem. Eng. J. 2010, 160, 447.
15. Pintor, A. M. A.; Vilar, V. J. P.; Boaventura, R. A. R.; Sol. Energy
2011, 85, 579.
16. Safarzadeh-Amiri, A.; Bolton, J. R.; Carter, S. R.; J. Adv. Oxid. Technol. 1996, 1, 8.
17. Tennakone, K.; Kottegoda, I. R. M.; J. Photochem. Photobiol., A
1996, 93, 79.
18. Moctezuma, E.; Leyva E.; Monreal, E.; Villegas, N.; Infante, D.; Chemosphere 1999, 39, 511.
19. Lee, J. C.; Kim, M. S.; Kim, C. K.; Chung, C. H.; Cho, S. M.; Han, G. Y.; Yoon, K. J.; Kim, B. W.; Korean J. Chem. Eng. 2003, 20, 862.
20. Lee, J-C.; Kim, M-S.; Kim, B-W.; Water Res. 2002,36, 1776. 21. Florencio, M. H.; Pires, E.; Castro, A. L.; Nunes, M. R.; Borges,
C.; Costa, F. M.; Chemosphere 2004,55, 345.
22. Ruth, J. M.; Kearney, P. C.; Zeng, Q.; Chemosphere 1985, 14, 1181.
23. Kearney, P. C.; Ruth, J. M.; Zeng, Q.; Mazzocchi, P.; J. Agric. Food Chem. 1985,33, 953.
24. Santos, M. S. F.; Alves, A.; Madeira, L. M.; Chem. Eng. J. 2011, 175, 279.
25. Dhaouadi, A.; Adhoum, N.; J. Electroanal. Chem. 2009,637, 33. 26. Dhaouadi, A.; Adhoum, N.; Appl. Catal., B 2010,97, 227. 27. Trovó, A. G.; Paterlini, W. C.; Nogueira, R. F. P.; J. Hazard.
Mater. 2006, 137, 1577.
28. Trovó, A. G.; Nogueira, R. F. P.; Aguera, A.; Fernandez-Alba, A. R.; Sirtori, C.; Malato, S.; Water Res. 2009,43, 3922. 29. Trovó , A. G.; Nogueira, R. F. P.; J. Braz. Chem. Soc. 2011, 22, 1033. 30. Trovó, A. G.; Silva, T. F. S.; Gomes Jr., O.; Machado, A. E. H.; Borges Neto, W.; Muller Jr., P. S.; Daniel, D.; Chemosphere,
2013, 90, 170.
31. Oliveira, D. F. M.; Batista, P. S.; Muller Jr., P. S.; Velani, V.; França, M. D.; de Souza, D. R.; Machado, A. E. H.; Dyes Pigm.
2012,92, 563.
32. Machado, A. E. H.; de Miranda, J. A.; de Freitas, R. F.; Mendonça-Duarte, E. T. F.; Ferreira, L. F.; Albuquerque, Y. D. T.; Ruggiero, R.; Sattler, C.; de Oliveira, L.; J. Photochem. Photobiol., A 2003,155, 231.
33. Machado, A. E. H.; França, M. D.; Velani, V.; Magnino, G. A.; Velani, H. M. M.; Freitas, F. S.; Müller Jr.; P. S.; Sattler, C.; Schmücker, M.; Int. J. Photoenergy2008, DOI 10.1155/2008/482373
34. Vogel, F.; Harf, J.; Hug, A.; Von Rohr, P. R.; Water Res. 2000, 34, 2689.
35. Duarte, E. T. F. M.; Xavier, T. P.; de Souza, D. R.; de Miranda, J. A.; Machado, A. E. H.; Jung, C.; de Oliveira, L.; Sattler, C; Quim. Nova2005, 28, 921.
36. Malato, S.; Blanco, J.; Vidal, A.; Richter, C.; Appl. Catal., B.
2002, 37, 1.
37. Nogueira, R. F. P.; Oliveira, M. C.; Paterlini, W. C.; Talanta
2005,66, 86.
38. American Public Health Association (APHA); Standard Methods for the Examination of Water and Wastewater, 16th
ed.; APHA: Washington: USA, 1985.
39. Nogueira, R. F. P.; Trovó, A. G.; Modé, D. F.; Chemosphere
2002, 48, 385.
40. Zapata, A.; Velegraki, T.; Sánchez-Pérez, J. A.; Mantzavinos, D.; Maldonado, M. I.; Malato, S.; Appl. Catal., B 2009, 88, 448.
41. Trovó, A. G.; Nogueira, R. F. P.; Aguera, A.; Fernandez-Alba, A. R.; Sirtori, C.; Malato, S.; Water Res. 2009, 43, 3922. 42. Trovó, A. G.; Nogueira, R. F. P.; Aguera, A.; Fernandez-Alba,
43. Cassano, D.; Zapata, A.; Brunetti, G.; Del Moro, G.; Di laconi, C.; Oller, I.; Malato, S.; Mascolo, G.; Chem. Eng. J. 2011, 172, 250. 44. Wang, C. W.; Fu, H. X.; Lu, Y.; Zhao, X. F.; Environ. Eng. Sci.
2012, 29, 248.
45. Keskin, T.; Tutuk, F.; Azbar, N.; Chem. Biochem. Eng. Q. 2012, 26, 23.
46. Elmolla, E. S.; Chaudhuri, M.; Desalination 2012, 285, 14.