DOI: http://dx.doi.org/10.5007/1980-0037.2017v19n5p505
Validation of anthropometric models in the
estimation of appendicular lean soft tissue
in young athletes
Validação de modelos antropométricos na estimação
da massa isenta de gordura e osso apendicular
em jovens atletas
Pedro Pugliesi Abdalla1,2
AnalizaMónica Silva3
Anderson dos Santos Carvalho4,5
Ana Claudia Rossini Venturini1
Thiago Cândido Alves4
André Pereira dos Santos4,6
Dalmo Roberto Lopes Machado1,4
Abstract – Magnetic resonance imaging and computer tomography are gold standards in the measurement of muscle tissue (MT), but are expensive. Dual Energy X-Ray Absorptiometry (DXA) is also costly but safer and allows for the measurement of Appendicular Lean Soft Tissue (ALST), a strong predictor of MT. Alternatively, there are anthropometric models that predict the ALST of Portuguese athletes with low cost/risk that have not been validated in other populations. he aim of this study was to validate anthropometric Portuguese models that predict ALST in young athletes or, if the validation fails, to propose new models. he ALSTDXA of 174 young athletes was determined by DXA. Two anthropometric models (ALSTmod1 and ALSTmod2) measuring ALST among Portuguese athletes were tested. To
validate the coeicient of determination, the diference (bias) and concordance correla-tion coeicient between predicted and actual values were computed. Finally, associacorrela-tion between mean and diference of methods was veriied. Validation failed and, for this reason, new multiple regression models were proposed and validated using PRESS statistics. he Portuguese models explained ~96% of the ALSTDXA variability. he diference between ALSTmod1 and ALSTDXA (-0.7kg) was less than that found for the ALSTmod2 and ALSTDXA (-2.3kg), with limits of agreement from 3.6 to -2.1 and from 6.1 to -1.5kg, respectively. he new models included three predictive equations for ALST. Only ASLTmod1 was valid;
however, it was prone to bias, depending on the magnitude of ALST values. he newly proposed models present validity with greater concordance (r²PRESS=0.98), lower standard error of estimate (SEEPRESS [kg]=0.91) and more homogeneous predicted extreme values.
Key words: Anthropometry; Body composition; DXA scan; Skeletal muscle; Sports. Resumo – Ressonância magnética e tomograia computadorizada são referências para medir o tecido muscular (TM), porém apresentam custo elevado. A Absorciometria Radiológica de Dupla Energia (DXA) é segura, embora ainda dispendiosa, permite medir a Massa Isenta de Gordura e Osso apendicular (MIGOap), forte preditor do TM. Alternativamente, existem modelos antropo-métricos preditivos da MIGOap de atletas portugueses com baixo custo/risco, porém sem validação para outras populações. Objetivou-se validar modelos antropométricos portugueses preditivos da MIGOap em jovens atletas ou propor novos modelos, caso a validação falhe. A determinação da MIGOapDXA de 174 jovens atletas foi realizada por DXA. Dois modelos antropométricos (MIGOapmod1 e MIGOapmod2) de atletas portugueses foram testados para predizer MIGOap. Para validação o coeiciente de determinação, a diferença (viés) e a concordância entre valores medidos e preditos foram calculados. Finalmente, a associação entre média-e-diferença dos métodos foi calculada. A validação falhou, assim foram propostos novos modelos de regressão múltipla validados por estatística PRESS. Os modelos portuguesesexplicaram ~96% da variabilidade da MIGOapDXA. A diferença entre MIGOapmod1 e MIGOapDXA (-0,7kg) foi menor do que
MI-GOapmod2 (-2,3kg), com limites de concordância de 3,6 a -2,1 e de 6,1 a -1,5kg, respectivamente.
Os novos modelos incluíram três equações preditivas para MIGOap. Somente MIGOapmod1 foi válido, todavia mostrou grande tendência a vieses, conforme magnitude dos valores de MIGOap. Os novos modelos propostos mostraram validade com maior concordância (r²PRESS=0,98), menores
erros de estimativa (EPEPRESS [kg]=0,91) e valores preditos mais homogêneos para casos extremos.
1 University of São Paulo. School of Physical Education and Sport. Postgraduate Program in Physical Education and Sport. Ribeirão Preto, SP. Brazil.
2 University of Ribeirão Preto. Nutrition Course. Ribeirão Preto, SP. Brazil.
3 University of Lisbon. Faculty of Human Motricity. Lisbon, Portugal
4 University of São Paulo. School of Nursing of Ribeirão Preto. Interunit Doctoral Program in Nursing. Ribei-rão Preto, SP. Brazil.
5 Visiting scholar at University of Coastal Carolina University, USA.
6 Visiting scholar at University of Illinois at Urbana-Champaign, USA.
Received: 13 August 2017
Validation of Anthropometric Models of ALST in Young Athletes Abdalla et al.
INTRODUCTION
Skeletal muscular tissue (MT) is essential for athletic performance1,2, as it
is the most abundant body tissue in non-obese individuals1,3. Body
com-position comprises ive levels: I) atomic; II) molecular; III) cellular; IV) tissue; and V) total body3; MT belongs to the fourth level and corresponds
to 30 to 33% of the total body mass of young people4, while in adults it
corresponds to approximately 40%1.
he use of valid and easily applicable methods to quantify the MT of young athletes is highly relevant to monitoring the efects of athletic training on one’s MT structure, determining training loads in diferent phases and balancing training routines with dietary prescriptions, enabling the preservation of or increase in muscle mass to improve athletic perfor-mance2.Even though MT represents a large part of one’s body structure4,
measuring it in live individuals is a complex task when compared to other measures, such as fat or bone tissue.
Imaging methods were developed in the 1970s to analyze MT and remain among the most used: Computed Tomography (CT), Magnetic Resonance Imaging (MRI) and Dual Energy X-ray Absorptiometry (DXA)5. he irst measures using CT were performed in 1983 and in 1995
measures were performed using MRI5. Only in 1998 were both techniques
validated based on the only method that involves the direct measurement of this component, the dissection of corpses6. he study showed that these
methods accurately quantify MT at the tissue level (IV). Nonetheless, these methods are costly2 and diicult to apply, while CT exposes individuals
to radiation, which prevents applying it repetitively7.
A less costly and more accessible alternative method, when compared to the previous ones, is DXA2. It is considered safer because it involves
a minimum of radiation8 and is thus appropriate to measure the body
composition of children and adolescents9. Even though DXA only makes
measurements at level II3, it is possible to isolate body regions for analysis,
such as the upper limbs, lean mass of the measurement of bone and fat mass called Lean soft tissue (LST)2. Appendicular LST (ALST), that is,
the sum of the LST of the upper and lower limbs, is equivalent to almost all MT (level IV) in this region, with the exception of a small amount of connective tissues and skin2. Additionally, the MT that is present in the
both upper and lower limbs represent approximately 75% of MT in adults10.
Based on these proportions, comparisons11 were performed and
mod-els were proposed to estimate MT with ALST measures for adults12 and
children and adolescents using MRI4. hese models included ALST, age
and sex as independent variables and explained 96% of the variability in reference values. Additionally, they were validated in the study’s sub-sample with very high correlation (r = 0.96 to 0.97), no statistically signiicant difer-ences and good concordance between predicted and actual measurements. he models proposed for adults12 were valid for children and mature
and girls (n = 29). he MT measures were taken using MRI and ALST was measured using DXA. he independent variables were: ALST, body mass, height and interaction between ALST/height, explaining from 98% to 99% of the variability of the reference method’s values4. Nonetheless,
even though DXA is safe and appropriate for the young population, it is still an expensive method and cannot be recurrently used in practice2.
Anthropometry, on the other hand, is a highly applicable method in the measurement of MT, given its low cost and accuracy, as long as a minimum amount of training is provided2. Models using anthropometry
were proposed to predict MT among the elderly14,15 and adult individuals7
using the dissection of corpses and MRI, respectively, with proven valid-ity16,17. Only one study was found that proposes anthropometric models
to predict ALST in athletic children and adolescents2, using data from
Portuguese young individuals (176 boys and 92 girls). Even though the authors performed cross validation and obtained good results, the validity of these methods in other populations has not been tested. Speciically, there are anthropometric diferences with statistical signiicance between Brazilian and Portuguese young individuals18, speciically height, an
independent variable that is necessary to predict ALST in the models proposed. herefore, this study’s objectives included: 1) validate Portuguese anthropometric models to predict ALST in Brazilian young male athletes; and, if validation fails, 2) propose new models.
METHODOLOGICAL PROCEDURES
Study’s design
his cross-sectional observational study addressed young Brazilian indi-viduals who took part in sports clubs and whose parents or legal guard-ians received clariication regarding the study’s procedures. Guidelines concerning research involving human subjects were complied with and consent was provided by the participants’ parents or legal guardians; the Institutional Review Board at EEFE/USP approved the study (332007/ EEFE/04.04.2007-2006/32).
Sample
he sample was composed of 174 young male athletes aged between eight and 18 years old who took part in diferent sports (soccer: n=146; athletics: n=8; indoor soccer: n=19 and judo: n=1).
Inclusion/exclusion criteria
Validation of Anthropometric Models of ALST in Young Athletes Abdalla et al.
Measurement protocol
Each participant was assessed in a laboratory setting in the morning after a night of rest. Data were collected in a single session and the same examiner performed all measurements, before which, the individuals were invited to fully empty their bladders. Total body scanning was performed with DXA of the individu-als wearing shorts and shirts, which was followed by anthropometric measures performed according to the recommendations found in the literature19,20.
Establishment of Appendicular Lean Soft Tissue (ALST)
he estimation of ALST using DXA (Scanner DPX-NT, GE Medical, Soft-ware Lunar DPX enCORE 2007 v. 11.40.004, Madison, WI) was performed considering the sum of the LST of the upper and lower limbs. he images of limbs were isolated from the trunk and head (ROIs) using software-generated standard cut-outs, which were manually adjusted when necessary. Speciic anatomic markers were used to deine the lower limbs: LST that extends from the traced and perpendicular line to the axis of the femoral neck and angled with the pelvic lap to the tips of the phalanges. For the upper limbs, the anatomic marker was LST that extends from the center of the arm to the tips of the phalanges, following the procedures of the manufacturer’s manual.
Chronological Age and Anthropometric Measures
Age was considered the whole number nearest to the individual’s chrono-logical age measured in years based on the decimal values of the year of birth. he anthropometric measures necessary to estimate ALST based on the models proposed by Quiterio et al.² included body mass (BM) in kg and height (H) in cm, which were measured using a digital scale (Filizola, PL 200, Campo Grande, MS, Brazil) and a wall-ixed stadiometer (Sanny Medical Professional-ES2020, São Paulo, SP, Brazil) with 0.1 kg and 0.1 cm accuracy, respectively. hree skinfold measurements (SKF) in mm: the thigh (SKFhigh), triceps (SKFTriceps) and calf (SKFCalf) were measured with a Lange skinfold caliper (Beta Technology, Cambridge, Maryland) with 1 mm accuracy. hree perimeters (P) in cm: thigh (Phigh), arm (PArm) and calf (PCalf) were measured using an inelastic and inextensible two-meter long metal tape measure (Sanny Medical, Starrett SN-4010, São Paulo, SP, Brazil) with 0.1 cm accuracy.
Measures accuracy
he Absolute Technical Error of Measurement (TEM) and Relative Tech-nical Error of Measurement (%TEM) were computed to ensure accurate intra-observer measurements. In the days subsequent to data collection, the measurements were replicated in 13 individuals, always within tolerance intervals20, as previously described8.
Estimates of Appendicular Lean Soft Tissue (ALST)
ALSTmod2[kg] = 3.26 + 0.002 * (H[m]*CPThigh[cm]²) + 0.007 * (H[m]*CPArm[cm]²) + 0.003 * (H[m]*CPCalf[cm]²)
Where: BM=body mass; H=height; CP=corrected muscle perimeters; CPThigh=PThigh [cm]-(π*SKFThigh[cm]); CPArm=PArm[cm]-(π*SKFTriceps[cm]); CPCalf=PCalf[cm]-(π*SKFCalf[cm]); P=perimeters; SKF=skinfold; π=3.1416.
Maturity
Participant maturity considered pubic hair development according to Tan-ner’s self-assessment method13.
Statistical analysis
Mean, standard deviation, minimum and maximum values were used to describe the sample. he coeicient of determination (r²), agreement ac-cording to a Bland-Altman21 plot were analyzed together with bias (the
mean of diferences between predicted and actual values) and the concord-ance correlation coeicient (ρc)22 to determine the validity of
anthropo-metric models in predicting ALSTDXA. Strength of concordance of ρc was
classiied23 as: poor (<0.90), moderate (0.90-0.95), substantial (0.95-0.99),
or almost perfect (>0.99). Association between the mean and diferences between predicted and actual values were veriied. Any proposal of new anthropometric models, if necessary, would consider stepwise multiple linear regression, considering reduced multicolinearity (VIF<5)24 and
validation using PRESS statistics (the sum of the squares of residuals)25.
Statistical analyses were performed using SPSS v. 20 (Chicago, IL), plots and ρc in the MedCalc® 2015 (v. 15.2); PRESS statistics in Minitab® (v. 17.3.1), all of which considered a level of signiicance established at α=0.05.
RESULTS
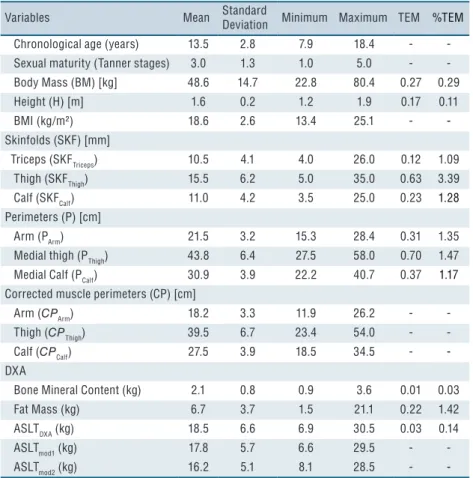
he descriptive analysis, absolute and relative TEM of all the study’s variables are presented in Table 1. he %TEMs were within the expected tolerance interval20, both for the anthropometric variables (0.11% to 3.39%)
and body composition (0.01% to 1.42%).
Most individuals were classiied Pubertal (n=128; 73.6%) when com-pared to Pre-Pubertal (n=26; 14.9%) and Post-Pubertal (n=20; 11.5%). Maturity was not, however, determinant in proposing models.
In the estimation of the variability of values measured by DXA, the Por-tuguese models (ALSTmod1 and ALSTmod2) explained approximately 96.4% and 95.9% (r²), respectively, of the variability of the ALSTDXA of Brazilian athletes.
Validation of Anthropometric Models of ALST in Young Athletes Abdalla et al.
Table 1. Descriptive analysis of all the variables and Absolute (TEM) and Relative (%TEM) Intraobserver Technical Error of Measurement.
Variables Mean Standard
Deviation Minimum Maximum TEM %TEM
Chronological age (years) 13.5 2.8 7.9 18.4 -
Sexual maturity (Tanner stages) 3.0 1.3 1.0 5.0 -
Body Mass (BM) [kg] 48.6 14.7 22.8 80.4 0.27 0.29
Height (H) [m] 1.6 0.2 1.2 1.9 0.17 0.11
BMI (kg/m²) 18.6 2.6 13.4 25.1 -
-Skinfolds (SKF) [mm]
Triceps (SKFTriceps) 10.5 4.1 4.0 26.0 0.12 1.09
Thigh (SKFThigh) 15.5 6.2 5.0 35.0 0.63 3.39
Calf (SKFCalf) 11.0 4.2 3.5 25.0 0.23 1.28
Perimeters (P) [cm]
Arm (PArm) 21.5 3.2 15.3 28.4 0.31 1.35
Medial thigh (PThigh) 43.8 6.4 27.5 58.0 0.70 1.47
Medial Calf (PCalf) 30.9 3.9 22.2 40.7 0.37 1.17
Corrected muscle perimeters (CP) [cm]
Arm (CPArm) 18.2 3.3 11.9 26.2 -
Thigh (CPThigh) 39.5 6.7 23.4 54.0 -
Calf (CPCalf) 27.5 3.9 18.5 34.5 -
-DXA
Bone Mineral Content (kg) 2.1 0.8 0.9 3.6 0.01 0.03
Fat Mass (kg) 6.7 3.7 1.5 21.1 0.22 1.42
ASLTDXA (kg) 18.5 6.6 6.9 30.5 0.03 0.14
ASLTmod1 (kg) 17.8 5.7 6.6 29.5 -
ASLTmod2 (kg) 16.2 5.1 8.1 28.5 -
-Legends: ASLTDXA-Appendicular Lean Soft Tissue measured using DXA; ASLTmod1 and ASLTmod2- Appendicular Lean Soft Tissue, estimated through anthropometric models 1 and 2 proposed by Quiterio et al.².
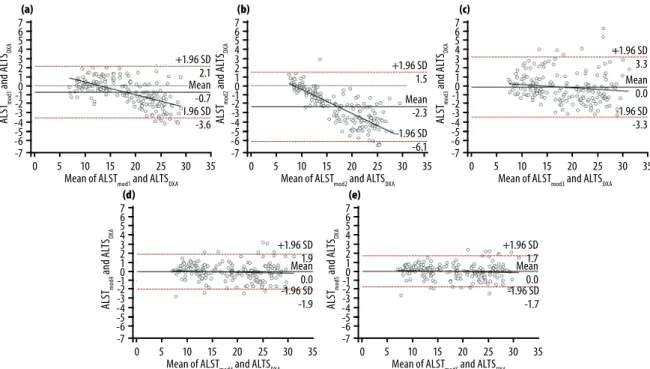
he limits of agreement (Bland-Altman), considering an interval of 95% for both ASLTmod1 and ASLTmod2 (Figure 1), ranged between -2.1 and 3.6 and between -1.5 and 6.1kg, respectively. he Portuguese models ASLTmod1 and ASLTmod2 were more accurate when ALST values were low (below 18 kg and 11 kg, respectively). he regression line concern-ing diferences indicates a tendency of underestimation, as ALST values increased (Figures 1a and b).
he strength of concordance between predicted and actual values was substantial (ρc=0.966; CI 95%: 0.957 to 0.974) for ALSTmod1, but poor for ASLTmod2(ρc=0.878; CI 95%: 0.851 to 0.900). A moderate association was also found (r=0.593; p<0.001) between the diference and mean of methods for ASLTmod1 and ASLTDXA. Association between the diference and mean of the methods for ASLTmod2 and ASLTDXA was even greater (r=0.798; p<0.001).
he same statistical criteria previously used were applied to compare the new models with the actual measures (r², concordance, ρc, association between mean and diferences). All models presented high r² (Table 2), no bias or polarization of the mean (Figures 1c, 1d and 1e), and obtained substantial (ρcmod3=0.967; ρcmod4=989) and almost perfect concordance strength (ρcmod5=0,991); and there was no association between means and diferences of the methods (p>0.05).
he models tested with PRESS statistics presented values close to the ideal values necessary for validation (PRESSmod3=499.84; PRESSmod4=173.57 and PRESSmod5=144.27), with r²PRESS close to 1 (r²PRESSmod3=0.934; r²PRESSmod4=0.977 and r²PRESSmod5=0.981), and decreased SEEPRESS (kg) (SEEPRESSmod3=1.695) or close to zero (SEEPRESSmod4=0.999 and SEEPRESSmod5=0.911).
DISCUSSION
Only one of the anthropometric models designed by Quiterio et al.² to
Table 2. New models to predict Appendicular lean soft tissue (ALSTmod3, ALSTmod4 and ALSTmod5) of Brazilian young athletes.
Models Independent variables β justedr2 ad- SEE (kg) VIF
BM SKFTriceps SKFThigh
ALSTmod3 0.433±0.09* -2.553±0.441 0.935 1.6831 1.000
ALSTmod4 0.429±0.01* -0.337±0.02* 1.233±0.330 0.978 0.9823 1.003
ALSTmod5 0.427±0.01* -0.197±0.03* -0.115±0.02* 1.620±0.305 0.982 0.8897 2.850
Validation of Anthropometric Models of ALST in Young Athletes Abdalla et al.
predict ALST was validated in a sample of young athletes (ASLTmod1). It presented high r², small limits of agreement and its estimates strongly agreed with actual values (ALSTDXA). Nonetheless, the estimates of the two models were prone to error when the individuals presented higher ALST values. Even though model 1 was valid, it presented polarization of the mean, underestimating ALST by approximately 1 kg . he newly proposed models were validated by the PRESS method combining the leave-and-out system with adjusted measures (prediction error) to obtain a more accurate estimation of the models’ predictive performance8. he
new models presented greater agreement even for higher ALST and also performed well in all the criteria considered in the Portuguese models (r², concordance, bias, ρc, association between mean and diferences of methods).
To the best of our knowledge, the models proposed by Quiterio et al.² are the only ones in the literature to estimate ALST (of the upper and lower limbs, concomitantly) of young athletes using anthropometric measures. Other studies proposed anthropometric models to predict ALST, however, involved few students of both sexes (20 boys and 19 girls) who did not practice vigorous exercise1. In some cases, they only estimate the
ALST of the lower limbs of male school-age athletes26. Previous studies1
committed conceptual errors in the nomenclature of the variable measured by DXA, which was considered “Total Skeletal Muscle Mass”, at level IV of human body composition (Organ-tissue level)3. Note that DXA performs measurements only at level II (Molecular level). he ALST estimates achieved with the Portuguese models in this study present r² values (0.96 and 0.95) higher than those found in the Portuguese study (0.91 and 0.93) in the same models 1 and 2, respectively. In the original study, however, the estimates of the model did not present bias toward error when the highest values of ALST were analyzed, as shown by the Bland-Altman plot. Remarkable diferences found for some variables between the Portuguese subjects and those addressed in this study may have contributed to inaccuracy of the models estimating higher ALST (Figure 1a and 1b). On average, the athletes from the Portuguese study were classiied lower on the Tanner scale (1.7±0.7 vs. 3.0±1.3), but they presented higher ALST (23.1±6.4 vs. 18.5±6.6 kg), Fat mass (10.5±7.0 vs. 6.7±3.7 kg), BMI (21.5±2.84 vs. 18.6±2.6), BM (64.5±15.8 vs. 48.6±14.7 kg), and height (1.72±0.15 vs. 1.60±0.20 m). he usual anthropometric diferences between Brazilian and Portuguese18 young individuals partly
explain the population diferences, suggesting ethnic speciicity of models predicting body composition.
Only model 1 proposed by Quiterio et al.² satisfactorily met validity criteria to estimate the ALST of young Brazilian athletes. he accuracy of estimates of the two Portuguese models, however, depended on the magnitude of ALST values. he newly proposed models complied with all validation criteria, presenting highly accurate estimates: r2
PRESS (0.93 to
0.98), low SEEPRESS (0.91 to 1.70kg) and satisfactory concordance regard-ing the ALST of young Brazilian athletes, regardless of the magnitude of the values. Nonetheless, before adopting models intended to predict the body composition of young individuals, one has to consider population diferences that should be considered speciically.
Acknowledgment
We would like to thank the Interunit Doctoral Program in Nursing of the School of Nursing of Ribeirão Preto of the University of São Paulo (EERP-USP) and the Nutrition Course of the University of Ribeirão Preto (UNAERP) for inancial support for the translation of this article. his research was supported by Coordination for the improvement of higher education personnel program (CAPES, Brazil).
REFERENCES
1. Poortmans JR, Boisseau N, Moraine J-J, Moreno-Reyes R, Goldman S. Estimation of total-body skeletal muscle mass in children and adolescents. Med Sci Sports Exerc 2005;37(2):316-22.
2. Quiterio AL, Carnero EA, Silva AM, Bright BC, Sardinha LB. Anthropometric models to predict appendicular lean soft tissue in adolescent athletes. Med Sci Sports Exerc 2009;41(4):828-36.
3. Wang Z-M, Pierson R, Heymsield SB. he ive-level model: a new approach to organizing body-composition research. Am J Clin Nutr 1992;56(1):19-28.
4. Kim J, Shen W, Gallagher D, Jones A, Wang Z, Wang J, et al. Total-body skeletal muscle mass: estimation by dual-energy X-ray absorptiometry in children and adolescents. Am J Clin Nutr 2006;84(5):1014-20.
5. Heymsield SB, Adamek M, Gonzalez MC, Jia G, homas DM. Assessing skel-etal muscle mass: historical overview and state of the art. J Cachexia Sarcopenia Muscle 2014;5(1):9-18.
6. Mitsiopoulos N, Baumgartner RN, Heymsield SB, Lyons W, Gallagher D, Ross R. Cadaver validation of skeletal muscle measurement by magnetic resonance imaging and computerized tomography. J Appl Physiol 1998;85(1):115-22.
7. Lee RC, Wang Z, Heo M, Ross R, Janssen I, Heymsield SB. Total-body skeletal muscle mass: development and cross-validation of anthropometric prediction models. Am J Clin Nutr 2000;72(3):796-803.
8. Machado D, Oikawa S, Barbanti V. he Multicomponent Anthropometric Model for Assessing Body Composition in a Male Pediatric Population: A Simultaneous Prediction of Fat Mass, Bone Mineral Content, and Lean Soft Tissue. J Obes 2013;2013:8.
9. Heymsield S. Human body composition. Champaign: Human kinetics; 2005.
Validation of Anthropometric Models of ALST in Young Athletes Abdalla et al.
CORRESPONDING AUTHOR Dalmo Roberto Lopes Machado Av. Bandeirantes, 3900, Monte Alegre - 14040-907, Ribeirão Preto, SP, Brazil.
Email: [email protected] 11. Wang ZM, Visser M, Ma R, Baumgartner RN, Kotler D, Gallagher D, et al.
Skeletal muscle mass: evaluation of neutron activation and dual-energy X-ray absorptiometry methods. J Appl Physiol 1996;80(3):824-31.
12. Kim J, Wang Z, Heymsield SB, Baumgartner RN, Gallagher D. Total-body skel-etal muscle mass: estimation by a new dual-energy X-ray absorptiometry method. Am J Clin Nutr 2002;76(2):378-83.
13. Tanner J. Growth at Adolescence. Oxford: Blackwell Scientiic Publications; 1962.
14. Martin AD, Spenst LF, Drinkwater DT, Clarys JP. Anthropometric estimation of muscle mass in men. Med Sci Sports Exerc 1990;22(5):729-33.
15. Doupe MB, Martin AD, Searle MS, Kriellaars DJ, Giesbrecht GG. A new formula for population-based estimation of whole body muscle mass in males. Can J Appl Physiol 1997;22(6):598-608.
16. Gobbo L, Ritti-Dias R, Avelar A, Silva A, Coelho-e-Silva M, Cyrino E. Changes in skeletal muscle mass assessed by anthropometric equations after resistance train-ing. Int J Sports Med 2013;34(1):28-33.
17. Gobbo LA, Cyrino ES, Petroski ÉL, Cardoso JR, Carvalho FO, Romanzini M, et al. Validation of anthropometric equations for the estimation of muscular mass by dual energy x-ray absorptiometry in male college students. Rev Bras Med Esporte 2008;14(4):376-80.
18. Madureira AS, Sobral F. Estudo comparativo de valores antropometricos entre escolares brasileiros e portugueses. Rev Bras Cineantropom Desempenho Hum 1999;1(1):53-9.
19. Lohman T, Roche A, Martorell R. Anthropometric standardization reference manual. Champaign: Human Kinetics; 1988.
20. Norton K, Olds T, Albernaz NMFd. Antropométrica: um livro sobre medidas corporais para o esporte e cursos da área de saúde. Porto Alegre: ArtMed; 2005.
21. Bland JM, Altman DG. Statistical methods for assessing agreement between two methods of clinical measurement. Lancet 1986;1(8476):307-10.
22. Lin LI. A concordance correlation coeicient to evaluate reproducibility. Biometrics 1989;45(1):255-68.
23. McBride G. A proposal for strength-of-agreement criteria for Lin’s concordance correlation coeicient. NIWA Client Report: HAM 2005-062.
24. Myers R. Classical and modern regression with applications. Boston: PWS and Kent Publishing Company. Inc; 1990.
25. Holiday DB, Ballard JE, Mckeown BC. PRESS-related statistics: regression tools for cross-validation and case diagnostics. Med Sci Sports Exerc 1995;27(4):612-20.
26. Valente-dos-Santos J, Coelho-e-Silva MJ, Machado-Rodrigues AM, Elferink-Gemser MT, Malina RM, Petroski EL, et al. Prediction equation for lower limbs lean soft tissue in circumpubertal boys using anthropometry and biological maturation. PloS One 2014;9(9):1-9.
27. Modlesky CM, Lewis RD, Yetman KA, Rose B, Rosskopf LB, Snow TK, et al. Comparison of body composition and bone mineral measurements from two DXA instruments in young men. Am J Clin Nutr 1996;64(5):669-76.
28. Pritchard J, Nowson C, Strauss B, Carlson J, Kaymakci B, Wark J. Evaluation of dual energy X-ray absorptiometry as a method of measurement of body fat. Eur J Clin Nutr 1993;47(3):216-28.
29. Diessel E, Fuerst T, Njeh C, Tylavsky F, Cauley J, Dockrell M, et al. Evaluation of a new body composition phantom for quality control and cross-calibration of DXA devices. J Appl Physiol 2000;89(2):599-605.