2º CICLO DE ESTUDOS
MESTRADO EM INFORMÁTICA MÉDICA
A Bayesian approach to data
optimization in BreastCare software
Diana Silva Soares Ribeiro
M
A Bayesian approach to data
optimization in BreastCare software
Diana Silva Soares Ribeiro
Dissertação do 2º Ciclo de Estudos Conducente ao Grau de Mestre em Informática
Médica
Trabalho realizado sob a orientação do Professor Doutor Pedro Pereira Rodrigues
e Mestre Daniela Ferreira-Santos
iii DISSERTATION TITLE:
▪ A Bayesian approach to data optimization in BreastCare software
LOCAL AND DATE: ▪ Porto, September of 2019
PARTICIPATING INSTITUTIONS: ▪ Faculty of Medicine Porto University (FMUP)
▪ Centro Hospitalar Universitário de São João (CHUSJ)
RESEARCHER:
▪ Diana Silva Soares Ribeiro ▪ [email protected]
▪ Licentiate degree in Radiotherapy
ADVISER:
▪ Pedro Pereira Rodrigues ▪ [email protected]
▪ Assistant Professor on Department of Community Medicine, Information And Health Decision Sciences
CO-ADVISER:
▪ Daniela Ferreira-Santos ▪ [email protected] ▪ Master in Medical Informatics
Acknowledgments
First, allow me to thank my supervisor and professor, Pedro Pereira Rodrigues who always believed me and my capacities to reach this Master degree, and always backed me up. Thank you for your knowledge and expertise!
To my co-supervisor, Daniela Ferreira-Santos. She accepted this challenge without hesitation, defied me to reach the best version of myself during this second year and teach me not to accept less than greatness. For all knowledge, persistence and patience, thank you. I will always be thankful.
To Berta Sousa. She was the one that selected the inclusion variables of BreastCare software. Thank you for all the time spared with my questions.
To the Breast Unit of Centro Hospitalar Universitário de São João, especially to Doctor José Luís Fougo, coordinator of Breast Unit, and Inês Moreira, Radiographer in the Breast Unit, that kindly support our data collection.
To my family, parents and brother. They were the ones that supported my desire to improve my academical path and those who have never given up on me, so thank you. They are the solid rescue at in every stage in my life.
To my beloved friends who encouraged me to go ahead in this final moment, never forgetting my master colleagues, teachers, the CINTESIS department, and co-workers from Portuguese Institute of Oncology - Porto.
At last but not the least, to all those who have crossed my path, and have left some of their wisdom and experience, thank you.
"It always seems impossible until it's done." Nelson Mandela
v
Abstract
Introduction: Nowadays, cancer is a major burden of disease worldwide. Each year, tens of millions of people are diagnosed with cancer around the world, and more than half die, becoming important the surveillance of the population and the registration of the information about the disease. Concerning breast cancer, it was developed a software to fully supports the clinical activities of breast pathology, named BreastCare. This software does not have a tool to optimize the data introduction, leading to several insertion errors.
Objective: Develop and evaluate the performance of a Bayesian approach that could optimize data introduction in BreastCare software by giving the users a recommendation.
Methods: To develop this research was used the “Knowledge Discovery in Databases” approach. This approach is a process that includes data preparation and selection, data transformation, data mining techniques as Bayesian networks and interpretation of results. For this research was required a dataset from BreastCare software, provided by VitualCare, that’s included 1653 patients since January of 2001 and September of 2018, from Centro Hospitalar Universitário de
São João. To overcome the missing data in BreastCare software, we collected reports to partially fill
the imagiology section and applied imputation process. In the fulfil dataset, we applied the hill-climbing algorithm, to learn the model structure. The model's structure was applied to the original dataset and posteriorly evaluate the model performance assessing the measures for seven variables: sensitivity, specificity, positive predict value and negative predict value. Lastly an internal validation were performed using the k-fold cross-validation.
Results and discussion: The model was done using twenty-seven variables with the hill-climbing algorithm, however only seven of them have been used to evaluate the model. In the first assessment performed we reached a sensitivity of 87.7% to BI-RADS classification and 8.3% to ultrasound. Relatively to the positive predictive value a 100% was achieved in diagnosis and the lowest was ultrasound with 38.7%. When submitted the cross-validation, our model continues to have a good sensitivity and positive predictive value.
Conclusion: BreastCare software does not have a validated method to optimize the data insertion, so we think that our model will be one valid method to implement and it will decrease the missing values thought the alerts given to the user.
Key words: breast cancer, BreastCare software, bayesian approach, sensitivity and positive predictive value
vii
Resumo
Introdução: Atualmente, o cancro representa cerca de 71% das mortes a nível mundial. Todos os anos, a incidência de novos casos aumenta assim como a taxa de mortalidade. Torna-se importante, então, criar programas que permitam dar suporte ao registo de todas as informações por parte dos profissionais de saúde. No que respeita o cancro da mama foi desenvolvido um software que dá suporte às atividades clínicas desta patologia, BreastCare software. Este software não apresenta uma ferramenta que permita otimizar a introdução dos dados, levando a erros de inserção.
Objetivo: Desenvolver e avaliar a performance de uma abordagem Bayesian que poderá otimizar a introdução de dados no BreastCare software, através de um sistema de recomendações dadas aos profissionais de saúde.
Material e Métodos: Os dados foram recolhidos retrospetivamente, a partir do BreastCare
software num total de 1653 doentes, de janeiro de 2001 a setembro de 2018, no Centro Hospitalar
Universitário de São João. Uma vez que a base de dados continha elevadas percentagens de dados em falta, foi realizada uma recolha no serviço de Imagiologia, preenchendo assim a secção de Imagiologia no BreastCare software. Após uma nova análise da percentagem de dados em falta, eliminamos as variáveis que apresentavam valores de 100% de dados em falta e nas restantes realizamos uma imputação de dados. Para a estrutura do modelo ser aprendida, aplicamos o algoritmo hill-climbing na base de dados imputada. Uma vez aprendida a estrutura do modelo, foi aplicada na base de dados original para posterior avaliação do modelo. A sensibilidade e valor preditivo positivo foram analisados para determinar a validade dos modelos. Por fim, foi realizada uma validação cruzada.
Resultados: O modelo foi criado através da utilização de vinte e sete variáveis, contudo apenas sete permitiram avaliar o modelo. Numa primeira avaliação foi atingida uma sensibilidade de 87.7% na classificação de BI-RADS e 8.3% na ecografia mamária. Relativamente aos valores preditivos positivos foi atingido um valor de 100% no diagnóstico e 38.7% na ecografia mamária. Após a validação cruzada, o modelo continua a revelar uma boa sensibilidade e altos valores preditivos positivos.
Conclusão: O BreastCare software não dispõe de nenhum método validado para otimização da introdução de dados, assim pensámos que o nosso modelo poderá ser implementado de forma a diminuir os erros de inserção, através das recomendações dadas.
Palavras-chave: cancro da mama, BreastCare software, redes bayesianas, sensibilidade e valor preditivo positivo
ix
Preamble
In the year 2011, I started to study Radiotherapy at the School of Health - Polytechnic Institute of Porto, and finished in 2015. Then, I joined the Master’s in Medical Informatics, taught both by the Faculty of Medicine and the Faculty of Science of the University of Porto (FMUP & FCUP), in 2016. Nowadays, I am working as a Therapeutic Radiographer in the Portuguese Institute of Oncology in Porto.
At the end of my degree, no opportunities were available in Radiotherapy, so I started a research for a master’s program to give me new tools in health area, which would differentiate me from my colleagues and other health professionals. The Medical Informatics master’s was the answer to improve my health informatics skills and knowledge through a variety of scientific and technical issues, such as computer-based patient records in general practice and hospitals, signal analysis and image processing, decision support systems, information systems and technologies implementation and evaluation. During the Master´s, I had the opportunity to collaborate as a Functional Consultant in HLTSYS -Healthy Systems, a spin-off of the University of Porto (UP) with a focus on computer security in hospital environment. This opportunity allowed me to contact with hospital setting, developing my curiosity towards electronic health records and clinical decision support systems. This curiosity reminded me of BreastCare, a software presented by VirtualCare, another UP spin-off, in the unit of Medical Signals and Imaging, in my first year, in the master’s. This software can register information about symptoms, morphology, site of the disease and data from the screening tests, related to breast cancer. The problem here is that data is missing. Health professionals are not fulfilling the registry, so we thought about joining Bayesian networks to the equation, to solve the problem.
Index
1. Introduction ... 17 2. Aim ... 20 3. Background ... 22 3.1 Breast Cancer ... 24 3.2. BreastCare software ... 27 3.2.1 Patient View ... 28 3.2.2 Clinical View ... 293.2.3 Pathological Anatomy Section ... 30
3.2.4 Imagiology Section ... 30
3.2.5 Treatment Section... 31
4. Materials and Methods ... 36
4.1. Data collection ... 36
4.2. Data pre-processing ... 36
4.3. Bayesian networks approach ... 37
4.3.1. Learning method and data imputation for learning structure model ... 38
4.3.2. Model performance and validation ... 38
5. Results and Discussion... 41
5.1. Data pre-processing ... 41
5.2. Bayesian networks approach ... 47
5.3. Limitations ... 50
7. Conclusion and Future Work ... 52
8. References ... 54
9. Annexes ... 58
Annexes A - Authorization for study realization ... 59
Table Index
Table 1 – TNM staging system for breast cancer. ... 26 Table 2 – Variables after checking the 100% of missing values. ... 37 Table 3 – Overall description of the variables present in each BreastCare section (original dataset, imputated dataset and model prediction). ... 43 Table 4 – Validity assessment from internal validation. ... 48 Table 5 – Validity assessment from 10 times 2-fold cross validation. ... 48
xiii
Figure Index
Figure 1 – Distribution of cases and deaths for the 10 most common cancers in 2018 for both
sexes. Nonmelanoma skin cancers are included in the “other” category. Source: [5]. ... 22
Figure 2 – Distribution of cases and deaths for the 10 most common cancers in 2018 for males. Nonmelanoma skin cancers are included in the “other” category. Source:[5]. ... 23
Figure 3 – Distribution of cases and deaths for the 10 most common cancers in 2018 for females. Nonmelanoma skin cancers are included in the “other” category. Source:[5]. ... 23
Figure 4 – Female breast anatomy showing the lymph nodes, nipple, areola, chest wall, ribs, muscle, fatty tissue, lobe, ducts, and lobules. Source:[15] ... 24
Figure 5 – BreastCare main menu. ... 28
Figure 6 – BreastCare, patient view, personal data separator. ... 29
Figure 7 – BreastCare, patient view, previous history separator. ... 29
Figure 8 – BreastCare, clinical view, appointments available. ... 29
Figure 9 – BreastCare, clinical view, first clinical assessment separator. ... 30
Figure 10 – BreastCare, pathological anatomy view, report from specimen surgical separator. .... 30
Figure 11 – BreastCare, imagiology view, complementary diagnosis exams separator. ... 31
Figure 12 – BreastCare, treatment view, options available. ... 31
Figure 13 – BreastCare, treatment view, surgery registration separator. ... 31
Figure 14 – BreastCare, radiotherapy view. ... 32
Figure 15 – BreastCare, chemotherapy view. ... 32
Figure 16 – Knowledge discovery... 33
Abbreviations
BN: Bayesian network
BRCA 1: Breast cancer gene 1 BRCA 2: Breast cancer gene 2
CINTESIS: Centre for Health Technology and Services Research CV: Cross-validation
CDS: Centers for Disease Control and Prevention DES: Diethylstilboestrol
EHR: Electronic Health Record EHRs: Electronic Health Records
GLOBOCAN: Global Cancer Observatory HC: Hill climbing
ISH: In situ hybridization k-NN: K-Nearest Neighbours NB: Naïve Bayes
NCDs: Noncommunicable Diseases NPV: Negative Predictive Value
PET-CT: Positron Emission Tomography - Computed Tomography PPV: Positive Predictive Value
RCB: Residual Cancer Burden Calculator TAN: Tree Augmented Naïve Bayes TNM: Tumour, lymph nodes, metastasis
UICC: The Union for International Cancer Control's UP: University of Porto
17
1. Introduction
Nowadays, cancer is a major burden of disease worldwide. Each year, tens of millions of people are diagnosed with cancer around the world, and more than half will die. Globally, cardiovascular disease were responsible for the largest proportions of noncommunicable diseases (NCDs), followed by cancer as the second leading cause of death. Nevertheless, cancer will soon become the first leading of death, given that cardiovascular diseases treatment and prevention had significantly improved in the past years [1], [2]. The Global Cancer Observatory (GLOBOCAN) database, from International Agency for Research on Cancer, showed in 2018, by male and female genders, 52% and 50% new cases and 56% and 44% deaths. Considering only male population, lung cancer (15%) is the most common and the major cause of death (22%), whereas in female population is breast cancer (24% and 15%, respectively) [3]–[5].
One way to detect cancer in earlier stages can be reached by a national screening program were health professionals can register and follow-up patients, saving all the clinical information on a digital database [6]. For a long period of time the only option for registering information about patients was through paper. When electronic health records (EHRs) were created some advantages became obvious on clinical, organizational and societal outcomes. For example, in clinical outcomes we saw an improvement in the quality of care, a reduction in medical error and other improvements in patient-level measures that describe the appropriateness of care. Regarding organizational outcomes the inclusion such as items like financial and operational performance, as well as satisfaction among patients and clinicians who use EHRs. Lastly, societal outcomes include being able to conduct research and achieving improvement population health [7].
For all of this, and aiming to assist healthcare providers registering the information about patients, BreastCare software was developed and implemented, to fully support the clinical activities of breast cancer, combining clinical appointments, anatomy pathology, imagiology, treatment and administrative tasks. It allows different providers to register all the information for a patient in one application. This solution was designed by Virtual Care (VC), a start-up hosted at the University of Porto.
To improve and optimize the data introduction on this software, this thesis proposes a Bayesian approach. Bayesian networks (BN) have emerged in recent years as a powerful data mining technique for handling uncertainty in complex domains and a fundamental technique for pattern recognition and classification, representing the joint probability distribution and domain (or expert) knowledge in a compact way and providing a flexible representation that allows researchers to specify dependence and independence of variables through the network structure [8]. Currently, some researchers have been applying Bayesian approach’s owing to complex
challenges of health domain [9], [10] since it diagnosis, treatment outcomes [11], prognosis of the disease [12] and adverse drug reaction [13].
19
2. Aim
This dissertation intends to develop a Bayesian model, that could optimize data introduction on BreastCare software, by giving to users a filling recommendation. This recommendation aims to reduce error insertion or missing information, taking advantages in adding of value to the breast cancer hospital database, improving research and knowledge regarding the disease.
21
3. Background
Noncommunicable diseases (NCDs) can be recognized as chronic diseases, that include cardiovascular diseases, cancers, chronic respiratory diseases and diabetes, as result of a combination of genetic, physiological, environmental and behaviour factors. Now, they are responsible for 71% of all global deaths, and cancer is expected to rank as the leading cause of death and the single most important barrier to increasing life expectancy in the 21st century [3].
Cancer or malignant tumours or even neoplasms is a generic term for a large group of diseases characterized by the growth of abnormal cells beyond their usual boundaries that can then invade adjoining parts of the body and/or spread to other organs [14].
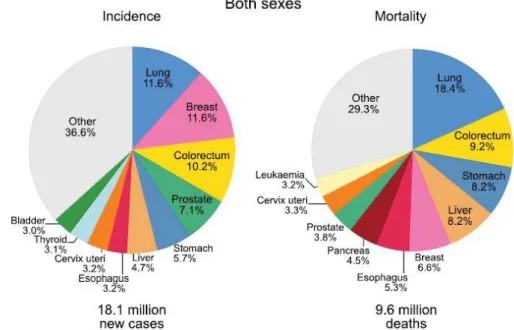
Cancer is the leading cause of death globally and in 2018, based on the Global Cancer Observatory (GLOBOCAN) database, there were about 18,078,957 new cancer cases in the world, of these 9,456,418 (52%) were male and 8,622,539 (48%) were female. The number of deaths caused by cancer worldwide was 9,555,027 among which 5,385,640 (56%) were male and 4,169,387 (44%) were female, in the same year. In total, lung and breast cancer are the most newly diagnosed cancers (12%) and lung cancer as the leading cause of cancer death (18%), as shown in figure 1. The slice describes as “other” relates to cancers that go from 0.1% to 2.8%, including a total of 24 cancers types [3]–[5].
Figure 1 – Distribution of cases and deaths for the 10 most common cancers in 2018 for both sexes. Nonmelanoma skin cancers are included in the “other” category. Source: [5].
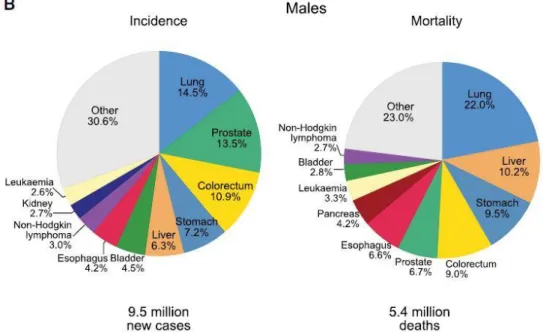
23 Among males, the incidence of lung cancer remains in 15%, followed by prostate (14%) and colorectal cancer (11%), concerning the leading cause of mortality lung cancer continues on first of all (22%), along with liver cancer (10%) and stomach cancer (10%), as we can see in figure 2. In females, breast cancer is the most commonly diagnosed cancer reaching 24%, followed by colorectum cancer (10%) and lung cancer (8%). Regarding to mortality, breast cancer leads the rates (15%), followed by lung (14%) and colorectum (10%), as shown in figure 3 [3]–[5].
Figure 2 – Distribution of cases and deaths for the 10 most common cancers in 2018 for males. Nonmelanoma skin cancers are included in the “other” category. Source:[5].
Figure 3 – Distribution of cases and deaths for the 10 most common cancers in 2018 for females. Nonmelanoma skin cancers are included in the “other” category. Source:[5].
Nevertheless, breast cancer diagnosis and mortality differs across countries. This aspect refers to the degree of economic, social and lifestyle development and cancer registry, once in some low and middle-income countries this aspect is not taken into account [3], [4].
3.1 Breast Cancer
The breast is highly complex. It goes through more changes than any other part of the human body – from birth, puberty, pregnancy and breastfeeding, right through menopause [15]. Breast tissue extends from the collarbone, to lower ribs, sternum (breastbone) and armpit. Each breast contains 15-20 glands called lobes. These lobes are connected to the nipple by 6-8 tubes called ducts. The breast and armpit contain lymph nodes and vessels carrying lymph fluid and white blood cells. Much of the rest of the breast is fatty tissue [15], as shown in figure 4. Breast tissue can develop abnormalities that are sometimes malignant [16], [17]. Breast cancer starts when the cells in the breast begin to grow out of control, and usually form a tumour. Over time, cancer cells can invade nearby healthy breast tissue and make their way into the underarm lymph nodes [17], and if cancer cells get into the lymph nodes, they then have a pathway into other parts of the body [18]. Usually breast cancer either begins in the cells of the lobules, which are the milk-producing glands, or the ducts, the passages that drain milk from the lobules to the nipple. Less commonly, breast cancer can begin in the stromal tissues, which include the fatty and fibrous connective tissues of the breast [18], [19].
Figure 4 – Female breast anatomy showing the lymph nodes, nipple, areola, chest wall, ribs, muscle, fatty tissue, lobe, ducts, and lobules. Source:[15]
25 Approximately 2,1 million new cases globally in 2018, accounting for 24% of all new cases of cancer in women [4], [20]. Breast cancer can present different symptoms, namely painless lump, breast pain or heaviness, persistent changes, such as swelling, thickening, or redness of the skin, and nipple abnormalities such as spontaneous discharge (especially if bloody), erosion, or retraction [19]. However, sometimes the cancer spreads to underarm lymph nodes, not large enough to be felt, or even being too small, not producing symptoms, making essential the screening and early diagnoses.
Aiming to understand how breast cancer appears, Centers for Disease Control and Prevention (CDC) created guidelines enumerating the risk factors, as you can see below [18], [21]. Risk factors that can’t be changed
o Getting older:
- the risk for breast cancer increases with age; most breast cancers are diagnosed after age 50;
o Genetic mutations: inherited changes (mutations) to certain genes, such as BRCA1 and BRCA2. Women who have inherited these genetic changes are at higher risk of breast and ovarian cancer;
o Reproductive history: early menstrual periods before age 12 and starting menopause after age 55 expose women to hormones longer, raising their risk of getting breast cancer;
o Personal history of breast cancer or certain non-cancerous breast diseases: women who have had breast cancer are more likely to get breast cancer a second time. Some non-cancerous breast diseases such as atypical hyperplasia or lobular carcinoma in situ are associated with a higher risk of getting breast cancer;
o Having dense breasts: dense breasts have more connective tissue than fatty tissue, which can sometimes make it hard to see tumours on a mammogram;
o Family history of breast cancer: a woman’s risk for breast cancer is higher if she has a mother, sister, or daughter (first-degree relative) or multiple family members on either her mother’s or father’s side of the family who have had breast cancer. Having a first-degree male relative with breast cancer also raises a woman’s risk;
o Previous treatment using radiation therapy: women who had radiation therapy to the chest or breasts (like for treatment of Hodgkin’s lymphoma) before age 30 have a higher risk of getting breast cancer later in life;
o Women who took the drug diethylstilbestrol (DES), which was given to some pregnant women in the United States between 1940 and 1971 to prevent miscarriage, have a higher risk. Women whose mothers took DES while pregnant with them are also at risk.
Risk factors that can be changed:
o Not being physically active: women who are not physically active have a higher risk of getting breast cancer;
o Being overweight or obese after menopause: older women who are overweight or obese have a higher risk of getting breast cancer than those at a normal weight;
o Reproductive history: having the first pregnancy after age 30, not breastfeeding, and never having a full-term pregnancy can raise breast cancer risk;
o Taking hormones: some forms of hormone replacement therapy (those that include both estrogen and progesterone) taken during menopause can raise risk for breast cancer when taken for more than five years. Certain oral contraceptives (birth control pills) also have been found to raise breast cancer risk.
Nevertheless, some still have breast cancer independently of having or not a risk factor [21]. That is why is so important to bet in early diagnosis strategies, focus on providing timely access to cancer treatment, reducing barriers to care and/or improving access to effective diagnosis services.
Screening as the goal of increase the proportion of breast cancers identified at an early stage, allowing for more effective treatment used and reducing the risks of death [19], [22]. Screening in breast cancer consist in testing patients identifying cancers before any symptoms appear. Various methods have been evaluated as breast cancer screening tools, including mammography, breast ultrasound, clinical breast examination and breast self-exam [22]. Most masses seen on a mammogram and most breast lumps turn out to be benign (not cancerous), do not grow uncontrollably or spread and are not life-threatening. Depending on the characteristics of the findings in images, the masses could suggest malignancy or benignity. When cancer is suspected, microscopic analysis of breast tissue is necessary for a diagnosis and to determine the extent of spread (stage) and characterize the type of the disease [19].
There are several staging systems and the most widely used is TNM Staging System. This is globally recognised as a standard for classifying the extent of spread of tumour; the others staging systems are specific to a particular type of cancer, such as FIGO staging system for classifying gynaecological cancers. TNM Staging System uses information on tumour size and how far it has spread within the breast and to adjacent tissues (T), the extent of spread to the nearby lymph nodes (N), and the presence or absence of distant metastases (spread to distant organs) (M) [19]. Once the T, N, and M are determined, a stage of 0, I, II, III, or IV is assigned. Table 1 describes the staging system [19].
Table 1 – TNM staging system for breast cancer.
Stage TNM Definition
0 Tis, N0, M0 Stage zero (0) describes disease that is only in the ducts and lobules of the breast tissue and has not spread to the surrounding tissue of the breast. It is also called non-invasive cancer. IA T1, N0, M0 The tumour is small, invasive, and has not spread to the lymph nodes. IB T0 or T1, N1, M0
Cancer has spread to the lymph nodes and the cancer in the lymph node is larger than 0.2 mm but less than 2 mm in size. There is either no evidence of a tumour in the breast or the tumour in the breast is 20 mm or smaller.
IIA
Any 1 of these conditions:
T0, N1, M0 There is no evidence of a tumour in the breast, but the cancer has spread to 1 to 3 axillary lymph nodes. It has not spread to distant parts of the body.
T1, N1, M0 The tumour is 20 mm or smaller and has spread to the axillary lymph nodes. T2, N0, M0 The tumour is larger than 20 mm but not larger than 50 mm and has not spread to the axillary lymph nodes.
27
IIB
Either of these conditions:
T2, N1, M0 The tumour is larger than 20 mm but not larger than 50 mm and has spread to 1 to 3 axillary lymph nodes. T3, N0, M0 The tumour is larger than 50 mm but has not spread to the axillary lymph nodes. IIIA
T0, T1, T2 or T3, N2, M0
The cancer of any size has spread to 4 to 9 axillary lymph nodes or to internal mammary lymph nodes. It has not spread to other parts of the body.
T3, N1, M0 May also be a tumour larger than 50 mm that has spread to 1 to 3 axillary lymph nodes. IIIB T4; N0, N1 or N2; M0
The tumour has spread to the chest wall or caused swelling or ulceration of the breast or is diagnosed as inflammatory breast cancer. It may or may not have spread to up to 9 axillary or internal mammary lymph nodes. It has not spread to other parts of the body.
IIIC
any T, N3, M0
A tumour of any size that has spread to 10 or more axillary lymph nodes, the internal mammary lymph nodes, and/or the lymph nodes under the collarbone. It has not spread to other parts of the body.
IV (metastatic) any T, any N, M1
The tumour can be any size and has spread to other organs, such as the bones, lungs, brain, liver, distant lymph nodes, or chest wall).
Depending of the stage, cancer treatment requires careful consideration of evidence-based options, given the resources available which can include more than one of the major therapeutic modalities: surgery, radiotherapy, chemotherapy and biological therapy. Combined modality therapy requires close collaboration among the entire cancer care team and should be delivered in an integrated, people-centred manner, with the possibility of a shared decision-making that considers patient preferences [14].
Another topic related to breast cancer is it prognosis. The prognosis of breast cancer is strongly influenced by the stage of the disease – that is, the extent or spread of the cancer when it is first diagnosed. Survival rates for breast cancer vary worldwide, but in general rates have improved. This is happening because breast cancer is diagnosed at an earlier and localised stage in nations where populations have access to medical care and because progressive improvement in treatment strategies [20].
3.2. BreastCare software
In breast cancer, as others, having all the information about the patient is essential. To do so, in several Portuguese hospitals, BreastCare software is available, powered by Virtual Care (VC). VC is a start-up created in Centre for Health Technology and Services Research (CINTESIS) and hosted at the University of Porto. VC is a Portuguese company focused in the development of
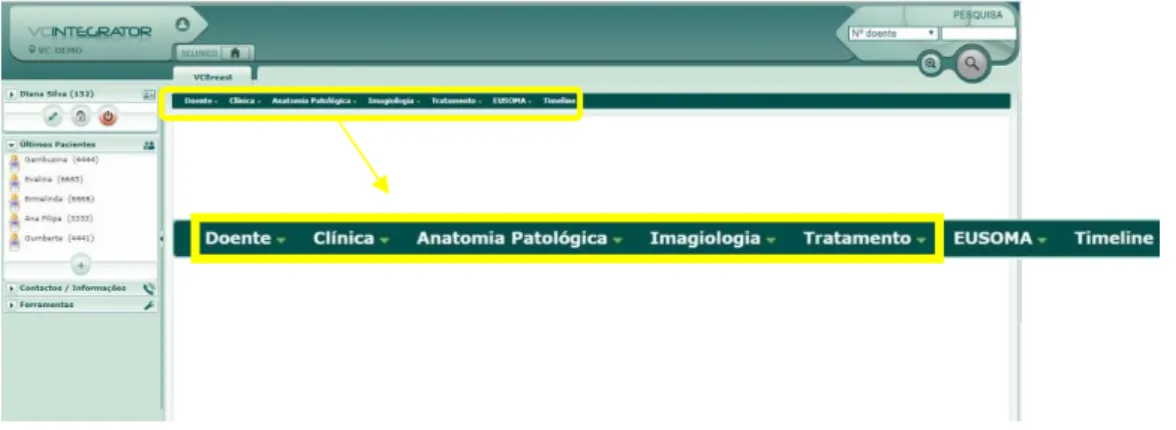
quality and innovative clinical applications. BreastCare software attends the needs of all health professionals, since registration to follow-up, including screening, diagnosis and treatment options. BreastCare software is divided in seven main views: “Patient”, “Clinical, “Pathological Anatomy”, “Imagiology”, “Treatment”, “EUSOMA” and “Timeline”, illustrated in figure 5. The EUSOMA and Timeline views will not be described because no variables of interest are described for this dissertation. EUSOMA refers to the standards set implemented by European Society of Breast Cancer Specialists and Timeline presents a chronology of the patient path.
As we mentioned before, BreastCare software was developed by a Portuguese company in Portuguese hospitals, which means that the software is written in Portuguese. To facilitate the comprehension of the readers, we have created a subsection, in Annexes (B) “BreastCare software variables”, that translate the text in the images to English.
Figure 5 –BreastCare main menu.
To better understand BreastCare software, we created below a workflow as if a physician is entering a record at a new daily consultation.
A female patient enters the consultation room. My first step is to open BreastCare software and check if the patient already exists in the software using the ID number available on the right superior corner. If not, I have to create a new patient in the “Patient view”.
3.2.1 Patient View
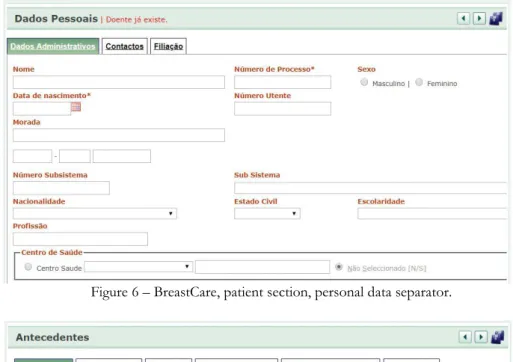
In the view “Patient”, I have the ability and the obligation to insert personal information such as name, address, data of birth, nationality, contacts and filiation, as shown in figure 6. Afterwards, I have to fill the first separator that is “Previous History”; consists in exploring the clinical data of the patient, registering comorbidities, medications, previous surgeries, family history, and observations, as demonstrated in figure 7. When all is filled, I can go to the “Clinical” view.
29
3.2.2 Clinical View
“Clinical” view is created to record and support the different medical appointments (figure 8). In the first clinical appointment, I can and should perform physical assessment and prescribe the complementary diagnostic exams that the patient needs, when she needs it (figure 9). After the complementary diagnostic exams are ready, the views “Pathological Anatomy” (figure 10) and “Imaging Screening” (figure 11) are completed with the information contained in the reports. For the next medical appointment, “Diagnoses Appointment”, the results from the complementary diagnostic exams are available and I should make a clinical decision treatment or ask for a “Multi-Disciplinary Team Appointment” with other colleagues to support the clinical decision treatment. When patient starts the prescribed treatment a “Follow-up Appointment” is marked to check-up.
Figure 7 – BreastCare, patient section, previous history separator.
Figure 8 – BreastCare, clinical section, appointments available. Figure 6 – BreastCare, patient section, personal data separator.
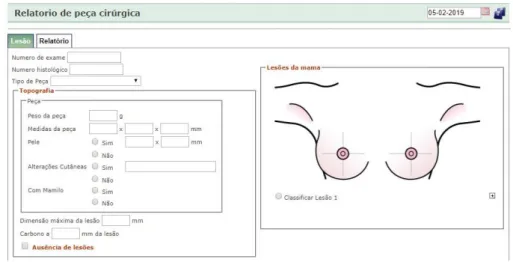
3.2.3 Pathological Anatomy View
“Pathological Anatomy” view came filled, from the department, and depends from the different methods used to scan the disease. In this view, I can save more than one lesion and spot it in a breast mock-up, in the same report. There are transverse specifications for the methods used to scan the disease like exam number, type of the specimen, weight, size and skin changes.
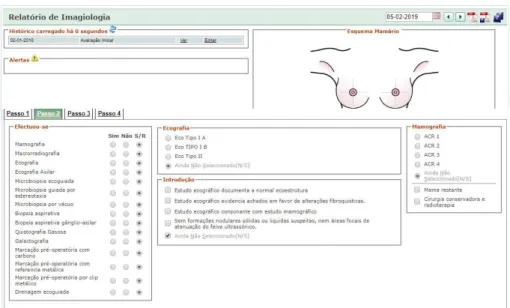
3.2.4 Imagiology View
Regarding “Imagiology” view, it allows me to see the historical path from imagiology department, choose the complementary diagnosis exams that was done by the patient and the results. It is also possible to see the breast mock-up already marked with the lesion.
Figure 9 – BreastCare, clinical section, first clinical assessment separator.
31
3.2.5 Treatment View
Concerning the “Treatment” view there are three sub-views: “Surgery Registering”, “Radiotherapy” and “Chemotherapy”. All of these sub-views have available fields to complete about each procedure, and should be filled by the specialist physician from each department.
“Surgery Registering” sub-view allows the user to choose different types of surgery, as breast surgery, armpit surgery, breast reconstruction, gynaecological surgery, as it enables to register the complications and elaborate the report with the previous selections.
Figure 12 – BreastCare, treatment section, options available.
Figure 13 – BreastCare, treatment section, surgery registration separator. Figure 11 – BreastCare, imagiology section, complementary diagnosis exams separator.
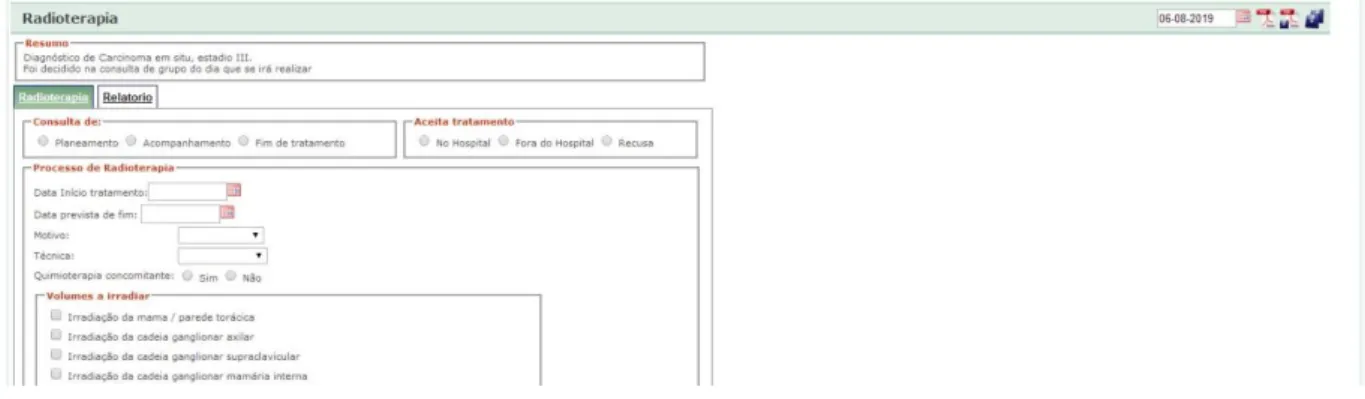
In “Radiotherapy Treatment” sub-view it’s possible to choose different kind of appointments depending on the phase of Radiotherapy, starting with the “Planning Appointment”, were the physician could select if the patient agrees to be treated at the institution or in another, or on other hand if the patient refuses treatment. Some information should be noted as start date and expected end date of the treatment, intention, techniques for delivering radiotherapy. It is important to check if the patient is doing chemotherapy concomitant, because could affect the starting date. After this, the physician could register the irradiated volume, the boost volume, dose total and the number of fractions. If the patient already started the treatment, the appointment should be marked as “Weekly Appointment”, and if the end date is near the appointment should be “Follow-up Appointment”.
Regarding to “Chemotherapy Treatment” sub-view it is composed by “Chemotherapy”, “Hormonotherapy” and “Immunotherapy”, and is able to add a start and an end date, as to select the therapeutic scheme. As in the previous sub-views, I can select if the patient accepts or refuses the treatment, and if the treatment is suspended because of toxicity.
Such as BreastCare, systems which do not only provide information, but also can help the physician to take decision participating in simple decision-making activities of any organization [23]. To make a recommendation of decision, this systems employ data mining tools and do not require a priori knowledge of the decision maker, instead the system is designed to find new and unsuspected patterns and relationships in each set of data; the system then applies this newly discovered knowledge to a new set of data [24]. Data mining tools are defined as the discovery of
Figure 14 – BreastCare, radiotherapy section.
33 knowledge from data through the process of applying computer based information system [25], [26], aiming the extraction of data into meaningful information [24]. The data mining process consists of five steps which are described below [8], [27] (figure 16);
1. problem identification involves defining the problem and determine the project goals, identifying key people, and learning about current solutions to the problem.
2. data extraction: this step starts with initial data collection and familiarization with the data. Specific aims include identification of data quality problems, initial insights into the data and detection of interesting data subsets.
3. data pre-processing: covers all activities needed to construct the final dataset.
4. data mining: techniques are selected and applied to modelling the pre-processed data. There are different ways of modelling the data, such as classification, clustering, association rules, prediction and others.
5. pattern interpretation and evaluation: evaluation includes understanding the results, checking whether the discovered knowledge is novel and interesting, interpretation of the results by domain experts, and checking the impact of the discovered knowledge.
Figure 16 – Knowledge discovery
In the healthcare setting, data mining is well suited to provide recommendations. Healthcare organizations face increasing pressure to improve the quality of care while reducing costs. Because of the large volume of data generated in healthcare settings, it is not surprising that healthcare organizations have been interested in data mining to enhance physician practices, disease management, and resource utilization [24]. However, this systems don’t shall be substituted to physicians decisions, however, these can help clinical decision-making especially in critical and vital situations [23].
To have quality data on software, we need electronic health record (EHR). EHR is a powerful tool to improve health care quality while reducing its costs; as a longitudinal repository of patient diagnoses, treatments, and responses to treatment. Electronic health records (EHRs) are also being increasingly recognized as an important tool for research [28]. A formal definition for EHR “is an
the key administrative clinical data relevant to that persons care under a particular provider, including demographics, progress notes, problems, medications, vital signs, past medical history, immunizations, laboratory data and radiology reports” [29], [30].
In the last decade, EHR adoption rates have soared and in 2015, 87% of office-based physicians had adopted EHR [31]. As they can improve the clinician’s workflow, support other care-related activities, directly or indirectly through various interfaces, including evidence-based decision support, quality management, and outcomes reporting. These kind of improvements can promote the decrease incidence of medical errors by improving the accuracy and clarity of medical records, reducing the duplication of the medical exams, delays in treatment, contributing for a better patient care and providing better decisions [29], [30]. Whereas, EHRs have important limitations, namely research using such data sources requires rigorous attention to study design, that is due to most populations captured in EHRs system are highly dynamic with frequent “in and out” migration based on patient choices, employment, insurance, and geography, and this may blind researchers to some types of care. Also, gaps in care records and poorly defined source populations can not only lead to difficulties in inference but may also pose fundamental challenges in identifying (and comparing) appropriate study and target populations [32].
35
4. Materials and Methods
4.1. Data collection
The study included patients records on BreastCare software implemented in Centro Hospitalar
Universitário de São João, from January 2001 to September 2018, provided by Virtual Care (VC). As
previously mentioned, BreastCare software has seven sections, although two of them were not analysed (EUSOMA and Timeline). The other five sections were first checked for missing information, with “Pathology Anatomy” and “Imagiology” were completely empty. To overcome this problem, permission was asked to collect data in these departments of Centro Hospitalar
Universitário de São João, in order to fill and improve our dataset. Only the “Imagiology” department
gave us permission. This thesis was approved by the Ethics Commission of Centro Hospitalar
Universitário de São João, fulfilling the Declaration of Helsinki (annexe A).
4.2. Data pre-processing
In this research, a total of 14,540 observations were collected from BreastCare software, and a pre-processing phase, in R software [33], was performed to eliminate duplicated observations. The duplicated records occurred because of one of the variables - family history. At the consult, when a patient refers to have more than one family member with breast or ovarian cancer history, the patient number duplicates, in the dataset. This is a bug of the software and to solve the problem we had to join equal process numbers, keeping the information related to family history, finishing with 1654 patients, note that some patients had up to 6 family relatives with family history reported. From the “Imagiology” section, we collected from siima software available in Imagiology department, 1654 patients numbers previously obtained in BreastCare software (with one of them being removed from the research once it is a test). We decided to use the patient available information from the first report. These two datasets available were joined by the process number. After merging the datasets, we initiated the analysis with the percentage of missing information of each variable, deleting those who had 100% of missing values. Although these variables were eliminated, we continued to have missing information, as shown in table 2.
37
Table 2 – Variables after checking the 100% of missing values.
Variables Missing (%)
Patient sectio
n Gender Hormonal Status 6 4
Relative with ovarian cancer 42
Relative with breast cancer 16
Clinical s ectio n Diagnosis 81 Stage 92
Discharge for attending physician 80
Imaging Reassessment 93
Surveillance in the breast unit 88
Surgery proposal 76
Referenced for the oncology group appointment 83
Referenced for oncogenetic appointment 94
Referenced for risk appointment 83
Surgery proposal 93 Unilateral surgery 99.6 Bilateral surgery 99.5 Armpit surgery 94 Ima gi olog y sectio n Mammograms 0 Macroradiography 0 Ultrasound 0 Armpit ultrasound 0
Microbiopsy using ultrasound 0
Stereotactic guided microbiopsy 0
Microbiopsy Vacuum-assisted 0
Fine needle aspiration biopsy 0
Lymph node aspiration biopsy 0
Preoperative carbon localization 0
Preoperative marking with metal reference 0
Preoperative marking by metal clip 0
Ultrasound-guided drainage 0 BI-RADS classification 29 Tr ea tment sectio n Hormonotherapy 98
4.3. Bayesian networks approach
A Bayesian network (BN) is a model of uncertain knowledge expression and reasoning based on probability analysis and graph theory. It is represented as a graph of assigned complex causal relationship networks. Each node in the network represents a variable, and the arc between variables expresses the direct causal relationship between the events. Because of the conditional independence of BN, the difficulty of solving a problem can be greatly simplified by considering the finite variables associated with each variable [34].
Naïve Bayes (NB) is a simple learning algorithm that utilizes Bayes rule together with a strong assumption that the attributes are conditionally independent, given the class [35]. Tree augmented Bayesian network (TAN) employs a tree structure, allowing each attribute to depend on the class and at most one other attribute [36]. Hill-climbing (HC) algorithm is an iterative algorithm that
starts with an arbitrary solution to a problem, then attempts to find a better solution by making an incremental change to the solution. If the change produces a better solution, another incremental change is made to the new solution, and so on until no further improvements can be found [37].
4.3.1. Learning method and data imputation for learning structure model
For this research a BN approach with the HC algorithm was chosen as a learning method applied to the dataset. However, to apply the learning method, the criteria of a full dataset has to be reached, once it is required by the BN that we intended to create [38]. We performed an imputation step to achieve a full dataset using k-nearest neighbours (k-NN), which is the process used to determine and assign replacement values for missing data items, being the k-NN a non-parametric method used, that consists of the k closest training examples in the feature space [39]. In this research, we used k=10, which means that the feature space was filled using the ten closest neighbours (closest training examples).
Once the imputation step, the variables “diagnoses” and “BI-RADS Classification” were polynomial and we choose, based on a literature review, the best cut-off point to make them binomial. In “diagnoses”, the sub-items were “without lesion”, “benign” and “malign”, allowing us to join “without lesion” and “benign” in the same item named “no malignant”, opposing to “malign” item. Regarding the “BI-RADS Classification” cut-offs were defined as benign (from category 0 to 3) and malign (above category 4) [40]. Concerning variables “status hormonal”, “stage” and “hormonotherapy” a cut-off point was not possible to establish, making impossible to assess the performance.
4.3.2. Model performance and validation
After our model learns with the imputed dataset, we applied the model to original dataset. To evaluate the performance of the model applied to original dataset, we assessed the performance of seven variables, using the measures of accuracy, sensitivity or recall, specificity, positive predictive value (PPV) or precision and negative predictive value (NPV). The seven variables were chosen based on the prediction of the model in the imputed dataset.
After assessing the performance of each variable, we ran 10 times 2-fold cross-validation technique on the imputed dataset, to internally validate our model using the above-mentioned measures. The reason why we used the imputed dataset holds on a software restriction, that only can do cross-validation using a complete dataset.
The following flow diagram illustrated all the steps take under consideration in the development of this dissertation (figure 17).
39
41
5. Results and Discussion
5.1. Data pre-processing
In BreastCare software, “Patient” section variables missing values varies between 4% in gender and 42% in relative with ovarian cancer. For “Clinical” section, surgery proposal had the lowest value of missing information, while unilateral surgery had the highest (99.6%). Regarding variables obtained from “Imagiology” section, no missing values were found, except for BI-RADS classification (29%). In “Treatment” section, hormonotherapy had 98% of missing information (table 3).
Our pre-processing phase was focused in selecting variables with less than 100% missing values and applying the imputation process, meeting the criteria required by the Bayesian approach. We chose to present the results obtained by separating them in sections.
Originally ”Patient” section, 93.4% (1,544) of our dataset were females, while 0.8% (14) were males and 5.7% (95) had no gender assigned. The proportion of females rises after the imputation to 99.2%, while males values remained the same. The proportion of patients in the several hormonal status, namely pre-menopausal, menopausal, post-menopausal, or nonspecific, suffered no consequences when imputed. Regarding family history, specifically relative with ovarian cancer, 57.5% had a positive result, switching to 100% when imputed, while relative with breast cancer presented 83.8% and after imputation also reached 100%. The last type of cancer was subdivided in bilateral and no bilateral, with bilateral proportion remaining the same after imputation, and the other changes from 81.5% to 97.7% (table 3)..
The “Clinical” section presents a large number of variables. In clinical diagnosis 24 patients (1.5%) had no lesion, 142 (8.6%) had benign lesion and 146 (8.8%) had malign lesion. After imputation, the variable undergoes a change, staying 11% with no lesion associated on clinical diagnosis, 59.5% as benign lesion and 29.5% as malignant. About stage, 8% distributed in: 0 stage (1.2%); stage I (1.6%); stage IA (2.2%); stage IIA (1.9%); stage IIIA (0.1%); stage IIIB (0.1%); stage IV (0.1%) and nonspecific stage (0.5%). The imputed dataset presented some changes, such as in stage 0 (26.5%); stage I (22.6%); stage IA (33.5%); stage IIA (16.2%); and stage IIIA (0.5%) and the remaining stages were the same. Regarding the discharge to attending physician has 9.1% of the patients were discharged to attending physician and 11.4% were not discharged. When imputed, the variable to 58% (discharge to attending physician) and to 42% (no discharge to attending physician). The imaging reassessment presented 7.4% of “yes”. The imputation process only can
model the category “yes”, staying 100% of the dataset with imaging reassessment. Concerning to surveillance in the breast unit 3.3% considered to stay in surveillance and 15.9% did not have to remain in breast unit. After the imputation, the percentage of patients who did not have to remain in surveillance increased to 96.7% and these who need surveillance remained the same. Concerning surgery proposal, 7.9% were proposed to surgery and 15.9% were not. After submitting the variable through the imputation, 24.7% were proposed for surgery and 75.4% were not. From those referred for oncology team appointment 2.9% were proposed for appointment and 14.3% were not. Imputation showed that 5.1% were proposed and 94.9% were not. For oncogenetic appointment, 2% were referred, leading to a 100% of “yes” in this variable after the imputation process. As far as risk appointment is concerned 0.2% were referred to the appointment and 16.4% were not. Subsequently, the percentage of patients who were not referred to the appointment increased to 99.8% while the referred patients remained in 0.2%. In this section, the variable surgery is repeated, however at this moment represents who were proposed for surgery after group appointment, and in the previous section it represents those who were proposed to it by the physician. This variable presented 7.2% patients who undergo for surgery and when submitted to imputation all the patients undergo for surgery (100%). 3.4% were submitted for unilateral surgery and later imputation process makes all patients attributed as “yes” on this variable. Similar to this variable, were the results obtained for bilateral surgery 0.5% of “yes”. As far as armpit surgery is concerning, 5.2% did not go to surgery and 0.4% undergo surgery. After imputation, 0.4% undergo surgery and 99.6% did not (table 3).
The “Imagiology” section had the most complete section, presenting variables with 0% of missing values and only one had to be imputed - BI-RADS classification. Concerning to mammograms, 51.5% have done the screening test; 1.2% undergo macroradiography; 68.4% breast ultrasound and 19.7%armpit ultrasound. Microbiopsy using ultrasound was done by 29.9%, 2.6% used a stereotactic guided microbiopsy, 0.1% a microbiopsy vacuum-assisted, 4.2% a fine needle aspiration biopsy, 3.2% a lymph node aspiration biopsy, 3.5% a preoperative carbon localization, 0.1% a preoperative marking with metal reference, 0.6% a preoperative marking by metal clip, and 0.67% a ultrasound-guided drainage. BI-RADS classification had 28.7% that did not have any information available with the remaining 71% distributed in 9 classifications: 0.8% in BI-RADS 0, 2.8% in BI-RADS 1, 24.3% in BI-RADS 2, 8.7% in BI-RADS 3, 10.3% in BI-RADS 4a, 5.9% in BI-RADS 4b, 5.6% in BI-RADS 4c, 8.3% in BI-RADS 5, and 4.7% in BI-RADS 6. After imputation, the variable classifications rise to 11.6% in BI-RADS 0, 14.6% in BI-RADS 1, 28.5% in BI-RADS 2, 10.0% in BI-RADS 3, 10.6% in BI-RADS 4a, 5.7% in BI-RADS 4c, with the remaining classifications keeping percentages (table 3).
About “Treatment” section, the variable available was hormonotherapy with 0.1% treated with anastrozole, 0.2% with leuprorelin and 2.2% with tamoxifen. When submitted to imputation, this variable suffers changes increasing all percentages (6.1% in anastrozole, 63.8% in leuprorelin and 20.1% in tamoxifen) (table 3).
43 Table 3 – Overall description of the variables present in each BreastCare section (original dataset, imputated dataset and model prediction).
Variables Missing (%) Original n (%) Imputed n (%) HC Prediction n (%)
Patient sectio n Gender 5.7 Female 1,544 (93.4) 1,639 (99.2) 1,653 (100) Male 14 (0.8) 14 (0.8) Hormonal Status 4.1 Pre-menopausal status 907 (54.9) 907 (54.9) 1,126 (68.1) Menopausal status 94 (5.7) 134 (8.1) Post-menopausal status 584 (35.3) 601 (36.4) 527 (31.9) Nonspecific status 1 (0.1) 11 (0.7)
Relative with ovarian cancer 42.5 951 (57.5) 1,653 (100)
Relative with breast cancer 16.2 1,386 (83.8) 1,653 (100)
Bilateral breast cancer 38 (2.3) 38 (2.3)
No bilateral breast cancer 1,348 (81.5) 1,615 (97.7) 1,653 (100)
Clinical s ectio n Diagnosis 81.1 Without lesion 24 (1.5) 182 (11.0) Benign 142 (8.6) 983 (59.5) 1246 (75.4) Malignant 146 (8.8) 488 (29.5) 407 (24.6) Stage 92.3 0 20 (1.2) 438 (26.5) I 27 (1.6) 374 (22.6) IA 36 (2.2) 553 (33.5) 1,653 (100) IIA 32 (1.9) 268 (16.2) IIIA 2 (0.1) 9 (0.5) IIIB 2 (0.1) 2 (0.1) IV 1 (0.1) 1 (0.1)
Clinical
s
ectio
n
Nonspecific stage 8 (0.5) 8 (0.5)
Discharge for attending physician 79.6
Yes 150 (9.1) 958 (58.0) 1,082 (65.5)
No 188 (11.4) 695 (42.0) 571 (34.5)
Imaging Reassessment 92.6 122 (7.4) 1,653 (100.0)
Surveillance in the breast unit 88.2
Yes 55 (3.3) 55 (3.3)
No 140 (15.9) 1,598 (96.7) 1,653 (100)
Surgery proposal 76.2
Yes 131 (7.9) 409 (24.7) 185 (11.2)
No 263 (15.9) 1,247 (75.4) 1,468 (88.8)
Referenced for the oncology group appointment 82.8
Yes 48 (2.9) 84 (5.1)
No 236 (14.3) 1,569 (94.9) 1,653 (100)
Referenced for oncogenetic appointment 93.8
Yes
No 103 (6.2) 1653 (100.0)
Referenced for risk appointment 83.4
Yes 3 (0.2) 3 (0.2) No 271 (16.4) 1,650 (99.8) 1,653 (100) Surgery proposal 92.8 119 (7.2) 1,653 (100.0) Unilateral surgery 96.6 57 (3.4) 1,653 (100.0) Bilateral surgery 99.5 8 (0.5) 1,653 (100.0) Armpit surgery 94.4 Yes 7 (0.4) 7 (0.4) No 86 (5.2) 1,646 (99.6) 1,653 (100)
45 Ima gi olog y sectio n Mammograms 0 Yes 852 (51.5) 852 (51.5) 878 (53.1) No 801 (48.5) 801 (48.5) 775 (46.9) Macroradiography 0 Yes 19 (1.1) 19 (1.1) No 1634 (98.9) 1,634 (98.9) 1,653 (100) Ultrasound 0 Yes 1,130 (68.4) 1,130 (68.4) 1,310 (79.2) No 523 (31.6) 523 (31.6) 343 (20.8) Armpit ultrasound Yes 0 325 (19.7) 325 (19.7) 204 (12.3) No 1,328 (80.3) 1,328 (80.3) 1,449 (87.7)
Microbiopsy using ultrasound 0
Yes 494 (29.9) 494 (29.9)
No 1,159 (70.1) 1,159 (70.1) 1,653 (100)
Stereotactic guided microbiopsy 0
Yes 43 (2.6) 43 (2.6)
No 1,610 (97.4) 1,610 (97.4) 1,653 (100)
Microbiopsy Vacuum-assisted 0
Yes 2 (0.1) 2 (0.1)
No 1,651 (99.9) 1,651 (99.9) 1,653 (100)
Fine needle aspiration biopsy 0
Yes 70 (4.2) 70 (4.2)
No 1,583 (95.8) 1,583 (95.8) 1,653 (100)
Lymph node aspiration biopsy 0
Yes 53 (3.2) 53 (3.2)
No 1,600 (96.8) 1,600 (96.8) 1,653 (100)
Preoperative carbon localization 0
Ima gi olog y sectio n No 1,595 (96.5) 1,595 (96.5) 1,653 (100)
Preoperative marking with metal reference 0
Yes 2 (0.1) 2 (0.1)
No 1,651 (99.9) 1,651 (99.9) 1,653 (100)
Preoperative marking by metal clip 0
Yes 10 (0.6) 10 (0.6) No 1,643 (99.4) 1,643 (99.4) 1,653 (100) Ultrasound-guided drainage 0 Yes 11 (0.7) 11 (0.7) No 1,642 (99.3) 1,642 (99.3) 1,653 (100) BI-RADS classification 28.7 BI-RADS – 0 13 (0.8) 191 (11.6) 1,118 (67.6) BI-RADS – 1 47 (2.8) 242 (14.6) BI-RADS – 2 401 (24.3) 471 (28.5) BI-RADS – 3 143 (8.7) 166 (10.0) BI-RADS – 4a 171 (10.3) 176 (10.6) 535 (32.4) BI-RADS – 4b 97 (5.9) 98 (5.9) BI-RADS – 4c 93 (5.6) 95 (5.7) BI-RADS – 5 137 (8.3) 137 (8.3) BI-RADS – 6 77 (4.7) 77 (4.7) Tr ea tment sectio n Hormonotherapy 97.6 Anastrozole 1 (0.1) 266 (6.1) 10 (0.6) Leuprorelin 3 (0.2) 1,055 (63.8) 1,643 (99.4) Tamoxifen 36 (2.2) 332 (20.1)
47
5.2. Bayesian networks approach
Concerning our model, only previously variables described as dichotomous were used in the evaluation of it, assessing each available variable as each represented the outcome (fulfilling a variable that is missing when a health professional needs help).
Regarding the prediction made by the model (Figure 18) in the imputed data set, “Clinical” section in the imputed dataset we obtained 75.4% no malignant and 24.6% malignant diagnosis; 65.5% discharge and 34.5% no discharge for attending physician; 11.2% surgery proposal and 88.8% were not proposed. From imagiology section, only four variables were predictable, with mammograms prediction being the most similar to the overall dataset, 53.1% for yes and 46.9% for no. In the other hand ultrasound presented the most different results but not so far from the original dataset with 79.2% submitted to ultrasound. Armpit ultrasound with our predict model indicates that 12.3% of the patients undergo the screening test. Remaining the BI-RADS classification as explained before, a cut-off has been done, dividing the classification between 0-3 and 4-6, 67.6% and 32.4% respectively (table 3).
Regarding to the section that was available for the evaluation were “Clinical” and “Imagiology”. Looking at the variables that our model can predict, without ignoring levels, we had inside of “Clinical” section: diagnosis (categorized in no malignant and malignant), discharge to attending physician (yes or no), surgery proposal (yes or no) and in “Imagiology” section mammograms (yes or no), ultrasound (yes or no), armpit ultrasound (yes or no), and BI-RADS classification (3 or 4). For these, an internal validation and cross validation were performed (table 4).
As for as the performance of our model in the seven variables is concerned, in overall, accuracy was higher than 51%, indicating that our HC model can measure the proportion of true positive and true negative results in our dataset. Regarding sensitivity, armpit ultrasound and BI-RADS classification achieved 85.3% and 87.7%, respectively, indicating that when our model makes an suggestion for the diagnosis (no malignant or malignant), it gets it right. All the other variables had high values (>60%), unless surgery proposal, only reached 50.9% of sensitivity. Overall, specificity reached values above 63%, with mammograms and ultrasound armpit only reaching 69% and 63.7%, respectively. However, for our research is important to understand the positive predictive value (PPV), as well as its meaning in our research. The PPV theoretically is the proportion of patients with positive test who actually have the disease, suggesting that if we have a high value of PPV the model will present a good precision to indicating those who have a true positive case. The lowest value of PPV is on armpit ultrasound (38.7%) indicating we achieve more false positive cases than true positives ones. Besides, the discharge for attending physician was 100% PPV. This results can be checked in the table 4.
We performed a 10 times 2-fold cross validation obtaining better performance on the model, since we have used the imputed dataset, reaching sensitivity value for diagnosis (100%), while discharge for attending physician, armpit ultrasound and surgery proposal reached values above 95%. BI-RADS classification had lower sensitivity value (74.8%) (table 5).
Table 4 – Validity assessment from internal validation.
Table 5 – Validity assessment from 10 times 2-fold cross validation.
Variables (% [95% CIAccuracy ]) (% [95% CISensitivity ]) (% [95% CISpecificity ]) (% [95% CIPPV ]) (% [95% CINPV ])
Diagnosis [89.8,92.6] 91.2 [100] 100 [0] 0 [89.8,92.6] 91.2 NA
Discharge for attending
physician [89.5,92.3] 90.9 [99.7,100] 99.9 [0.8,1.8] 1.3 [89.6,92.4] 91 [51.9,56.7] 54.3
Surgery proposal [93.3,95.5] 94.4 [95.8,97.6] 96.7 [67.5,71.9] 69.7 [96.6,98.297.4 [61.1,65.7] 63.4
Variables (% [95% CIAccuracy ]) (% [95% CISensitivity ]) (% [95% CISpecificity ]) (% [95% CIPPV ]) (% [95% CINPV ])
Diagnosis [65.3,69.9] 67.6 [37.2,42] 39.6 [100] 100 [100] 100 [56.7,61.5] 59.1 Discharge to attending physician [73,77.2] 75.1 [75.5,79.5] 77.5 [69.6,74] 71.8 [76.9,80.9] 78.9 [68,72.4] 70.2 Surgery proposal [48.5,53.3] 50.9 [30.1,34.1] 32.4 [84.5,87.9] 86.2 [79.7,83.5] 81.6 [37.7,42.5] 40.1 Mammograms [57.6,62.4] 60 [46.1,50.9] 48.5 [66.8,71.2] 69 [57.5,62.3] 59.9 [56,60.8] 58.4 Ultrasound [64.2,68.8] 66.5 [7,9.6] 8.3 [92.6,95] 93.8 [36.4,41] 38.7 [66.4,70.8] 68.6 Armpit ultrasound [79.2,83] 81.1 [83.6,87] 85.3 [61.4,66] 63.7 [89.3,82.1] 90.7 [48.9,53.7] 51.3 BI-RADS classification [85.6,88.8] 87.2 [86.1,89.3] 87.7 [85.2,88.4] 86.8 [86,89.2] 87.6 [85.3,88.5] 86.9
49 Mammograms [50.6,55.4] 53 [31.1,35.7] 33.4 [69.3,73.7] 71.5 [54.1,58.9] 56.5 [50.9,55.7] 53.3 Ultrasound [67.3,71.7] 69.5 [5.5,7.9] 6.7 [97.9,99.1] 98.5 [57.1,61.9] 59.5 [67.4,71.8] 69.6 Armpit ultrasound [78.5,82.3] 80.4 [97.9,99.1] 98.5 [5.1,7.5] 6.3 [79.3,83.1] 81.2 [47.4,52.2] 49.8 BI-RAS classification [69.4,73.8] 71.6 [72.7,76.9] 74.8 [66,70.4] 68.2 [69.1,73.5] 71.3 [71,75.2] 73.4 NA – Not applicable
Regarding to the literature available about this topic, it was done a research in the databases to find similar studies, in order to compare our methodology and results. We did not find any similar topics, which leads to deduce that our theme can be a good start for further researches.
5.3. Limitations
During this thesis, some barriers were found concerning the dataset. This dataset was extracted from BreastCare software and, as mentioned before, the Pathological Anatomy and Imagiology section were empty. The Imagiology section was quickly overtaken by collecting data from “siima” software, while the Pathological Anatomy section was not. We submitted an authorization request to collect data from the department, but no answer was received, leading to the exclusion of a whole section. Furthermore, the remaining sections in BreastCare were not totally fulfilled presenting several variables one hundred percentage of missing values, which was also a restraint to the analysis.
51
7. Conclusion and Future Work
The results of this dissertation consist of a starting point to create a new tool to optimize data introduction on BreastCare software. Our results showed that this model has a good sensitivity, and when implemented will give recommendations. BreastCare software does not have a validated method to optimize the data introduction, so we think that our model will be a valid method to implement and it will decrease the missing values through the alerts given to the user, being in the overall less time consuming to the health professionals.
More studies are required to a better fit of the model into clinical practice. We need to compare our results to another datasets available in other hospitals by doing an external validation, because there it already implemented. This comparison will be essential to assess the performance of different variables, that weren’t available in the dataset of BreastCare software at Centro Hospitalar Universitário de São João.
53