Correlation of Electrocardiographic Changes with Cardiac Magnetic
Resonance Findings in Patients with Hypertrophic Cardiomyopathy
Gabriela Miana de Mattos Paixão, Horácio Eduardo Veronesi, Halsted Alarcão Gomes Pereira da Silva, José Nunes
de Alencar Neto, Carolina de Paulo Maldi, Luciano de Figueiredo Aguiar Filho, Ibrahim Masciarelli Francisco Pinto,
Francisco Faustino de Albuquerque Carneiro de França, Edileide de Barros Correia
Instituto Dante Pazzanese de Cardiologia, São Paulo, SP – Brazil
Mailing Address: Gabriela Miana de Mattos Paixão •
Rua Maranhão, 1567/302. Postal Code 30150-331, Funcionários, Belo Horizonte, MG – Brazil
E-mail: [email protected], [email protected]
Manuscript received January 17, 2017, revised manuscript September 05, 2017, accepted September 12, 2017
DOI: 10.5935/abc.20170189
Abstract
Background: Electrocardiogram is the initial test in the investigation of heart disease. Electrocardiographic changes in hypertrophic cardiomyopathy have no set pattern, and correlates poorly with echocardiographic findings. Cardiac magnetic resonance imaging has been gaining momentum for better assessment of hypertrophy, as well as the detection of myocardial fibrosis.
Objectives: To correlate the electrocardiographic changes with the location of hypertrophy in hypertrophic cardiomyopathy by cardiac magnetic resonance.
Methods: This descriptive cross-sectional study evaluated 68 patients with confirmed diagnosis of hypertrophic cardiomyopathy by cardiac magnetic resonance. The patients’ electrocardiogram was compared with the location of the greatest myocardial hypertrophy by cardiac magnetic resonance. Statistical significance level of 5% and 95% confidence interval were adopted.
Results: Of 68 patients, 69% had septal hypertrophy, 21% concentric and 10% apical hypertrophies. Concentric hypertrophy showed the greatest myocardial fibrosis mass (p < 0.001) and the greatest R wave size in D1 (p = 0.0280). The amplitudes of R waves in V5 and V6 (p = 0.0391, p = 0.0148) were higher in apical hypertrophy, with statistical significance. Apical hypertrophy was also associated with higher T wave negativity in D1, V5 and V6 (p < 0.001). Strain pattern was found in 100% of the patients with apical hypertrophy (p < 0.001).
Conclusion: The location of myocardial hypertrophy by cardiac magnetic resonance can be correlated with electrocardiographic changes, especially for apical hypertrophy. (Arq Bras Cardiol. 2018; 110(1):52-59)
Keywords: Hypertrophic cardiomyopathy / genetic; Electrocardiography; Magnetic Resonance Spectroscopy.
Introduction
Hypertrophic cardiomyopathy (HCM) is an autosomal dominant disease, characterized by myocardial hypertrophy in the absence of cardiac or systemic diseases.1 In adults, the diagnosis is defined by a diastolic thickness of any ventricular wall ≥ 15 mm measured on any imaging test.2
Electrocardiogram (ECG) is the initial test to be performed when investigating heart diseases. In HCM, the ECG has not a defined pattern, and can show signs of left ventricular overload, presence of q waves, changes in the ST segment, abnormal T waves, or be even normal in 6% of the patients.3
Some specific electrocardiographic findings may suggest the location of hypertrophy, as well as the presence
of fibrosis. Giant inverted T waves (> 10 mm) in the precordial or inferolateral leads suggest apical involvement. Deep q waves in the inferolateral leads with positive T waves are associated with the asymmetric distribution of the HCM, and q waves lasting more than 40 ms relate to fibrosis. The ST-segment elevation in the lateral wall can correlate to small apical aneurysms, which are associated with fibrosis.2 Electrocardiographic patterns similar to that of myocardial infarction in young individuals can precede the echocardiographic evidence of myocardial hypertrophy.4
The electrocardiographic changes can lead to the suspicion of HCM, and together with the clinical history and other imaging tests can establish the diagnosis.
Traditionally, echocardiography is the imaging test of choice to diagnose HCM, because of its wide availability and lower cost. However, the relationship between the electrocardiographic changes and the morphology and severity of myocardial thickness has not been well established when assessed on the echocardiogram.5,6
to visualize on echocardiography, in addition to providing ventricular morphology and function assessment. Detection of delayed contrast-enhancement has prognostic value.2
This study was aimed at correlating electrocardiographic variables with the location of myocardial hypertrophy assessed on cardiac magnetic resonance imaging.
Methods
This is a descriptive cross-sectional study that assessed patients diagnosed with HCM and followed up at the Cardiomyopathy Sector of the Instituto Dante Pazzanese de Cardiologia (IDPC), who underwent cardiac magnetic resonance imaging from January 2012 to September 2015.
The patients’ inclusion criteria were: age over 18 years and diagnosis of HCM confirmed on interpretable ECG and magnetic resonance imaging performed at the Imaging Sector of the IDPC. The exclusion criteria were: age < 18 years; ejection fraction lower than 50% on cardiac magnetic resonance imaging; resistant arterial hypertension; presence of coronary artery disease, characterized by a coronary lesion greater than 50% on angiography; presence of Chagas disease; previous diagnosis of amyloidosis; endomyocardial fibrosis; Fabry disease; presence of definitive pacemaker; and septal myectomy or alcoholization prior to cardiac magnetic resonance imaging.
The HCM database of the Cardiomyopathy Sector of the IDPC was analyzed, and the medical records of 112 patients meeting this study inclusion criteria, which were stored at the Sector of Medical File and Statistics (SAME) of the IDPC, were assessed. After reviewing the medical files, 44 patients were excluded from the study.
The ECGs previously performed for the outpatient clinic visit at the Cardiomyopathy Sector were reviewed by the chief of the Tele-Electrocardiography Sector of the IDPC, in accordance with the 2016 Brazilian Guidelines on ECG Analysis and Report.7 The ECG report comprised the following variables: rhythm, heart’s QRS axis, ventricular and atrial
overloads, intraventricular blocks, presence of strain, R wave size (millimeters) in leads DI, V1, V5 and V6, and T wave size (millimeters) in leads D1, V5 and V6.
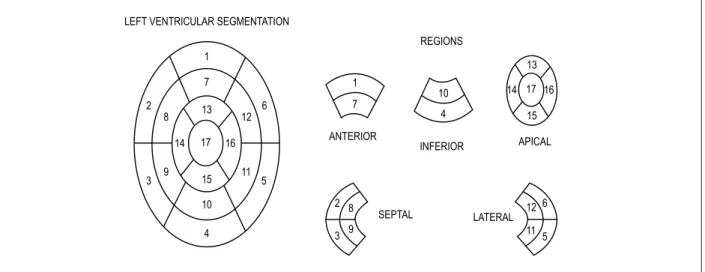
Cardiac magnetic resonance imaging was assessed by the Radiology Team of the IDPC regarding the location of myocardial hypertrophy, based on the segmentation proposed by the American Heart Association,8 and the presence of delayed enhancement, as well as quantification of the fibrosis mass in grams. The 17 segments were grouped into five regions: anterior, inferior, lateral, septal and apical. (Figure 1)
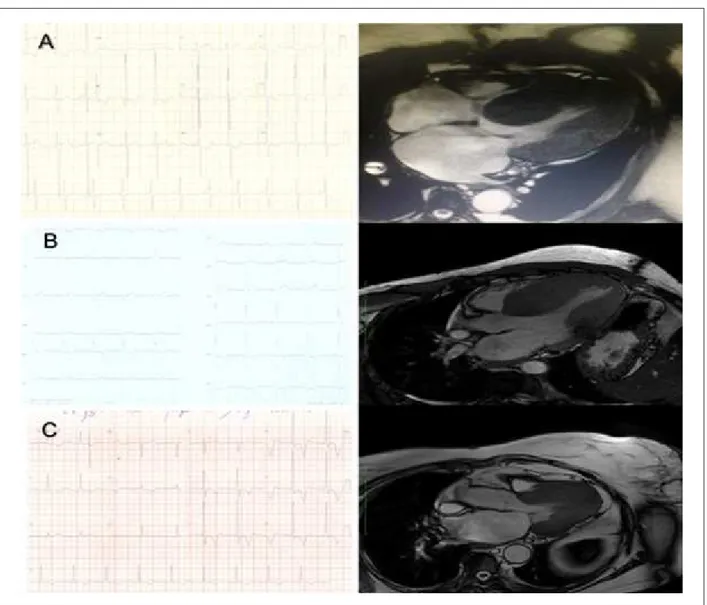
Patients with hypertrophy > 15 mm in at least three of those regions were considered to have concentric hypertrophy. (Figure 2)
Statistical analysis
The electrocardiographic variables previously described were compared with the region of hypertrophy, the presence of delayed enhancement and the amount of fibrosis identified on cardiac magnetic resonance imaging.
Normality of the data was assessed by use of Kolmogorov-Smirnov test, and nonparametric tests were used to compare between the groups. The summary measures median and 25th and 75th percentiles were calculated for the continuous variables, and nonparametric Kruskal-Wallis test was used to check the statistical significance between the groups, followed by two-by-two comparisons (Dunn’s multiple comparison test).
For attribute variables, the results were presented as percentages and frequency. Fisher-Freeman-Halton exact test was used to assess the statistical significance between the groups. Statistical significance level of 5% and 95% confidence interval were adopted.
The findings were recorded in an electronic spreadsheet of Microsoft Office Excel, version 2013e, and the Statistical Package for the Social Sciences (SPSS), version 21.0 for Windows®, was used for analysis.
Figure 1 – Left ventricular segmentation proposed by the American Heart Association. LEFT VENTRICULAR SEGMENTATION
Figure 2 – A) E.D.S., male sex, 35 years. ECG: R wave in D1 of 35 mm, and R wave in V5 of 29 mm. Magnetic resonance imaging compatible with concentric hypertrophy. Fibrosis mass of 128 g (greatest fibrosis mass found of all patients analyzed). B) M.L.S.F., female sex, 60 years. ECG: R wave in D1 of 23 mm, and R wave in V5 of 22 mm. Magnetic resonance imaging compatible with septal hypertrophy. C) P.M., male sex, 77 years. ECG: R wave of 35 mm in V5, and negative T wave of 12 mm with strain pattern. Magnetic resonance imaging compatible with apical hypertrophy.
Results
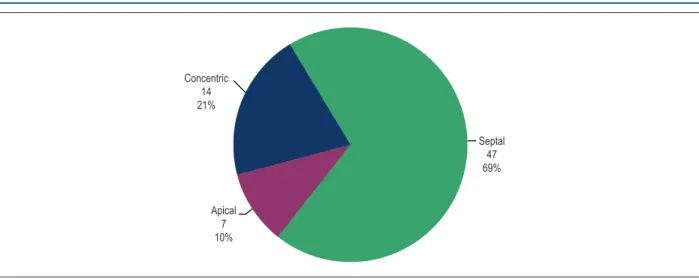
This study assessed 70 patients, 55.9% of the female sex, with a mean age of 51.3 years (ranging from 20 to 81 years). Of the six location patterns of hypertrophy, only three were found: apical (10%), concentric (21%) and septal (69%). (Figure 3)
Most patients (81.4%) showed delayed enhancement on magnetic resonance imaging, and all patients with concentric hypertrophy had fibrosis. In quantifying the mass of fibrosis according to the location of hypertrophy, the highest mean (57.1 g) was observed in concentric hypertrophy as compared to the other locations (p = 0.001). (Table 1, Figure 4)
The concomitant presence of right ventricular hypertrophy on magnetic resonance imaging was found in 35.7% of the
patients with concentric hypertrophy, showing statistical significance (p = 0.0447) as compared to septal and apical hypertrophies.
Patients with apical hypertrophy more frequently had atrial fibrillation (14.3%), preserved heart axis being identified in 100% of the cases. Such findings, however, had no statistical significance (p = 0.7964, p = 0.6730, respectively).
Regarding ventricular overloads, there was higher prevalence of both left and right ventricular overloads (71.4% and 21.4%, respectively) in concentric hypertrophy, with no statistical significance (p = 0.1883, p = 0.2117, respectively).
Figure 3 – Distribution of the patients according to the hypertrophy pattern.
Concentric 14 21%
Apical 7 10%
Septal 47 69%
Left atrial overload was more frequent in apical hypertrophy (42.9%), with no statistical significance (p = 0.4082). However, right atrial overload was rare, being identified in only two patients with septal hypertrophy.
Table 1 – Median and percentiles for mass and percentage of myocardial fibrosis on cardiac magnetic resonance imaging, according to the location of myocardial hypertrophy
Variables Apical Concentric Septal p-value
K-W AxC AxS CxS
Fibrosis mass (grams) Median (P25; P75) 0 (2; 27) 7 (40; 83.5) 0 (3.5; 15) <.0001 0.0210 0.9974 < 0.0001
% Fibrosis Median (P25; P75) 0 (2; 20) 4 (20; 31.75) 0 (3; 13) 0.0014 0.1160 0.9998 0.0010
P25: 25th Percentile; P75: 75th Percentile. P-values: K-W: Kruskal-Wallis test; multiple comparisons between the groups: AxC: Apical x Concentric; AxS: Apical x Septal; CxA: Concentric x Apical (Dunn’s multiple comparison test).
Figure 4 – Means of the mass and percentage of myocardial fibrosis on cardiac magnetic resonance imaging according to the location of myocardial hypertrophy.
Fibrosis mass (g)
Location of hypertrophy Location of hypertrophy
Fibrosis %
Concentric
Septal Apical
Concentric
Septal Apical 60.0
50.0
40.0
30.0
20.0
10.0
0.0
11.2 57.07
11.45
8.4
20.41
7.63 25.0
20.0
15.0
10.0
5.0
0.0
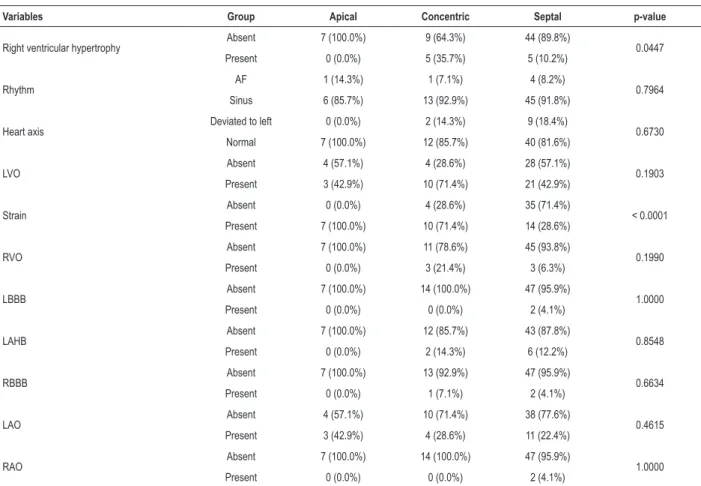
Table 2 – Frequency and percentages for the attribute variables according to the location of myocardial hypertrophy
Variables Group Apical Concentric Septal p-value
Right ventricular hypertrophy Absent 7 (100.0%) 9 (64.3%) 44 (89.8%) 0.0447
Present 0 (0.0%) 5 (35.7%) 5 (10.2%)
Rhythm AF 1 (14.3%) 1 (7.1%) 4 (8.2%) 0.7964
Sinus 6 (85.7%) 13 (92.9%) 45 (91.8%)
Heart axis Deviated to left 0 (0.0%) 2 (14.3%) 9 (18.4%) 0.6730
Normal 7 (100.0%) 12 (85.7%) 40 (81.6%)
LVO Absent 4 (57.1%) 4 (28.6%) 28 (57.1%) 0.1903
Present 3 (42.9%) 10 (71.4%) 21 (42.9%)
Strain Absent 0 (0.0%) 4 (28.6%) 35 (71.4%) < 0.0001
Present 7 (100.0%) 10 (71.4%) 14 (28.6%)
RVO Absent 7 (100.0%) 11 (78.6%) 45 (93.8%) 0.1990
Present 0 (0.0%) 3 (21.4%) 3 (6.3%)
LBBB Absent 7 (100.0%) 14 (100.0%) 47 (95.9%) 1.0000
Present 0 (0.0%) 0 (0.0%) 2 (4.1%)
LAHB Absent 7 (100.0%) 12 (85.7%) 43 (87.8%) 0.8548
Present 0 (0.0%) 2 (14.3%) 6 (12.2%)
RBBB Absent 7 (100.0%) 13 (92.9%) 47 (95.9%) 0.6634
Present 0 (0.0%) 1 (7.1%) 2 (4.1%)
LAO Absent 4 (57.1%) 10 (71.4%) 38 (77.6%) 0.4615
Present 3 (42.9%) 4 (28.6%) 11 (22.4%)
RAO Absent 7 (100.0%) 14 (100.0%) 47 (95.9%) 1.0000
Present 0 (0.0%) 0 (0.0%) 2 (4.1%)
AF: atrial fibrillation; LVO: left ventricular overload; RVO: right ventricular overload; LBBB: left branch block; LAHB: left anterior hemiblock; RBBB: right bundle-branch block; LAO: left atrial overload; RAO: right atrial overload. P-value for the Fisher-Freeman-Halton test.
Figure 5 – Percentages of the attribute variables according to location of myocardial hypertrophy. RVH: right ventricular hypertrophy; AF: atrial fibrillation; LVO: left ventricular overload; RVO: right ventricular overload; LBBB: left bundle-branch block; LAHB: left anterior hemiblock; RBBB: right bundle-branch block; LAO: left atrial overload; RAO: right atrial overload.
100.0
90.0
80.0
70.0
60.0
50.0
40.0
30.0
20.0
10.0
0.0
Percentage
Variables
Apical
Concentric
Septal
Absent Present Absent Present Absent Present Absent Present Absent Present Absent Present Absent Present Absent Present Absent Present Negative Positive
AF
Normal
Deviated to left
Sinus
RVH Rhythm Heart
axis LVO STRAIN RVO LBBB LAHB RBBB LAO RAO
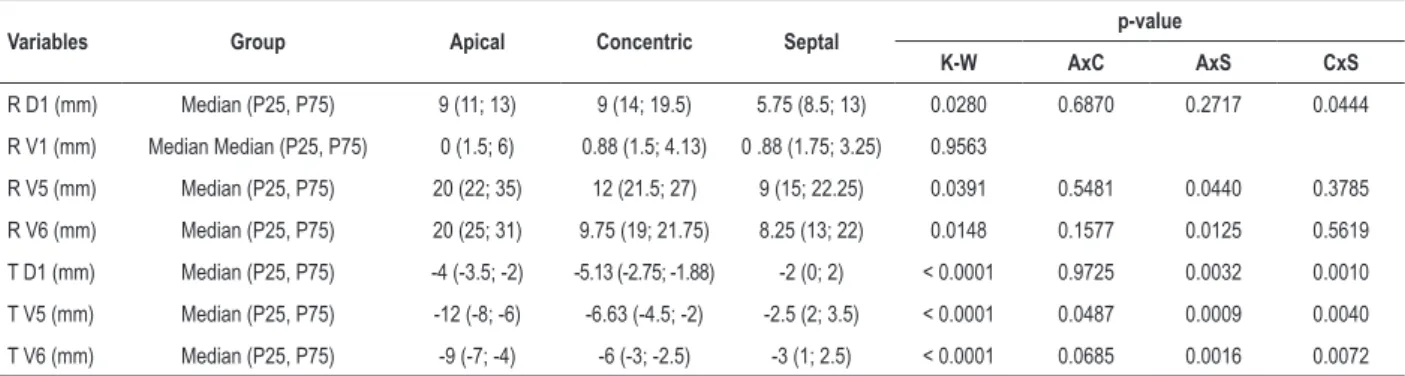
The analysis of the size of the R wave in lead DI showed higher mean (15.6 mm) in concentric hypertrophy, and lower mean in septal hypertrophy (10 mm), with a significant difference between the three groups (p = 0.0280). In lead V1, the R wave showed no difference in its size (p = 0.9563).
As compared to septal and concentric hypertrophies, apical hypertrophy showed greater R wave amplitude in leads V5 and V6 (means of 26.9 mm and 26 mm, respectively), with statistical significance (p = 0.0391, p = 0.0148, respectively).
Regarding ventricular repolarization, apical hypertrophy correlated with the highest T wave negativity in DI (-3.8 mm), V5 (-10.2 mm) and V6 (-7.9 mm), with statistical significance in the three leads (p < 0.001). (Table 3)
Discussion
Analysis of the patients with HCM showed a mild predominance of the female sex (55.9%), which differs from that reported in other studies.2
The distribution of myocardial hypertrophy found in this study by use of magnetic resonance imaging showed predominance of the septal location of hypertrophy (69% of the cases), followed by the concentric (21%) and apical (10%) locations, similar to that reported in the literature.9 Mid-ventricular and lateral involvements, not identified in this study, are rare, with reported prevalence of 1% to 2% of the cases.10
The presence of delayed enhancement on cardiac magnetic resonance worsens the prognosis of patients with HCM. Moon JC et al.,11 in a prospective study with 53 patients with HCM undergoing magnetic resonance imaging with gadolinium, have concluded that the presence of fibrosis relates to the occurrence of ventricular arrhythmias, ventricular dilatation and sudden death. Concentric hypertrophy showed a bigger mass of fibrosis as compared to that of the other hypertrophy locations. The R wave amplitude in DI was higher in concentric hypertrophy, showing a possible electrocardiographic pattern correlated with that location.
However, in leads V5 and V6, the R wave amplitude measured in millimeters showed a significant correlation with
apical hypertrophy, in accordance with the findings of other studies.12 The mean R wave amplitude in V5 and V6 in the apical region was 26 mm, which is similar to that described by Yamaguchi et al. in patients with apical hypertrophy confirmed on the echocardiogram.12 The analysis of the R wave in V1 failed to show a good correlation with the anatomic pattern of hypertrophy.
In addition, apical hypertrophy was related to higher T wave negativity in the leads DI, V5 and V6 (means of -3.8 mm, -10.2 mm, and -7.9 mm, respectively). Chen X et al.,13 assessing 118 patients with HCM, have observed that negative T waves associated with apical hypertrophy (p = 0.009), corroborating the present study. Giant T waves, described as inversion ≥ 10 mm in any anterior lead, were also associated with apical hypertrophy, being found in the patients of that study in leads V5 and V6.14,15 The same relationship has been reported by Song et al.,15 studying 70 patients, who have evidenced a correlation of a deep negative T wave with apical hypertrophy on magnetic resonance imaging (p = 0.018).
Regarding the analysis of the strain pattern on ECG (change in the ST segment and T wave), that electrocardiographic finding showed a 100% correlation with the anatomic location of apical hypertrophy of the left ventricle. In patients with concentric hypertrophy, that pattern of ventricular repolarization change was found in 71% of the cases, while in the septal pattern, only in 28% of the cases, with statistical significance. Sung-Hwan Kim et al.,16 analyzing 864 patients with HCM, have found that same correlation of the strain pattern with apical hypertrophy; however, that was assessed by use of echocardiography (p < 0.001). The specific analysis of that electrocardiographic finding and its correlation with magnetic resonance imaging findings in HCM have not been found in the literature.
Electrocardiographic left ventricular overload was more frequently found in patients with the concentric pattern of hypertrophy (71%) than in the others (42%), but there was no statistical significance in those correlations. Previous studies have only assessed the presence or absence of electrocardiographic criteria of left ventricular overload, without comparing that finding with the location of hypertrophy.6,17
Table 3 – Median and percentiles of the continuous variables according to location of myocardial hypertrophy
Variables Group Apical Concentric Septal p-value
K-W AxC AxS CxS
R D1 (mm) Median (P25, P75) 9 (11; 13) 9 (14; 19.5) 5.75 (8.5; 13) 0.0280 0.6870 0.2717 0.0444
R V1 (mm) Median Median (P25, P75) 0 (1.5; 6) 0.88 (1.5; 4.13) 0 .88 (1.75; 3.25) 0.9563
R V5 (mm) Median (P25, P75) 20 (22; 35) 12 (21.5; 27) 9 (15; 22.25) 0.0391 0.5481 0.0440 0.3785
R V6 (mm) Median (P25, P75) 20 (25; 31) 9.75 (19; 21.75) 8.25 (13; 22) 0.0148 0.1577 0.0125 0.5619
T D1 (mm) Median (P25, P75) -4 (-3.5; -2) -5.13 (-2.75; -1.88) -2 (0; 2) < 0.0001 0.9725 0.0032 0.0010
T V5 (mm) Median (P25, P75) -12 (-8; -6) -6.63 (-4.5; -2) -2.5 (2; 3.5) < 0.0001 0.0487 0.0009 0.0040
T V6 (mm) Median (P25, P75) -9 (-7; -4) -6 (-3; -2.5) -3 (1; 2.5) < 0.0001 0.0685 0.0016 0.0072
1. Correia EB, Borges Filho R. Cardiomiopatia hipertrófica. Rev Soc Cardiol Estado de São Paulo. 2011;21(1):21-9.
2. Elliott PM, Anastasakis A, Borger MA, Borggrefe M, Cecchi F, Charron P, et al. 2014 ESC Guidelines on diagnosis and management of hypertrophic cardiomyopathy. Eur Hear J. 2014;35(39):2733-79. doi: 10.1093/eurheartj/ehu284.
3. Ryan MP, Cleland JG, French JA, Joshi J, Choudhury L, Chojnowska L, et al. The standard electrocardiogram as a screening test for hypertrophic cardiomyopathy. Am J Cardiol. 2015;76(10):689-94. PMID: 7572626.
4. Gersh BJ, Maron BJ, Bonow RO, Dearani JA, Fifer MA, et al; American College of Cardiology Foundation/American Heart Association Task Force on Practice Guidelines; American Association for Thoracic Surgery; American Society of Echocardiography; American Society of Nuclear Cardiology; Heart Failure Society of America; Heart Rhythm Society; Society for Cardiovascular Angiography and Interventions; Society of Thoracic Surgeons. ACCF/AHA Guideline for the diagnosis and treatment of hypertrophic cardiomyopathy: a report of the American College of Cardiology Foundation/American Heart Association Task Force on Practice Guidelines. Circulation. 2011;124(24):783-831. doi: 10.1161/CIR.0b013e318223e2bd.
5. Moro E, D’angelo G, Nicolosi G, Mimo R, Zanuttini D. Long-term evaluation of patients with apical hypertrophic cardiomyopathy. Correlation between quantitative echocardiographic assessment of apical hypertrophy and clinical-electrocardiographic findings. Eur Heart J. 1995;16(2):210-7. PMID: 7744093.
6. Delcrè SD, Di Donna P, Leuzzi S, Miceli S, Bisi M, Scaglione M, et al. Relationship of ECG findings to phenotypic expression in patients with hypertrophic cardiomyopathy: a cardiac magnetic resonance study. Int J Cardiol. 2015;167(3):1038-45. doi: 10.1016/j.ijcard.2012.03.074.
7. Pastore C, Pinho J, Pinho C, Samesima N, Pereira Filho H, Kruse J, et al; Sociedade Brasileira de Cardiologia. III Diretrizes da Sociedade Brasileira de Cardiologia sobre análise e emissão de laudos eletrocardiográficos. Arq Bras Cardiol. 2016;106(4 supl):1-23. doi: http://dx.doi.org/10.5935/abc.20160054.
8. Cerqueira MD, Weissman NJ, Dilsizian V, Jacobs AK, Kaul S, Laskey WK, et al; American Heart Association Writing Group on Myocardial Segmentation and Registration for Cardiac Imaging. Standardized myocardial segmentation and nomenclature for tomographic imaging of the heart: a statement for healthcare professionals from the Cardiac Imaging Committee of the Council on Clinical Cardiology of the American Heart Association. Circulation. 2002;105(4):539-42. PMID: 11815441.
9. Albanesi Filho FM, Lopes JS, Diamant JDA, Castier MB, Alexandre J, Assad R, et al. Apical hypertrophic cardiomyopathy associated with coronary artery disease. Arq Bras Cardiol Cardiol. 1998;71(2):139-42. doi: http://dx.doi. org/10.1590/S0066-782X1998000800009.
10. Manes Albanesi F. Apical hyperthophic cardiomyopathy. Arq Bras Cardiol. 1996;66(2):91-5. PMID: 8734867.
11. Moon JC, McKenna WJ, McCrohon JA, Elliott PM, Smith GC, Pennell DJ. Toward clinical risk assessment in hypertrophic cardiomyopathy with gadolinium cardiovascular magnetic resonance. J Am Coll Cardiol. 2003;41(9):1561-7. PMID: 12742298.
12. Yamaguchi H, Ishimura T, Nishiyama S, Nagasaki F, Nakanishi S, Takatsu F, Nishijo T, et al. Hypertrophic nonobstructive cardiomyopathy with giant negative T waves (apical hypertrophy): ventriculographic and echocardiographic features in 30 patients. Am J Cardiol. 1979;44(3):401-12. PMID: 573056.
13. Chen X, Zhao S, Zhao T, Lu M, Yin G, Jiang S, et al. T-wave inversions related to left ventricular basal hypertrophy and myocardial fibrosis in non-apical hypertrophic cardiomyopathy: a cardiovascular magnetic resonance imaging study. Eur J Radiol. 2014;83(2):297-302. doi: 10.1016/j. ejrad.2013.10.025.
14. Chen X, Zhao T, Lu M, Yin G, Xiangli W, Jiang S, et al. The relationship between electrocardiographic changes and CMR features in asymptomatic or mildly symptomatic patients with hypertrophic cardiomyopathy. Int J Cardiovasc Imaging. 2014;30 Suppl 1:55-63. doi: 10.1007/s10554-014-0416-x.
References
Acknowledgments
We thank Dr. Rodrigo Mello Lima for providing the images of cardiac resonance.
Conclusion
The importance of the ECG as an initial tool to assess patients with HCM is confirmed in this study, which evidenced electrocardiographic patterns that correlate with the location of hypertrophy on magnetic resonance imaging.
The greater amplitude of the R wave in the leads V5 and V6, and the inversion of the T wave in the leads DI, V5 and V6, already reported in previous studies, were significantly related to apical hypertrophy. The presence of the strain pattern on ECG, when HCM is suspected, suggests apical hypertrophy on magnetic resonance imaging.
Concentric hypertrophy was associated with wide R waves in DI and a greater mass of fibrosis on magnetic resonance imaging assessment.
Author contributions
Conception and design of the research: Paixão GMM, Veronesi HE, Silva HAGP, Alencar Neto JN, Maldi CP,
Correia EB; Acquisition of data: Paixão GMM, Veronesi HE, Silva HAGP, Alencar Neto JN, Maldi CP, Aguiar Filho LF, França FFAC; Analysis and interpretation of the data: Paixão GMM, Veronesi HE, Silva HAGP, Alencar Neto JN, Aguiar Filho LF, França FFAC; Critical revision of the manuscript for intellectual content: Paixão GMM, Aguiar Filho LF, Pinto IMF, França FFAC, Correia EB.
Potential Conflict of Interest
No potential conflict of interest relevant to this article was reported.
Sources of Funding
There were no external funding sources for this study.
Study Association
This study is not associated with any thesis or dissertation work.
Ethics approval and consent to participate
15. Song BG, Yang HS, Hwang HK, Kang GH, Park YH, Chun WJ, et al. Correlation of electrocardiographic changes and myocardial fibrosis in patients with hypertrophic cardiomyopathy detected by cardiac magnetic resonance imaging. Clin Cardiol. 2013;36(1):31-5. doi: 10.1002/clc.22062.
16. Kim S, Oh Y, Nam G, Choi K, Kim DH, Song J, et al. Morphological and electrical characteristics in patient with hypertrophic cardiomyopathy: quantitative
analysis of 864 Korean Cohort. Yonsei Med J. 2015;56(6):1515-21. doi: 10.3349/ymj.2015.56.6.1515.
17. Delcrè SD, Di Donna P, Leuzzi S, Miceli S, Bisi M, Scaglione M, et al. Relationship of ECG findings to phenotypic expression in patients with hypertrophic cardiomyopathy: a cardiac magnetic resonance study. Int J Cardiol. 2013;167(3):1038-45. doi: 10.1016/j.ijcard.2012.03.074.