Uniparental ancestry markers in Chilean populations
Camilla Dutra Vieira-Machado
1, Maluah Tostes
1, Gabrielle Alves
1, Julio Nazer
2, Liliana Martinez
3,
Elisabeth Wettig
4, Oscar Pizarro Rivadeneira
5, Marcela Diaz Caamaño
6, Jessica Larenas Ascui
7,
Pedro Pavez
8, Maria da Graça Dutra
9, Eduardo Enrique Castilla
9,10and Ieda Maria Orioli
11
Latin American Collaborative Study of Congenital Malformations (ECLAMC) and National Institute of
Population Medical Genetics (INAGEMP), Departmento de Genética, Instituto de Biologia, Universidade
Federal do Rio de Janeiro (UFRJ), Rio de Janeiro, RJ, Brazil.
2
Neonatal Service, Department of Obstetrics and Gynecology, Hospital Clínico de La Universidad del Chile,
Santiago, Chile.
3
Hospital Regional de Valdivia, Valdívia, Chile.
4
Neonatology Service, Hospital Puerto Montt, Puerto Montt, Chile.
5
Hospital del Salvador, Santiago, Chile.
6
Hospital Clínico San Borja-Arriarán, Santiago, Chile.
7Hospital de Cauquenes, Cauquenes, Chile.
8
Hospital Curicó, Curicó, Chile.
9
Latin American Collaborative Study of Congenital Malformations (ECLAMC) and National Institute of
Population Medical Genetics (INAGEMP), Laboratory of Congenital Malformations Epidemiology (LEMC),
Instituto Oswaldo Cruz (IOC), Fundação Oswaldo Cruz (Fiocruz), Rio de Janeiro, RJ, Brazil.
10
Latin American Collaborative Study of Congenital Malformations (ECLAMC) Center for Medical
Education and Clinical Research (CEMIC) Buenos Aires, Argentina.
Abstract
The presence of Native Americans, Europeans, and Africans has led to the development of a multi-ethnic, admixed population in Chile. This study aimed to contribute to the characterization of the uniparental genetic structure of three Chilean regions. Newborns from seven hospitals in Independencia, Providencia, Santiago, Curicó, Cauquenes, Valdívia, and Puerto Montt communes, belonging to the Chilean regions of Santiago, Maule, and Los Lagos, were studied. The presence of Native American mitochondrial DNA (mtDNA) haplogroups and two markers present in the non-recombinant region of the Y chromosome, DYS199 and DYS287, indicative of Native American and African an-cestry, respectively, was determined. A high Native American matrilineal contribution and a low Native American and African patrilineal contributions were found in all three studied regions. As previously found in Chilean admixed popu-lations, the Native American matrilineal contribution was lower in Santiago than in the other studied regions. How-ever, there was an unexpectedly higher contribution of Native American ancestry in one of the studied communes in Santiago, probably due to the high rate of immigration from other regions of the country. The population genetic sub-structure we detected in Santiago using few uniparental markers requires further confirmation, owing to possible stratification for autosomal and X-chromosome markers.
Keywords: Uniparental markers, ancestry, mtDNA, Y-chromosome, ECLAMC. Received: October 23, 2015; Accepted: February 23, 2016.
The European conquest brought significant changes to the population of America, resulting in cultural and ge-netic exchange with the Native American and African pop-ulations.
Several studies have linked the matrilineage of Native American population to mitochondrial DNA (mtDNA) haplogroups A through D. These haplogroups were wide-spread in the Americas, while haplogroup X was restricted to North America (Torroniet al., 1993; Baillietet al., 1994;
Brownet al., 1998). Subsequent studies using
higher-reso-lution techniques, such as sequencing of the control region or the whole mtDNA, allowed the identification of sub-haplogroups related to each main haplogroup. So far, 10 DOI: http://dx.doi.org/10.1590/1678-4685-GMB-2015-0273
Send correspondence to Iêda Maria Orioli. Genetics Department, Federal University of Rio de Janeiro, Caixa Postal 68.011, 21949-900, Rio de Janeiro, RJ, Brazil. Email: [email protected]
monophyletic Pan-American sub-haplogroups have been identified (Achilliet al., 2008; Peregoet al., 2010), each
consisting of several, previously identified lineages. In admixed populations, matrilineages of only Anto-fagasta (Henríquezet al., 2004), Los Lagos (Garciaet al.,
2006), and Santiago Metropolitan (Roccoet al., 2002)
re-gions were investigated. Both, Antofagasta and Los Lagos regions showed a greater contribution of Native American ancestry by the matrilineage compared to that seen in the population of the Santiago metropolitan region. Studies us-ing autosomal markers also showed the pattern of a smaller contribution of Native American ancestry in Central Chile when compared to the North and South of the country (Ruiz-Linareset al., 2014; Eyheramendyet al., 2015).
Re-garding patrilineage, most Native Americans belong to haplogroup Q, particularly to sub-haplogroup Q-M3 (Q1a3a) (Karafetet al., 2008), which is found in all Native
American populations. A C > T transition in the DYS199 locus, also named M3, identifies the sub-haplogroup Q-M3, found outside America only in Siberia, probably re-flecting reverse gene flow from Alaska into Asia (Roewer
et al., 2013). Since there is no evidence to show that the M3
transition occurred more than once during human evolu-tion, all Q-M3 haplogroups are believed to descend from a common ancestor wherein this transition occurred (Underhillet al., 1996). Therefore, this marker is
particu-larly useful for the identification of Y-chromosome haplo-types originating after migration to the American continent. In addition to haplogroup Q, only haplogroup C is known to occur in Native American populations. In South America, the C3* paragroup was found only in Native pop-ulations from Ecuador (Zeguraet al., 2004; Roeweret al.,
2013). Other Y-chromosome haplogroups, such as haplo-group R, were probably introduced in America through ad-mixture after the colonization of the continent by Europeans (Zeguraet al., 2004).
Limited data exists regarding the patrilineage of Chil-ean native and admixed populations. ChilChil-ean Pehuenches
have high frequency of the haplogroup Q-M3, while Huilliches present a lower frequency of this haplogroup, probably owing to a greater contribution of the haplogroup R, indicative of European gene flow (Baillietet al., 2011).
Of all Chilean regions, only the admixed population of the Santiago metropolitan region has been studied, fo-cusing on its paternal origin and diversity (Cifuenteset al., 2004). Low frequencies of haplogroup Q-M3 were ob-served in both low and high socioeconomic strata samples, suggesting that the main contribution to the patrilineage of this population is European (Cifuenteset al., 2004).
DYS287 is a 300-bp Alu-insertion polymorphism (Y Alu Polymorphism; YAP) with high frequency in African populations, reaching 95% in South and West Africa. Al-though it is also found in some Asian populations, its fre-quency in Africa is significantly higher than in any other region worldwide. It is believed that the YAP insertion oc-curred only once in Africa and that all Y-chromosomes car-rying the YAP+ allele descended from this single individual (Hammer, 1994). YAP+ allele characterizes the haplogroup DE, showing very low frequencies in most na-tive and admixed populations of America, which is consid-ered evidence of admixture (Braviet al., 2000).
The aim of this study was to contribute to the charac-terization of the uniparental genetic structure of seven com-munes from Santiago Metropolitan, Maule, and Los Lagos regions of Chile.
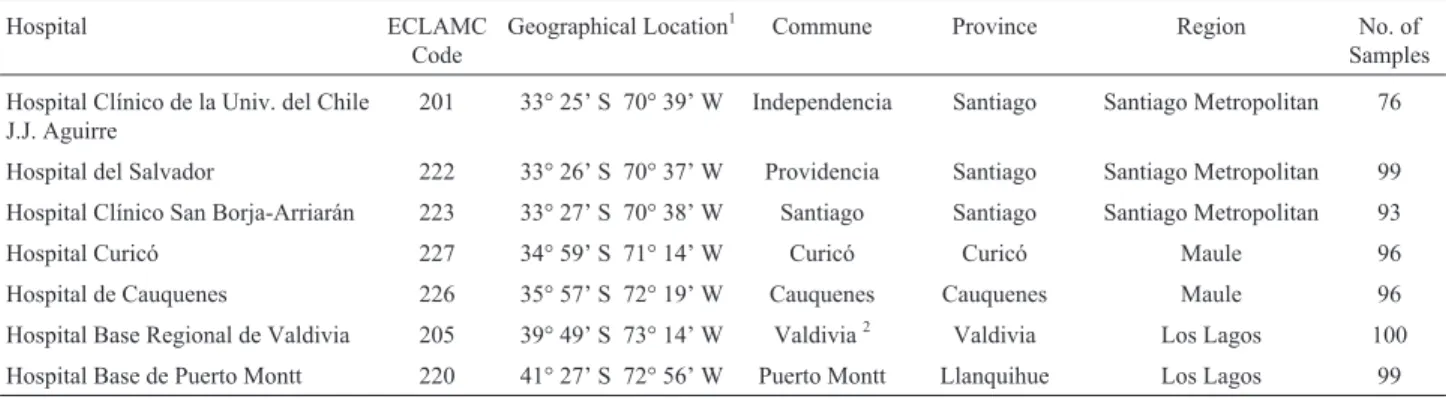
We analyzed umbilical cord blood obtained anony-mously from 659 consecutive births from each of the seven Chilean hospitals located in Independencia, Providencia, Santiago, Curicó, Cauquenes, Valdívia, and Puerto Montt communes, between 2000 and 2006. The number of new-borns in each hospital and the location of each Chilean hos-pital is shown in Table 1. All hoshos-pitals belong to the Latin American Congenital Malformation Collaborative Study (ECLAMC) network (Castilla and Orioli, 2004) dedicated to the study of the causes of birth defects. The ECLAMC study protocol was approved by the Comité de Ética en
Table 1- Hospitals from each Chilean commune, their geographical location and sample size.
Hospital ECLAMC
Code
Geographical Location1 Commune Province Region No. of
Samples
Hospital Clínico de la Univ. del Chile J.J. Aguirre
201 33° 25’ S 70° 39’ W Independencia Santiago Santiago Metropolitan 76
Hospital del Salvador 222 33° 26’ S 70° 37’ W Providencia Santiago Santiago Metropolitan 99 Hospital Clínico San Borja-Arriarán 223 33° 27’ S 70° 38’ W Santiago Santiago Santiago Metropolitan 93
Hospital Curicó 227 34° 59’ S 71° 14’ W Curicó Curicó Maule 96
Hospital de Cauquenes 226 35° 57’ S 72° 19’ W Cauquenes Cauquenes Maule 96
Hospital Base Regional de Valdivia 205 39° 49’ S 73° 14’ W Valdivia2 Valdivia Los Lagos 100 Hospital Base de Puerto Montt 220 41° 27’ S 72° 56’ W Puerto Montt Llanquihue Los Lagos 99
1Latitude and longitude in degrees and minutes
2Valdivia is the capital of the Valdivia province in Los Rios region (14thChilean region), split from the Los Lagos region in 2007, however, as the sample
Investigación del Centro de Educación Médica e Inves-tigaciones Clínicas (Dr. Norberto Quirno) in Buenos Aires, Argentina (IRB-1745, IORG-0001315; approval number: #238). The samples used in this study were collected with the purpose of representing the population born at each hos-pital and serve as control in molecular studies.
Samples were genotyped for Native American mtDNA haplogroups as previously described by Baillietet al.(1994). The mitochondrial lineages A, C, and D were
identified by Restriction Fragment Length Polymorphism (RFLP) at positions 663, 13262, and 5178bp, respectively, and lineage B was identified by an intergenic deletion be-tween COII-tRNA(Lys).
Samples not belonging to any Native American A-D mtDNA haplogroups were included in a group called “Other”.
All samples studied were donated anonymously; therefore, there is no information about the newborns’ sex. A molecular determination of sex was made in order to se-lect only male samples for Y-chromosome analysis. This sex screening was performed as previously described by Nakahoriet al.(1991).
DYS199 genotyping was performed as previously de-scribed by Santoset al.(1999) using a modified primer to create an artificial restriction site toMfeI endonuclease in samples carrying the DYS199C allele. DYS287 was geno-typed as previously described by Hammer and Horai (1995) only in DYS199C individuals, since the YAP+ lele is not found in chromosomes carrying the DYS199T al-lele (Karafetet al., 1997).
Initially, the frequency in each commune was calcu-lated for mtDNA haplogroups A-D and “Other,” DYS199C and DYS199T alleles, and YAP+ and YAP- alleles in DYS287 locus.
Subsequently, to test the hypothesis of no difference among the communes, the chi-square test for homogeneity (BioEstat 5.0) was used to compare the frequencies of each Native American mtDNA haplogroup, combined Native
American mtDNA haplogroups (A+B+C+D), and each al-lele of both Y-chromosome markers. Alpha error was set at 5%.
Genetic distance between communes was estimated by the fixation index (FST) using Arlequin v3.5.1.3
soft-ware, with a significance test for 1023 permutations and al-pha error set at 5%. To determine whether a haplogroup is responsible for genetic differentiation between communes, we calculated the FST value for each haplogroup using
GENEPOP 4.13 software. Analysis of molecular variation (AMOVA) (Excoffieret al., 1992) was also performed us-ing Arlequin v3.5.1.3 software and the degree of subdivi-sion was assessed, where communes were grouped by region (Table 1): Santiago Metropolitan, Maule, and Los Lagos.
All the studied communes showed contribution of Native American and non-Native American ancestry to the matrilineage and patrilineage (Tables 2, 3, and 4). Table 2 shows the frequencies of Native American mtDNA haplo-groups A-D and of the group “Other,” with high contribu-tion of Native American ancestry to the matrilineage in all studied communes, ranging from 75% to 95%. This propor-tion of Native American ancestry was significantly differ-ent among communes (c2= 28.71, DF = 6,p < 0.0001).
Independencia and Santiago communes in the Santiago Metropolitan region showed a non-Native American matri-lineal contribution that was significantly higher than in the other studied communes, approaching 20% in the Santiago commune and 25% in the Independencia commune. The other communes showed an average rate of 8.4% non-Native American mtDNA haplogroups. A chi-square test of homogeneity excluding data from Independencia and San-tiago communes showed no difference in the frequency of the Native American mtDNA haplogroup among the other five communes (c2 = 7.35, DF = 4,p= 0.1186). This
indi-cates that Independencia and Santiago populations are sig-nificantly different from the other populations in this study, regarding this contribution. They were also significantly
Table 2- Native American mtDNA haplogroups in the seven Chilean communes.
Commune (Region)
N Mitochondrial Haplogroups Native American Total
% 95% Confi-dence Interval
Other % 95% confi-dence Interval
A B C D A+B+C+D
Independência (Santiago MR)1 76 3 24 16 14 57 75.0 65.3 - 84.7 19 25.0 15.3 - 34.7
Providencia (Santiago MR)1 99 8 33 26 25 92 92.9 87.8 - 98.0 7 7.1 2.0 - 12.2
Santiago (Santiago MR)1 93 3 24 24 24 75 80.6 72.6 - 88.6 18 19.4 11.4 - 27.4
Curicó (Maule) 96 4 13 32 33 82 85.4 78.3 - 92.5 14 14.6 7.5 - 21.6
Cauquenes (Maule) 96 6 22 28 31 87 90.6 84.8 - 96.4 9 9.4 3.6 - 15.2
Valdivia (Los Lagos) 100 1 25 37 32 95 95.0 90.7 - 99.3 5 5.0 0.7 - 9.3
Puerto Montt (Los Lagos) 99 5 23 30 35 93 93.9 89.2 - 98.6 6 6.1 1.4 - 10.8
Total 659 30 164 193 194 581 88.2 85.7 - 90.6 78 11.8 9.3 - 14.2
different from the Providencia commune located in the same Santiago Metropolitan region (c2= 11.18, DF = 2,
p = 0.0037), which is indicative of a population genetic sub-structure within the Santiago Metropolitan region.
The proportions of each Native American mtDNA haplogroups were not significantly different among com-munes (c2 = 24.69, DF = 18, p = 0.134), with higher
fre-quencies of haplogroups D (33.4%), C (33.2%), and B (28.2%), whereas a lower frequency of haplogroup A (5.2%).
Table 3 shows the frequencies of DYS199T allele in the seven Chilean communes. Unlike that observed for mtDNA, the chi-square test showed no significant differ-ence for the DYS199 SNP allele frequencies among com-munes (c2= 2.42, DF = 6,p=0.877).
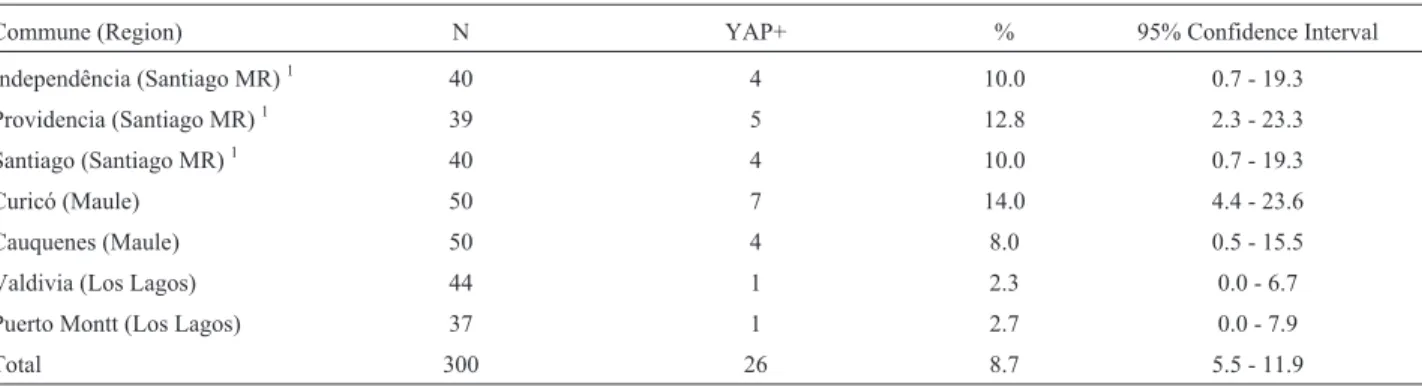
As shown in Table 4, the YAP insertion average fre-quency was at 8.7%, showing low contribution of African ancestry in the patrilineage, as previously observed for the Native American ancestry estimated by DYS199 locus. There was also no significant difference in the frequency of this insertion among the studied communes (c2 = 7.18,
DF = 6,p=0.3042).
Our results indicate a noticeably smaller patrilineal (8.5%) than matrilineal contribution (88.2%) of Native American ancestry in terms of Native American mtDNA
haplogroups (Table 2). This pattern of a significantly larger contribution of Native American ancestry from the matri-lineage than from the patrimatri-lineage is consistent with that re-ported in previous studies from South America (Martinez-Marignacet al., 2004; Bonillaet al., 2005; Vieira-Machado
CD, 2011, Dissertation, Universidade Federal do Rio de Ja-neiro). This phenomenon is attributed to marriages that took place between European men and Native American women during the colonization of the American continent (Ruiz-Linares, 2014).
The lower contribution of Native American ancestry to the Independencia and Santiago communes as compared to the other regions is in agreementwith previous reports in-volving autosomal (Fuenteset al., 2014; Eyheramendyet al., 2015) and mtDNA markers (Roccoet al., 2002;
Henrí-quezet al., 2004; Garciaet al., 2006). These studies showed
a lower contribution of Native American ancestry in the central regions of the country, probably a result of a higher immigration rate from Spain during the colonization of Chile and from several other European regions after 1850. A population sub-structure has been reported be-tween populations that inhabited the Ayllus (Andean kin-based community structure) of the San Pedro de Atacama’s oases (Northern Chile) during the Middle Period (AD 400-1000), by means of nonmetric cranial traits of skeletal
re-Table 3- DYS199T allele frequency in the seven Chilean communes
Commune (Region) N DYS199T % 95% Confidence Interval
Independência (Santiago MR)1 40 3 7.5 0 - 15.6
Providencia (Santiago MR)1 39 5 12.8 2.3 - 23.3
Santiago (Santiago MR)1 43 5 11.6 2.0 - 21.2
Curicó (Maule) 51 4 7.8 0.5 - 15.2
Cauquenes (Maule) 50 3 6.0 0.6 - 12.6
Valdivia (Los Lagos) 44 4 9.0 0.5 - 17.5
Puerto Montt (Los Lagos) 37 2 5.4 0.0 - 12.7
Total 304 26 8.5 5.4 - 11.6
1Santiago Metropolitan Region.
Table 4- YAP+ allele frequency in the seven Chilean communes
Commune (Region) N YAP+ % 95% Confidence Interval
Independência (Santiago MR)1 40 4 10.0 0.7 - 19.3
Providencia (Santiago MR)1 39 5 12.8 2.3 - 23.3
Santiago (Santiago MR)1 40 4 10.0 0.7 - 19.3
Curicó (Maule) 50 7 14.0 4.4 - 23.6
Cauquenes (Maule) 50 4 8.0 0.5 - 15.5
Valdivia (Los Lagos) 44 1 2.3 0.0 - 6.7
Puerto Montt (Los Lagos) 37 1 2.7 0.0 - 7.9
Total 300 26 8.7 5.5 - 11.9
mains from 12 cemeteries. This finding suggested that dif-ferential migration and/or cultural isolation processes ac-centuated biological differences between the Ayllus (Torres-Rouffet al., 2013). Since there is no evidence of
isolation among the studied communes of Santiago Metro-politan region, the difference in the Native American mtDNA contribution was probably a consequence of the high rate of immigration of individuals with higher Native American ancestry from other regions of the country during the 1960s (Villa and Rodríguez, 1996). The heterogeneous genetic composition of Santiago Metropolitan region has not been observed previously.
Marcheco-Teruel et al. (2014), studied population
samples from all Cuban provinces by means of autosomal and uniparental markers, and showed that uniparental markers identified the same differences between provinces that had been identified previously using autosomal mark-ers. Therefore, the heterogeneity found among the com-munes in the Santiago Metropolitan region in the present study probably may be true also for the autosomal and X-chromosome markers.
Regarding the patrilineage, our results showed a ho-mogeneous contribution of Native American and African ancestries to the three studied regions with low frequencies of both ancestries in all studied communes. The lower fre-quency for the DYS199T allele, ranging from 5.4% to 12.8%, showed little Native American patrilineal contribu-tion to the studied communes, similar to previous findings in admixed population from the Santiago Metropolitan re-gion (4.3%) (Cifuenteset al., 2004). Similar frequencies
have been observed in other admixed American popula-tions like those in La Plata, Argentina (9.4%) (Martinez-Marignacet al., 2004) and Belém, northern Brazil (3.8%)
(Batista dos Santoset al., 1999), while higher frequencies
(44.0%) were found in Pasco and Lima, Peru (Rodriguez-Delfinet al., 2001) and in the Jujuy Province, northwestern
Argentina (43.7% up to 94.7%) (Baillietet al., 2011).
The YAP+ allele of the DYS287 locus, the other stud-ied marker present in the non-recombinant region of the Y chromosome, is found in Africa with frequencies ranging from 49.5% in the northern region to up to 95.0% in Sub-Saharan Africa. In Japan, its frequency ranges from 33.0% to 56.0%, probably owing to its inheritance from their Jomon ancestors, who remained isolated for 13,000 years, suffering from genetic drift effects, which might have led to the increase in YAP+ allele frequency in that population (Hammer and Horai, 1995). In the admixed populations of America, YAP+ allele frequency ranged from low values observed in Pasco and Lima, Peru (4.0%) (Rodriguez-Delfinet al., 2001) and in different
Argentin-ean regions, ranging from 1% in Jujuy Province to 20% in Salta Province (Baillietet al., 2011), up to 40.5% in
Carta-gena, an admixed population in Colombian Caribbean re-gion (Rojas et al., 2010). Only the Chilean Native
populations Huilliche and Pehuenche were investigated for
the presence of YAP+ or DE haplogroup both showing very low frequencies of this marker (frequencies of 0% and 7.7% in two Huilliches samples and 4.7% and 5.6% in two Pehuenches samples) (Bravi et al., 2000; Bailliet et al.,
2011). The YAP insertion serves as an indicator of non-Native American ancestry, with high probability of African patrilineal ancestry.
In this study, a low African patrilineal contribution, ranging from 2.3% to 14%, and a low frequency of the DYS199T allele (8,5%, indicating low Native American contribution) are suggestive of a mostly European patri-lineal origin for the Chilean population studied, as high-lighted by Cifuenteset al.(2004) in the Santiago
popula-tion.
Using Native American mtDNA haplogroups to cal-culate genetic distance by pairwise FST, all observed values
were found to be very low (< 5.0%). The largest distances were found between Providencia and Curicó (3.0%) and between Independencia and Curicó (4.7%) communes (Ta-ble S1). The fixation index FSTallowed us to evaluate the
weight of each haplogroup in the differentiation of popula-tions: no significant difference was found and all observed values were less than 0.9%, which was the value obtained for haplogroup B.
Pairwise FSTcalculation using NRY markers showed
very low estimates of genetic distance (< 2.4%). The largest genetic distances were found between: Valdivia and Curi-có, Puerto Montt and CuriCuri-có, and Providencia and Puerto Montt. None of the comparisons showed any significantp
value, which was indicative of homogeneity among the an-cestral patrilineal contributions in these regions (Table S2).
AMOVA results showed a low degree of subdivision in the studied regions. When Native American mtDNA haplogroups were used, 98.6% of the total variation corre-sponded to differences between individuals within popula-tions, whereas the variation between tested regions (Santia-go Metropolitan, Maule, and Los La(Santia-gos) was not significantly different from zero. When NRY markers were used, 100% of the total variation observed was within pop-ulations (not significant after 1023 permutations), with 1.3% variance among the studied groups (Table S3). This test also showed lowjCT values (variance among groups
relative to the total variance).
A potential limitation of this study is the low number of hospitals that were sampled from each region. Hence, we cannot confirm that our sample is representative of the en-tire region. In addition, we did not study samples from all Chilean regions. Therefore, future studies are still required for a full understanding of the complex genetic origin of the Chilean admixed population.
births, since blood bank samples are generally more biased with respect to socioeconomic, health-related, and anthro-pometric variables (Golding et al., 2013). Finally, this
study provides information regarding Chilean population structure and contributes to a better understanding of the genetic history of this population, which is important for genetic, medical and anthropological studies.
Acknowledgments
This work was supported by grants from Fundação de Amparo à Pesquisa do Estado do Rio de Janeiro (FAPERJ) and Conselho Nacional de Desenvolvimento Científico e Tecnológico (CNPq). We thank Kelli Cristina Almeida Melquíades, Maura Sabino da Silva, and Viviane Freitas de Castro for their technical assistance. Financial support is
acknowledged from FAPERJ (grant numbers:
E-26/102.797/2012, E-26/110.140/2013) and CNPq (grant numbers: 481069/2012-7, 306396/2013-0, 400427/2013-3).
References
Achilli A, Perego UA, Bravi CM, Coble MD, Kong QP, Wood-ward SR, Salas A, Torroni A and Bandelt HJ (2008) The phylogeny of the four Pan-American mtDNA haplogroups: Implications for evolutionary and disease studies. PLoS One 3:E1764.
Bailliet G, Rothhammer F, Carnese FR, Bravi CM and Bianchi NO (1994) Founder mitochondrial haplotypes in Amerin-dian population. Am J Hum Genet 55:27-33.
Bailliet G, Ramallo V, Muzzio M, Santos MR, Motti JMB, Bian-chi NO and Bravi CM (2011) Antecedentes y nuevos aportes en el estudio del Cromosoma Y en poblaciones humanas sudamericanas. J Basic Appl Genet 22:1-9.
Batista dos Santos S, Rodrigues J, Ribeiro-dos-Santos A and Zago M (1999) Differential contribution of indigenous men and women to the formation of an urban population in the ama-zon region as revealed by mtDNA and Y-DNA. Am J Phys Anthropol 109:175-180.
Bonilla C, Gutiérrez G, Parra EJ, Kline C and Shriver MD (2005) Admixture analysis of a rural population of the state of Guerrero, Mexico. Am J Phys Anthropol 128:861-869. Bravi CM, Bailliet G, Martinez-Marignac VL and Bianchi NO
(2000) Origin of YAP plus lineages of the human Y-chro-mosome. Am J Phys Anthropol 112:149-158.
Brown MD, Hosseini SH, Torroni A, Bandelt HJ, Allen JC, Schurr TG, Scozzari R, Cruciani F and Wallace DC (1998) mtDNA haplogroup X: An ancient link between Europe western Asia and North America? Am J Hum Genet 63:1852-1861.
Castilla EE and Orioli IM (2004) ECLAMC: The Latin-American collaborative study of congenital malformations. Commu-nity Genet 7:76-94.
Cifuentes L, Morales R, Sepulveda D, Jorquera H and Acuna M (2004) DYS19 and DYS199 loci in a Chilean population of mixed ancestry. Am J Phys Anthropol 125:85-89.
Excoffier L, Smouse PE and Quattro JM (1992) Analysis of mo-lecular variance inferred from metric distances among DNA
haplotypes: Application to human mitochondrial DNA re-striction data. Genetics 131:479-491.
Eyheramendy S, Martinez FI, Manevy F, Vial C and Repetto GM (2015) Genetic structure characterization of Chileans re-flects historical immigration patterns. Nat Commun 6:6472. Fuentes M, Gallo C, Canizales-Quinteros S, Bedoya G and
Rothhammer F (2014) Geografía génica de Chile. Distri-bución regional de los aportes genéticos americanos, euro-peos y africanos. Rev Med Chil 142:281-289.
Garcia F, Moraga M, Vera S, Henriquez H, Llop E, Aspillaga E and Rothhammer F (2006) mtDNA microevolution in Sou-thern Chile’s archipelagos. Am J Phys Anthropol 129:473-481.
Golding J, Northstone K, Miller LL, Smith GD and Pembrey M (2013) Differences between blood donors and a population sample: Implications for case-control studies. Int J Epide-miol 42:1145-1156.
Hammer MF (1994) A recent insertion of an Alu element on the Y-chromosome is a useful marker for human-population studies. Mol Biol Evol 11:749-761.
Hammer MF and Horai S (1995) Y-chromosomal DNA variation and the peopling of Japan. Am J Hum Genet 56:951-962. Henríquez H, Moraga M, Llop E and Rothhammer F (2004)
Caracterización genético molecular de habitantes de Caleta Paposo, último reducto Chango en Chile. Rev Med Chil 132:663-672.
Karafet T, Zegura SL, VuturoBrady J, Posukh O, Osipova L, Wiebe V, Romero F, Long JC, Harihara S, Jin F, et al. (1997) Y chromosome markers and trans-Bering Strait dis-persals. Am J Phys Anthropol 102:301-314.
Karafet TM, Mendez FL, Meilerman MB, Underhill PA, Zegura SL and Hammer MF (2008) New binary polymorphisms re-shape and increase resolution of the human Y chromosomal haplogroup tree. Genome Res 18:830-838.
Marcheco-Teruel B, Parra EJ, Fuentes-Smith E, Salas A, But-tenschøn HN, Demontis D, Torres-Español M, Marín-Pa-drón LC, Gómez-Cabezas EJ, Alvarez-Iglesias V, et al. (2014) Cuba: Exploring the history of admixture and the ge-netic basis of pigmentation using autosomal and uniparental markers. PLoS Genet 10:e1004488.
Martinez-Marignac VL, Bertoni B, Parra EJ, Bianchi NO, Marignac VLM, Bertoni B, Parra EJ and Bianchi NO (2004) Characterization of admixture in an urban sample from Bue-nos Aires, Argentina, using uniparentally and biparentally inherited genetic markers. Hum Biol 76:543-557.
Nakahori Y, Takenaka O and Nakagome Y (1991) A human X-Y homologous region encodes “amelogenin”. Genomics 9:264-269.
Perego UA, Angerhofer N, Pala M, Olivieri A, Lancioni H, Kashani BH, Carossa V, Ekins JE, Gomez-Carballa A, Huber G,et al.(2010) The initial peopling of the Americas: A growing number of founding mitochondrial genomes from Beringia. Genome Res 20:1174-1179.
Rocco P, Morales C, Moraga M, Miguel JF, Nervi F, Llop E, Carvallo P and Rothhammer F (2002) Genetic composition of the Chilean population. Analysis of mitochondrial DNA polymorphisms. Rev Med Chil 130:125-131.
Data from Y chromosome and mitochondrial DNA. Hum Hered 51:97-106.
Roewer L, Nothnagel M, Gusmão L, Gomes V, González M, Corach D, Sala A, Alechine E, Palha T, Santos N,et al. (2013) Continent-wide decoupling of Y-chromosomal ge-netic variation from language and geography in Native South Americans. PLoS Genet 9:e1003460.
Rojas W, Parra MV, Campo O, Caro MA, Lopera JG, Arias W, Duque C, Naranjo A, Garcia J, Vergara C,et al.(2010) Ge-netic make up and structure of Colombian populations by means of uniparental and biparental DNA markers. Am J Phys Anthropol 143:13-20.
Ruiz-Linares A (2014) How genes have illuminated the history of early Americans and Latino Americans. Cold Spring Harb Perspect Biol 7 pii:a008557.
Ruiz-Linares A, Adhikari K, Acuña-Alonzo V, Quinto-Sanchez M, Jaramillo C, Arias W, Fuentes M, Pizarro M, Everardo P, de Avila F,et al.(2014) Admixture in Latin America: Geo-graphic structure, phenotypic diversity and self-perception of ancestry based on 7,342 individuals. PLoS One 10:e1004572.
Santos FR, Carvalho-Silva DR and Pena SDJ (1999) PCR-based DNA profiling of human Y chromosomes. In: Epplen JT and Lubjuhn T (eds) Methods and Tools in Biosciences and Medicine. Birkhäuser Verlag, Basel, pp 133-152.
Torres-Rouff C, Knudson KJ and Hubbe M (2013) Issues of affin-ity: Exploring population structure in the middle and re-gional developments periods of San Pedro de Atacama, Chile. Am J Phys Anthropol 152:370-382.
Torroni A, Schurr TG, Cabell MF, Brown MD, Neel JV, Larsen M, Smith DG, Vullo CM and Wallace DC (1993) Asian af-finities and continental radiation of the 4 founding Na-tive-American mtDNAs. Am J Hum Genet 53:563-590.
Underhill PA, Jin L, Zemans R, Oefner PJ and Cavalli-Sforza LL (1996) A pre-Columbian Y chromosome-specific transition and its implications for human evolutionary history. Proc Natl Acad Sci U S A 93:196-200.
Villa M and Rodríguez J (1996) Demographic trends in Latin America’s metropolies, 1950-1990. In: Gilbert A (ed) The Mega-City in Latin America. United Nations University Press, Tokyo, pp 25-52.
Zegura SL, Karafet TM, Zhivotovsky LA and Hammer MF (2004) High-resolution SNPs and microsatellite haplotypes point to a single, recent entry of Native American Y chromo-somes into the Americas. Mol Biol Evol 21:164-175.
Internet Resources Section
Arlequin v3.5.1.3, http://www.mamiraua.org.br/pt-br/down-loads/programas/bioestat-versao-53 (October 10, 2015). BioEstat 5.0, http://cmpg.unibe.ch/software/arlequin3 (October
10, 2015).
GENEPOP 4.13, http://kimura.univ-montp2.fr/~rousset/ Genepop.htm (October 10, 2015).
Supplementary material
The following online material is available for this article:
Table S1 - Genetic distance (FST) among the seven Chilean
com-munities by means of mtDNA haplogroups.
Table S2 - Genetic distance (FST) among the seven Chilean com-munities using NRY markers.
Table S3 - AMOVA comparison among the three studied regions.
Associate Editor: Maria Rita Passos-Bueno