Rev. Caatinga
MORPHOLOGICAL DISSIMILARITY AMONG MANGABEIRA TREE
POPULATIONS FROM AMAPÁ AND PARAÍBA, BRAZIL
1GILBERTO KEN ITI YOKOMIZO2*, MARIA CLIDEANA CABRAL MAIA3, CLAUDECI FERNANDES DA
TRINDADE2
ABSTRACT- Mangabeira fruits are collected from native populations under anthropic pressure. It is therefore
essential to obtain morphogenetic information to genetically improve populations, thereby preventing genetic erosion. This research was carried out in the state Amapá and aimed to verify the morphological dissimilarity between two populations, one composed of 36 native progenies and one of eight progenies from Paraiba, outlined in lattices with two replications and six plants per part. The evaluated characteristics were: agronomic value (VA), treetop circumference(CCP), plant height (ALP), estimated number of fruits per plant (NEF), fruit color (COF), average weight of 10 fruits (PMF), fruit diameter (DF), average pulp weight of ten fruits (PMP), average length of 10 fruits (CMF), average number of seeds of 10 fruits (NMS). Our results indicate that the phenotype was mainly determined by responses to environmental changes; in the correlations, inherent fruit characteristics (weight, size, and color) did not affect the VA, while biometric characters influenced VA values. Higher plants presented larger fruits and a larger diameter, bigger quantities, there is also apparent contrast, with a larger amount of smaller size; the populations are dissimilar, indicating the possibility of obtaining of diverging superior segregating.
Keywords: Apocynaceae. Hancornia speciosa. Genetic Diversity. Phenotypic Variability. UPGMA.
DISSIMILARIDADES MORFOLÓGICAS ENTRE POPULAÇÕES DE MANGABEIRAS DO AMAPÁ E DA PARAÍBA, BRASIL
RESUMO- As frutas de mangabeiras são coletadas extrativamente em populações nativas sob grande pressão
antrópica, devendo-se obter informações morfogenéticas para ações com reflexos no melhoramento genético
que possam evitar a sua erosão genética. Esta pesquisa realizada no Amapá, teve como objetivo verificar a dissimilaridade morfológica entre duas populações, uma composta por 36 progênies nativas e outra com 8 da Paraíba, delineados em látices, com duas repetições e seis plantas por parcela. As características avaliadas foram: valor agronômico (VA); circunferência da copa da planta (CCP); altura da planta (ALP); número estimado de frutos na planta (NEF); cor do fruto (COF); peso médio de dez frutos (PMF); diâmetro do fruto
(DF); peso médio da polpa de dez frutos (PMP); comprimento médio de dez frutos (CMF); número médio de
sementes de dez frutos (NMS). As principais conclusões obtidas indicaram que o fenótipo foi devido principalmente as respostas às variações ambientais; nas correlações, características inerentes aos frutos (peso, tamanho e cor) não influenciaram o VA, enquanto que os caracteres biométricos influenciaram, plantas mais altas apresentaram frutos maiores e as com maior diâmetro maior quantidade, há também aparente compensação, com maior quantidade de frutos, estes são menores; as populações são dissimilares, indicando possibilidade da obtenção de segregantes divergentes superiores.
Palavras chave: Apocynaceae. Hancornia speciosa. Divergência Genética. Variabilidade Fenotípica. UPGMA.
___________________ *Corresponding author
1Received for publication in 04/04/2016; accepted in 08/18/2016.
This article is a result of Embrapa Amapá research.
INTRODUCTION
In 2009, the Ministry of Environment in
Brazil has declared mangabeira (Hancornia speciosa
Gomes) as one of twelve native fruit species threatened by extinction in Brazil (BRASIL, 2009). To date, knowledge about the genetic value utility and the environmental conservation status of this species is scarce (FERREIRA, 2009), which may lead to irreversible genetic erosion (VIEIRA NETO; SILVA JUNIOR; LEDO, 2009).
Commonly known as mangaba, an expression which has its origins in the language Tupy Guarany "Mã Gawa" and means "good thing to eat," this fruit has a high commercial value in the Northeast and is mainly used in the production of fruit pulp, ice cream, and juices (SANTOS; SOUZA, 2016).
Hancornia speciosa belongs to the family Apocynaceae and is a tropical tree fruit characteristic for the Northeast and North of Brazil, also spreading to regions of the central Brazilian Savannah and the Southeast (SOARES et al., 2009; FERREIRA et al., 2013).
The species is an important component of its ecosystem and serves as food for human populations. In addition to being consumed in its natural state, it is used for the production of sweets, jams, syrup, wine, vinegar, liquor, soft drinks, juice, ice cream, and even as animal food (e.g. for monkeys and apes, birds, and insects). Its natural pattern of aggregated disposition facilitates sustainable extraction and exploitation of fruit by the local population. Large-scale exploitation is constrained by the long
distances between fruit collection sites and the urban marketing centers and by the delicacy of the fruit. The exocarp of the fruit is very thin and shows poor resistance during handling and transportation
(DURÃES; SUNDFELD; SILVA, 2008). Since H.
speciosa naturally occurs along agricultural areas, enrichment of these areas could be a good alternative for the appreciation of such environment and its reasonable and sustainable exploitation by local people who depend on these areas (DURÃES; SUNDFELD; SILVA, 2008; LIMA; SCARIOT; GIROLDO, 2013). Furthermore, uncontrolled extraction combined with intense anthropic activity in the naturally occurring environment of mangabeira populations in northeast Brazil are contributing to genetic erosion of this species; to date, little information is available about the genetic population structure of H. speciosa (MARTINS et al., 2012).
Previous studies have indicated high genetic variability in populations of mangabeiras (SILVA JUNIOR et al., 2007; GANGA; CHAVES; NAVES, 2009; MOURA et al., 2011). In particular, Ganga et al. (2010) observed high levels of phenotypic variation in fruit ratings, which were higher among different populations. Furthermore, the existing
environmental components such as anthropization level, soil condition, climate, age of the plants, and genetic differences between individuals. As the species is still not fully domestic, variability is an important factor to enable the selection of superior plants for the establishment of orchards with greater uniformity and specific features.
This study aimed to evaluate variability in biometric and productive features. We compared two populations, progenies from the state Paraíba and native from the state Amapá, using dendrogram dissimilarity in order to determine whether the two populations are different.
MATERIAL AND METHODS
The Mangabeira Work Collection (CTM) is established in the Savannah Experimental Field (CEC), belonging to the Embrapa Amapá at BR 156 road, km 43. It covers a total area of 1,200 hectares and is located between the geographic coordinates N 00º22'55" and W 51°04'10" in the city of Macapa. Soil is classified as dystrophic Yellow Latosol with medium texture and the following particle sizes: 230 g kg-¹ clay, 440 g kg-¹ coarse sand, 170 g kg-¹
fine sand, and 160 g kg-¹ silt, with low fertility, low
organic matter content, and medium acidity (MELÉM JÚNIOR; FARIAS NETO; YOKOMIZO, 2003). According to the KOPPEN classification, the climate is tropical moist (Af) and characterized by high annual rainfall and little variations in temperature. From 2000 to 2015, the average temperature for the entire state was 27.46°C, dominated by a system of high temperatures with maximum and minimum values of 32.08 and 24.03ºC, respectively. Average annual rainfall in the region was 2,489.69 mm, with rainfall values of 2,166.76 mm in the rainy season (January to July)
and 322.25 mm in the dry season
(August-December) and an average annual humidity
of 79.89% (INMET, 2016).
The mangabeiras were planted in May 1998, with the introduction of native plants and plants derived from selected matrices from the State of Paraíba. In total, we collected 36 native progenies from December 1997 to January 1998 in surrounding areas close to Macapa municipalities of Ferreira Gomes. In addition, were planted eight varieties (PAR8, PC3, EXT 20, PC4, EXT1, Z6, NZ1, RT7) from the Active Germplasm Bank of Mangabeira
(BAG-Mangaba) of EMEPA, Paraiba.
Data collection was carried out from January 2009 to March 2010, covering 239 native provenances which corresponded to 36 different acess and 72 plants of Paraiba, totaling 8 different accesses. For morphological characterization with regard to reproductive aspects, adult, fruit-producing
Rev. Caatinga
Agronomic value (VA): agronomic value, subjective visual grading adjusted for all materials based on general appearance of the plant in terms of vegetative, reproductive, and health aspects; 1 - very
bad condition, formation of a highly uneven treetop, many spaces without development of branches and leaves, treetop (both in diameter and height) well below average, small amount of fruit, symptoms of
severe disease, overall condition very weak; 2 - formation of very uneven treetop, many spaces
without development of branches and leaves, treetop below average, small amount of fruit, symptoms of
disease, general appearance slightly weak; 3 - uniform treetop, few spaces without development
of branches and leaves, average treetop size, average amount of fruit, few symptoms of disease; average general appearance; 4 - uniform treetop, no spaces
without development of branches and leaves, treetop slightly above average, high amount of fruit, few symptoms of disease; good general appearance; 5 - uniform treetop, no spaces without development
of branches and leaves, treetop far above average, very high amount of fruit, no symptoms of disease, excellent general appearance; circumference of the plant crown (CCP): average distance of the final projection of the treetop to the stem in meters; plant height in meters (ALP); estimated number of fruits per plant (NEF, estimated by sampling one side of
the treetops); Color of fruit (COF, 1 - yellow,
2 – yellow, slightly motley, 3 - yellow, average
variegated, 4 – yellow, very variegated and 5 - red;
average weight of 10 fruits in grams (PMF); average weight of pulp on 10 fruits in grams (PMP); average number of ten seeds (NMS); fruit diameter in mm (DF); average length of fruits in mm (CMF, n = 10). The parameters DF and CMF were evaluated with the aid of an analogical pachymeter (brand Digimess, model 100028).
We performed analysis of variance to detect significant differences in terms of each parameter and to distinguish the Amapá origins in relation to the Paraiba, with the help of computer programs GENES 7 (CRUZ, 2013) and SAS (SAS INSTITUTE, 2000).
Cluster analysis was performed by adopting the average Euclidean distance as a measure of dissimilarity, considering the correlation between the evaluated features according to Cruz, Regazzi and Carneiro (2012). We also calculated the means of Mahalanobis generalized distances, the relative importance of the characteristics evaluated for morphological dissimilarity according to the methodology proposed by Singh (1981). Based on the dissimilarity matrix generated, we prepared the
dendrogram using the UPGMA method (Unweighted
Pair Group Method with Arithmetic Mean/ Método não Ponderado de Agrupamento usando a Média
Aritmética). The criteria used for the formation of groups was the average of the distances between all pairs of items that compose each group. We used the GENES program (CRUZ, 2013) for all analyzes.
RESULTS AND DISCUSSION
One of the main objectives of the variance analysis was to determine whether there are significant differences between the two populations (native of Amapa and from Paraiba); further information is needed to verify whether these morphological differences could serve as a further selection instrument. In this case, as shown in Table 1, we found no differences for NMS and VA between the two populations. For the other parameters, we observed significant 1% differences, indicating that the progenies that compose the native origins are distinct in productive aspects, demonstrating that there are fundamental differences between that the two populations which were also observed by Ganga, Chaves and Naves (2009) in a study with different natural populations. Our results are in agreement with the results found by Ganga et al. (2010), where the variation was mostly due to phenotypic variation among the progenies.
The progenies significantly differed in VA and ALP, while in terms of other characteristics, there were no significant differences. In a similar study, Ganga et al. (2010) observed differences in vegetative and productive characteristics, with similarity only for PMP.
Table 1. Summary of the analysis of variance for 10 biometric and reproductive characteristics evaluated in mangabeira progenies (Hancornia speciosa) native from Amapá compared with those from Paraiba.
aVA: agronomic value; CCP: treetop circumference; ALP: plant height; NEF: estimated number of fruits on the plant;
COF: fruit color; PMF: average weight of ten fruits; PMP: average weight of ten fruits pulp; DF: fruit diameter; NMS: average of seeds of ten fruits; CMF: average length of ten fruits.
bPop: native population and from the Paraíba; Prog: progenies; Rep: replications.
In brackets: number of degrees of freedom for variation source and characteristic.
cCV: experimental coefficients of variation.
*significant at 5% significance level by the F-test, **significant at 1% significance level by the F-test and ns not significant.
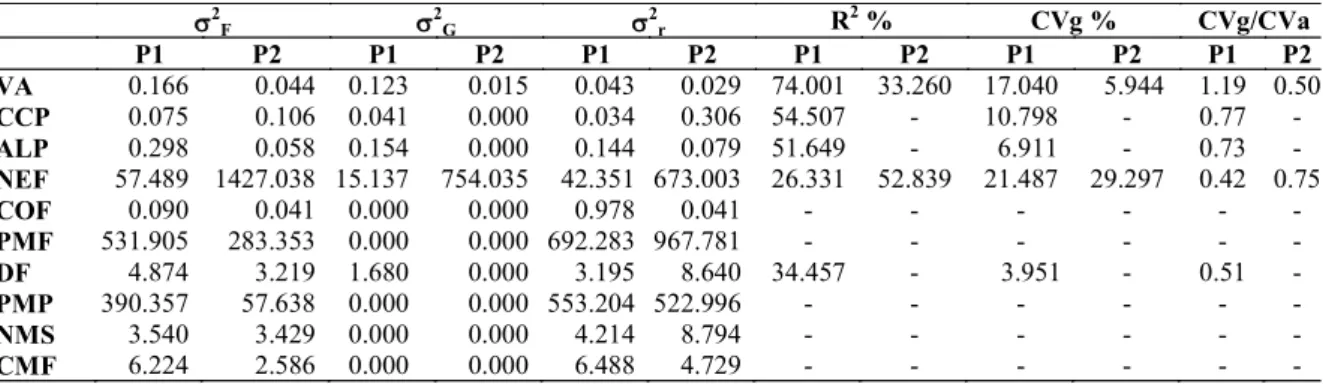
Genetic and phenotypic parameters are presented in Table 2. Identification of the population from Paraiba was possible through VA, CCP, and
ALP, which showed phenotypic (σ2
F) and genetic
(σ2
G) variance with no discrepant estimates, allowing
to estimate the CVg/ CVa relationship indicative of each selection, with values between 1.19 and 0.73, respectively. In other features, the phenotype observed was influenced, almost exclusively, by environmental effects, similar to the findings of Ganga et al. (2010). In this study, it was therefore not possible to estimate the genetic variance and, therefore, the relationship, this means that there is
intense response from the progenies before changes in environmental factors imposed. In the native population of Amapá, the situation was similar, with only VA and NEF contributing to genetic variance, allowing be estimated the relationship, which was 0.50 and 0.75 respectively. This behavior clearly shows that H. speciosa is highly responsive to its environment, suggesting that the information from our study can be used to develop adequate management plans in terms of mineral nutrition, irrigation, handling, and establishment of a cultivation system.
Table 2. Genetic and phenotypic parametersa for 10 biometric and reproductive characteristicsb evaluated in mangabeira
progenies (Hancornia speciosa) originating from Paraíba (P1) and from Amapá (P2).
aσ2
F phenotypic variance based on the average of plots; σ2G genetic variance based on the average of plots; σ2r: residual
variance; R2%: determination coefficient from average level in the broad sense in percentage; CVg (%): genotypic
variation coefficient in percentage; CVg/ CVa: relationship between genotypic variation coefficient by environmental variation coefficient.
bVA: agronomic value; CCP: treetop circumference; ALP: plant height; NEF: estimated number of fruits on the plant;
COF: fruit color; PMF: average weight of ten fruits; PMP: average weight of ten fruits pulp; DF: fruit diameter; NMS: average of seeds of ten fruits; CMF: average length of ten fruits.
Sources of Variationb
Pop Prog Rep Residual CVc Average
VA 0.0104ns 0.2905** (42) 0.0878ns 0.0860 (43) 14.311 2.049
CCP 29.6978** 0.1609ns 0.0012ns 0.1706 19.203 2.151 ALP 3.9271** 0.5153* 0.0121ns 0.2875 9.620 5.574 NEF 74,862.8376** 571.4937ns 1,439.5346ns 379.2935 61.134 31.857 COF 5.8497** 0.1628ns 0.2500ns 0.1741 23.579 1.769
PMF 132,825.1420** 980.9598ns 18.1818ns 1,442.0888 17.050 222.727 DF 699.5271** 9.1971ns 10.3984ns 8.0714 9.028 31.470 PMP 94,257.5511** 669.8080ns 324.5568ns 1,075.6964 18.248 179.739 NMS 30.7447ns 7.0424ns 0.8249ns 9.7677 24.568 12.721
CMF 1,597.4886** 11.2350ns 8.4073ns 12.2463 8.985 38.949
2
F 2G 2r R2 % CVg % CVg/CVa
P1 P2 P1 P2 P1 P2 P1 P2 P1 P2 P1 P2
VA 0.166 0.044 0.123 0.015 0.043 0.029 74.001 33.260 17.040 5.944 1.19 0.50
CCP 0.075 0.106 0.041 0.000 0.034 0.306 54.507 - 10.798 - 0.77 -
ALP 0.298 0.058 0.154 0.000 0.144 0.079 51.649 - 6.911 - 0.73 -
NEF 57.489 1427.038 15.137 754.035 42.351 673.003 26.331 52.839 21.487 29.297 0.42 0.75
COF 0.090 0.041 0.000 0.000 0.978 0.041 - - - -
PMF 531.905 283.353 0.000 0.000 692.283 967.781 - - - -
DF 4.874 3.219 1.680 0.000 3.195 8.640 34.457 - 3.951 - 0.51 -
PMP 390.357 57.638 0.000 0.000 553.204 522.996 - - - -
NMS 3.540 3.429 0.000 0.000 4.214 8.794 - - - -
Rev. Caatinga
In the evaluated characteristics (Table 3), Pearson correlations were estimated for the native population of Amapá separately from the Paraiba ones and later together, which enabled us to observe that plants with larger height (ALP) and circumference (CCP) have a better appearance and therefore better agronomic value (VA), in addition to higher amounts of fruit (NEF) and a more intense, red color (COF), also reflected in better VA for each population, separately. Metric and weight dimensions of fruits had no effect on VA.
In the Amapá population, taller plants also had a larger treetop diameter (CCP), while in the Paraíba population, height and diameter were completely independent, and also in relation to other characteristics. The larger diameter of the treetop was also accompanied by a greater quantity of fruits. In a joint analysis, we noticed that with the further development of the treetop, the fruits became smaller and more yellowish, compared to tree height, for which we observed an inverse trend, i.e., fruits tended to be larger and redder for taller trees.
Therefore, early selection of fruit color and size could be based on the shape of the tree. However, But Freitas et al. (2012) did not observe the existence of ALP correlations with other characteristics evaluated.
In terms of general quantity of fruits, we observed an increase of the number of fruits on the plant, with the tendency of these fruits to be smaller and more yellow, suggesting that the plants respond in order to achieve a balanced productivity.
In terms of fruit color, higher trees were associated with a more reddish blue color and the lowest tendency to produce yellow fruits. As expected, there was a positive relationship between fruit size and weight.
All correlations obtained, especially between vegetative characteristics and fruits, were similar to those observed by Souza et al. (2007), Capinan et al. (2007), and Ganga et al. (2010). Our results are also in agreement with those found by Freitas et al. (2012), except in terms of ALP.
Table 3. Pearson correlations for 10 biometric and reproductive characteristicsa evaluated in mangabeira progenies
(Hancornia speciosa). Values above the diagonal in italic refer to the native population from Amapa and values in non-italic fonts refers to the Paraíba population; values below the diagonal refer to the two populations together.
aVA: agronomic value; CCP: treetop circumference; ALP: plant height; NEF: estimated number of fruits on the
plant; COF: fruit color; PMF: average weight of ten fruits; PMP: average weight of ten fruits pulp; DF: fruit diameter; NMS: average of seeds of ten fruits; CMF: average length of ten fruits.
*significant at 5% significance level by the t-test, **significant at 1% significance level by the t-test and ns not significant.
VA CCP ALP NEF COF PMF DF PMP NMS CMF
VA 73.26** 28.54* 39.61** 28.33* 14.39ns 9.97ns 10.79ns 28.44* 16.05ns
80.82** 6.78ns 68.19** -0.48ns 17.15ns 8.64ns 11.17ns 26.60ns -10.88ns
CCP 35.83** 31.82** 25.66* 15.33ns 7.24ns 19.10ns 2.88ns 26.87* 21.13ns 11.21 ns 65.43** -8.78ns 19.23ns 4.62ns 19.18ns 50.49* -9.35ns
ALP 26.19* -13.17ns 22.71ns 5.93ns 1.57ns -0.57ns -9.30ns 11.83ns 3.49ns 12.70ns -7.88ns 4.22ns 29.18ns 12.05ns 14.44ns 31.21ns
NEF 17.27ns 82.20** -18.78ns 18.64ns
-9.28ns
-13.97ns
-8.78ns
11.11ns
-6.51ns -17.51ns -0.81ns -13.42ns 11.09ns 9.34ns 3.93ns
COF 23.30* -39.73** 20.97* -41.64** 10.12ns -9.41ns 10.91ns -7.46ns -15.41ns -9.79ns -3.77ns 0.79ns -29.65ns -28.72ns
PMF 11.51ns -57.95** 25.31* -61.60** 44.37** 50.22** 93.97** 23.14ns 41.92** 89.03** 81.31** 44.34ns 68.45**
DF 8.64ns -51.65** 24.84* -60.44** 32.14** 79.60** 51.85** 13.05ns 66.95** 79.73** 43.82ns 73.19**
PMP 9.08ns -59.11** 19.52ns -59.83** 45.51** 96.44** 78.61** 17.75 ns 41.67** 63.42** 63.71**
NMS 27.31** 2.16ns 17.60ns -11.48ns 2.09ns 32.91** 28.30** 31.47** -0.58ns 16.39ns
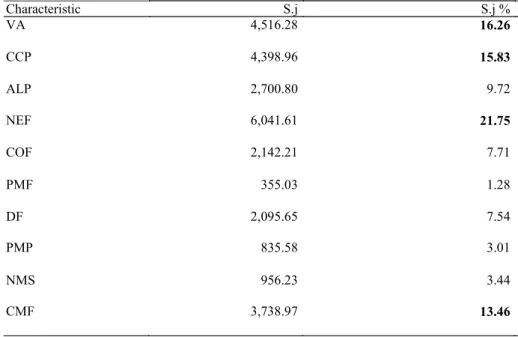
In the relative contribution of the characteristics (s.j%) for diversity based on Mahalanobis distance, as shown in Table 4, the most important parameters were NEF (21.75%), VA (16.26%), CCP (15.83%), and CMF (13.46%), contributing more significantly to the divergence, mainly because these are the characteristics that most differentiate the two populations. As NEF was the main component, with almost 25% of variability, it is related to fruit quantity and an important descriptor for the species. Despite the fact that diameter and longitudinal length of the fruits contributed somehow, the characteristics PMF, PMP, NMS had low values of contribution to diversity, which was contrary to our expectations. once associated to the
dimensions, so, based on this behavior in future evaluations may be discarded. One possible explanation for the change of the relative importance of weight in relation to size is that both diametrical and longitudinal length of fruit acted in independent and different ways, resulting in a compensation for the final weight of the fruit; therefore, longer fruits had smaller diameters and those with smaller longitudinal size presented larger circumference values, concentrating variation close to the average. The evaluation of such characteristics is important because an elevated number causes lower efficiencies of gain, higher costs, and increases the time to perform measurements in a breeding program.
Table 4. Relative contribution of biometric and reproductive characteristics evaluated in mangabeira progenies (Hancornia speciosa), based on d² Mahalanobis.
characteristic suggested for disposal: PMF
aVA: agronomic value; CCP: treetop circumference; ALP: plant height; NEF: estimated
number of fruits on the plant; COF: fruit color; PMF: average weight of ten fruits; PMP: average weight of ten fruits pulp; DF: fruit diameter; NMS: average of seeds of ten fruits; CMF: average length of ten fruits.
S.j: contribution of each characteristic to the morphological dissimilarity in absolute value; S.j %: contribution of each characteristic to the morphological dissimilarity in percentage relative to the sum of all the contributions.
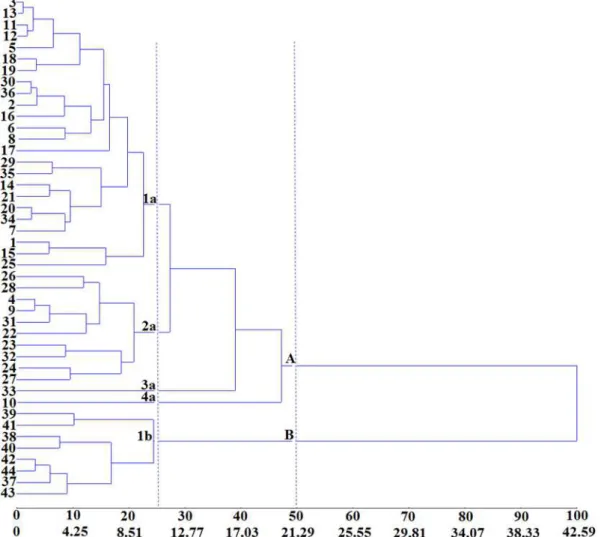
The limit of establishment of groups in the dendrogram, as in Cruz, Regazzi and Carneiro (2012), was performed in order to not be drastic, obtaining mainly the composition of two distinct populations, adding the progenies of native mangabeiras and another with those from Paraiba, based on Amapa genetic material which was not submitted to the selection process in breeding programs. The limit adopted for group formation was an average dissimilarity measure of 50%. Since the method used was the UPGMA (unweighted Pair Group Method with Arithmetic Mean), the criteria
distances between all pairs of items that compose each group. In terms of breeding, Dudley (1994) refers to the UPGMA method as superior to the methods of the nearest and farthest neighbor.
Figure 1 shows that based on the first criterion, the largest group, group A comprising 36 progenies (from 1 to 36), was subdivided into subgroups composed of fewer progenies. In contrast, group B contained eight progenies (from 37 to 44). While group A was composed only of native progenies of Amapá, group B included Paraíba progenies, proving that both populations evolved
Characteristic S.j S.j %
VA 4,516.28 16.26
CCP 4,398.96 15.83
ALP 2,700.80 9.72
NEF 6,041.61 21.75
COF 2,142.21 7.71
PMF 355.03 1.28
DF 2,095.65 7.54
PMP 835.58 3.01
NMS 956.23 3.44
Rev. Caatinga
introduction of Northeast materials, positioning that, often was supposed empirically, due to intense immigration of people from the Northeast. For more rigorous verification purposes of homogeneity for grouping among progenies, we adopted the dissimilarity of 25% for the formation of four groups. The first group, 1a, contained 24 native progenies; the second group, 2a, contained 10 native progenies, the third group, 3a, contained three native progenies, the forth group, 4a, contained one native progeny. In group 1a, there were only eight progenies from Paraiba: as this group has several subdivisions, not concentrating progenies into subgroups, but composing other minors reinforces the point that the species has not yet been domesticated in this region. Thus, the collection of wild material can be used to determine genetic variability and to exploit this diversity in breeding programs to obtain superior genetic combinations
and to generate different crossings, especially when different materials from 1a, 2a, 3a, 4a, and 1b are chosen. This study also observed similar variability as in Freitas et al. (2012) and Ganga et al. (2010) in terms of treetop volume, fruit weight, and number of seeds.
The composition of the groups of the progenies did not occur in sequential order, as was probably expected because the prospective collection was carried out within specific areas, demonstrating that there was no continuous dispersion along the subpopulations found in Amapá. As there is a pronounced effect of environmental factors on progeny characteristics, the different environments may have altered the phenotype; therefore, it was not possible to observe continuous distribution. It is important to highlight that native progenies of Amapa and the ones from Paraíba were composed of distinct groups.
Figure 1. Phenograms of the dissimilarity obtained by clustering method UPGMA (average linkage between groups), based on the generalized Mahalanobis distances from ten characteristicsa of the mangabeira progenies (Hancornia speciosa). aVA: agronomic value; CCP: treetop circumference; ALP: plant height; NEF: estimated number of fruits on the plant; COF:
CONCLUSIONS
The phenotypic manifestation observed in the progenies was due mainly to responses to environmental variations, superior to those generated by genetic factors.
In the correlations, inherent fruit
characteristics (weight, size, and color) did not affect agronomic value, while the biometric characters influenced the agronomic value. Higher plants had larger fruits and the plants with larger diameter produced larger amounts of smaller fruits.
The estimated number of fruits (NEF) was the main component of dissimilarity results, followed by the agronomic value and the plant circumference, with the characteristics related to fruit having less importance for the morphological dissimilarity;
There is a need for further genetic characterization studies of the estimated number of fruits (NEF) to further elucidate the dissimilarity between the progenies and the evaluated populations.
The two studied populations are
morphologically dissimilar, indicating the possibility of obtaining superior individuals.
REFERENCES
BRASIL, Ministério do Meio Ambiente – MMA
Relatório Técnico de Monitoramento do Desmatamento no Bioma Cerrado, 2001 a 2008:
Dados Revisados. CENTRO DE
SENSORIAMENTO REMOTO-CSR/IBAMA
-Nov. 2009 DF. Disponível em: http:// www.mma.gov.br/estruturas/sbf_chm_rbbio/
_arquivos/
relatorio_tecnico_monitoramento_desmate_bioma_c errado_csr_rev_72_72.pdf. Acesso em: 08 mar.
2016.
CAPINAN, G. C. S. et al. Caracterização agronômica de plantas e frutos de mangabeiras do estado da Bahia. Magistra, Cruz das Almas; v. 19, n. 4, p. 290-298, 2007.
CRUZ, C. D.; REGAZZI, A. J.; CARNEIRO, P. C. S. Modelos biométricos aplicados ao melhoramento genético. 4. ed. Viçosa, MG: Editora UFV, 2012, 514 p.
CRUZ, C. D. GENES - a software package for
analysis in experimental statistics and quantitative genetics. Acta Scientiarum, Maringá, v. 35, n. 3, p. 271-276, 2013.
DUDLEY, J. W. Comparison of genetic distance estimators using molecular marker data. In: SYMPOSIUM ANALLYSIS OF MOLECULAR DATA, 2., 1994 Corvallis. Proceedings... Virginia:
American Society for Horticultural Science, 1994. p. 3-7.
DURÃES, F. O. M.; SUNDFELD, E.; SILVA, J. E. da Fontes Alternativas de Energia e Perspectivas do Uso da Agroenergia no Mundo. In: FALEIRO, F.
G.; FARIAS NETO, A. L. de (Eds.). Savanas:
desafios e estratégias para o equilíbrio entre sociedade, agronegócio e recursos naturais.
Planaltina: Embrapa Cerrados, 2008. cap. 26, p.
837-860.
FERREIRA, E. G. A cultura da Mangaba. In: BRASIL, Ministério da Agricultura, Pecuária e
Abastecimento. Produção integrada no Brasil:
agropecuária sustentável alimentos seguros.
Brasília: Mapa/ACS, 2009, v. 01, cap. 22, p.
665-683.
FERREIRA, E. G. et al. Caracterização molecular de mangabeira (Hancornia speciosa) dos tabuleiros
costeiros de Pernambuco e Rio Grande do Norte no
Nordeste do Brasil. Revista Verde de Agroecologia
e Desenvolvimento Sustentável, Mossoró, v. 8, n. 1, p. 7-10, 2013.
FREITAS, M. K. C. de et al. Variabilidade fenotípica e caracterização morfológica de uma
população natural de Hancornia speciosa Gomes.
Bioscience Journal, Uberlândia, v. 28, n. 5, p. 833-841, 2012.
GANGA, R. M. D.; CHAVES, L. J.; NAVES, R. V.
Parâmetros genéticos em progênies de Hancornia
speciosa Gomes do Cerrado. Scientia Forestalis,
Piracicaba, v. 37, n. 84, p. 395-404, 2009.
GANGA, R. M. D. et al. Caracterização de frutos e árvores de populações naturais de Hancornia speciosa Gomes do cerrado. Revista Brasileira de Fruticultura, Jaboticabal, v. 32, n. 1, p. 101-113,
2010.
INSTITUTO NACIONAL DE METEOROLOGIA
-INMET. BDMEP - Banco de Dados
Meteorológicos para Ensino e Pesquisa.
Disponível em: http://www.inmet.gov.br/portal/ index.php?r=bdmep/bdmep. Acesso em: 01 ago. 16.
LIMA, I. L. P.; SCARIOT, A. O.; GIROLDO, A. B. Sustainable harvest of mangaba (Hancornia speciosa) fruits in Northern Minas Gerais, Brazil.
Economic Botany, New York, v. 67, n. 3, p. 234-243, 2013.
MARTINS, G. V. et al. Diversity and genetic
structure in natural populations of Hancornia
speciosa var. speciosa Gomes in northeastern Brazil.
Rev. Caatinga
MELÉM JÚNIOR, N. J.; FARIAS NETO, J. T. de;
YOKOMIZO, G. K. Caracterização dos cerrados
do Amapá. Macapá: Embrapa Amapá, 2003. 5 p. (Embrapa Amapá. Comunicado Técnico, 105).
MOURA, N. F. et al. Genetic structure mangaba
(Hancornia speciosa Gomes) populations in the
Cerrado region of Central Brazil. Bioscience
Journal, Uberlândia, v. 27, n. 3, p. 473-481, 2011.
PERFEITO, D. G. A. et al. Caracterização de frutos
de mangabas (Hancornia speciosa Gomes) e estudo
de processos de extração da polpa. Revista de Agricultura Neotropical, Cassilândia, v. 2, n. 3, p. 1-7, 2015.
SANO, S. M. et al. Avaliação de progênies de mangabeira, espécie nativa do Cerrado.
Planaltina, DF: Embrapa Cerrados, 2012. 20 p.
(Embrapa Cerrados. Boletim de Pesquisa e
Desenvolvimento, 307).
SANTOS, E. A.; SOUZA, R. M. Territorialidade das catadoras de mangaba no litoral sul de Sergipe.
Geosaberes, Fortaleza, v. 6, n. 3, p. 629-642, 2016.
SAS INSTITUTE (Cary, Estados Unidos). SAS
language and procedures: usage. Version 8.1.
Cary, NC, 2000. 1 CD-ROM.
SILVA JUNIOR, J. F. et al. Variabilidade em populações naturais de mangabeira do litoral de
Pernambuco. Magistra, Cruz da Almas, v. 19, n. 4,
p. 373-378, 2007.
SINGH, D. The relative importance of characters affecting genetic divergence. Indian Journal of Genetic and Plant Breeding, New Delhi, v. 41, n. 2, p. 237-245, 1981.
SOARES, F. P. et al. Efeito de meios de cultura, concentrações de GA3 e pH sobre a germinação in vitro de mangabeira (Hancornia speciosa Gomes). Ciência e Agrotecnologia, Lavras, v. 33, Sup., p. 1847-1852, 2009.
SOUZA, F. G. et al. Qualidade pós-colheita de frutos
de diferentes clones de mangabeira Hancornia
speciosa Gomes. Ciência e Agrotecnologia, Lavras,
v. 31, n. 6, p. 1449-1454, 2007.
VIEIRA NETO, R. D.; SILVA JUNIOR, J. F. da;
LEDO, A. da S. Mangaba. In: SANTOS-SEREJO, J.
A. dos et al. (Eds.). Fruticultura tropical: espécies regionais e exóticas. Brasília: Embrapa Informação