v.12, n.3, p.274–281, 2008
Campina Grande, PB, UAEAg/UFCG – http://www.agriambi.com.br Protocolo 136.06 – 27/10/2006 • Aprovado em 16/11/2007
Radiation balance of coffee hedgerows
Luiz R. Angelocci1, Fábio R. Marin2, Felipe G. Pilau2, Evandro Z. Righi3 & José L. Favarin1
ABSTRACT
The radiation balance of hedgerows is an important variable in studies of mass and energy exchanges between parcial ground cover crops and the atmosphere. This paper describes a device with eight net radiometers encompassing the plants of a hedgerow. The radiometers were moved along a length of hedgerow, in a continuous and reversible move-ment. The canopy net radiation in this length (Rnc) was found by integration of the measurements over the notional cylinder formed. The device showed good performance and provided reliable measurements of Rnc of coffee hedgerows, showing itselfto be an useful technique of measurement in field conditions. Good correlations between Rnc and global solar radiation, turfgrass and coffee crop net radiation were found in 15-min, daytime and 24-hr periods, allowing the possibility of estimating Rnc from these simple measurements. Beer’s law was also used to have an independent estima-tion of Rnc. A good agreement was found between values of Rnc estimated by this law of attenuaestima-tion and those inte-grated by the device in periods of 15 min, with overestimation of 10%, whereas for values inteinte-grated over daytime pe-riods the agreement was not satisfactory.
Key words: correlation, instrumentation, solar radiation, net radiation
Balanço de radiação de renques de cafeeiros
RESUMO
A radiação, tanto de ondas curtas como de ondas longas, absorvida por um renque de plantas de uma cultura que cobre de forma descontínua o solo, é uma variável importante para os estudos das trocas de massa e de energia com a atmosfera. Este trabalho apresenta um dispositivo que movimenta oito saldo-radiômetros dispostos em torno de um renque. O movimento de ida e volta ao longo de um trecho de um renque, permite a integração do saldo de radiação na superfície de um cilindro nocional de medidas, representando o balanço de radiação (Rnc) do trecho amostrado. O equipamento apresentou um bom desempenho quando empregado em dois cafezais, mostrando potencial para a realização de medidas de campo, com valores medidos confiáveis. Foram obtidas boas correlações entre Rnc e a irradiância solar global e, também, entre Rnc e o saldo de radiação medido sobre gramado e sobre o cafezal, para dados obtidos em intervalos de 15 minutos, diurnos e diários. Uma adaptação da Lei de Beer também foi avaliada para modelagem de Rnc, resultando valores superestimados em 10% em relação aos valores integrados em 15 minutos pelo dispositivo móvel , mas para os integrados no período diurno a concordância entre dados estimados e medidos não foi boa.
Palavras-chave: correlação, instrumentação, radiação solar, saldo de radiação
1ESALQ/USP, CEP 13418-900, Piracicaba, SP. Fone: (19) 3429-4283. E-mail: [email protected]. Bolsista do CNPq
2Embrapa Informática Agropecuária, Av. André Tosello, 209, C.P. 6041, CEP 13083-886, Campinas, SP. Fone: (19) 3789-5789. E-mail: [email protected]; [email protected]
A.
B.
Figure 1. Views of the moving device. Left: free of plants; the frame with the radiometers, the datalogger and the rails are shown (A). Right: the system installed in the coffee crop (B)
I
NTRODUCTIONThe amount of all-wave radiation absorbed by a canopy is an important variable determining transpiration and pho-tosynthesis. Measurement of net radiation of single trees or hedgerows of orchards, vineyards and coffee plantation is not easily carried out. To overcome this difficulty, some models have been proposed to estimate light interception by trees (Wünche et al., 1995) and the absorption of radiation by hedgerow canopies, as well as for orchards and vineyards (Charles-Edwards and Thornley, 1973; Charles-Edwards and Thorpe, 1976; Riou et al., 1989).
Nevertheless, direct measurements are required to validate the models. Landsberg et al. (1975) and Thorpe (1978) used eight fixed linear net radiometers deployed along a row in an apple orchard, in order to integrate all-wave radiation absorbed by 1.0 m of hedgerow, assuming horizontal cylindrical geom-etry of measurements. McNaughton et al. (1992) developed a device, which they named “Whirligig”, with eight net radi-ometers and sixteen PAR sensors fixed on a circular frame,
rotating around a tree of Robinia pseudoacacia, allowing
time-space integration of the radiation balance of the tree. The “Whirligig” technique has been used in some studies involv-ing radiation balance of isolated trees (Green, 1993; Green et al., 1995; Green and McNaughton, 1997; Green et al., 2001; Angelocci et al., 2004).
Direct measurement of radiation absorbed by canopies of crops planted in hedgerows needs to be more studied. This paper describes a device designed to measure all-wave ra-diation absorbed by the canopy of plant hedgerows and its performance when used in coffee crops, allowing time-space integration of the measurements by using moving net radi-ometers. The measured values were correlated to global so-lar radiation, turfgrass and coffee crop net radiation and were also compared with the absorbed radiation by the hedgerows estimated from Beer’s law.
M
ATERIALANDMETHODSThe measurements were carried out during ten days from
August to October 2002 in a 5 year old crop of Coffea
arabica L. cv. Mundo Novo, grafted on Coffea canephora
cv. Apoatã, and during nine days in April and May 2004, in
a 3 year old crop of Coffea arabica cv. Obatã , in Piracicaba,
SP, Brazil (22° 42’ S; 47° 30’ W; 546 m). The coffee plants were planted in rows oriented approximately SE-NW (azi-muth of 345°), with spacing of 2.5 X 1.0 m and 3.5 X 0.9 m, forming hedgerows of 2.5 m-height and 1.6 m-wide, and 1.2 m-height and 0.8 m wide in 2002 and 2004, respectively. The soil was a Typic Rhodustults.
The all-wave radiation balance was measured using eight net radiometers model Q7.1 (Radiation and Energy Balance Systems, Seattle, WA, USA) by scanning four plants. They were fixed at intervals of 45° on a vertical circular frame built with a iron tube (40 mm diameter), with diameters of 2.3 m in 2002 and 1.46 m in 2004, encompassing the canopy (Figure 1A, B). The frame was open at the bottom to allow
its free displacement along the hedgerow. It moved on two iron rails installed along the plant row, in a continuous and reversible movement driven by an iron chain coupled to a gearbox and powered by an electrical motor (0.75 HP) fixed at the end of one rail. When the frame reached one of the ends of the pathway it passed in front of a photocell, which emitted an electrical signal activating a system for revers-ing the movement of the frame and, consequently, the di-rection of the displacement. In the other end of the pathway, the movement reversion was provided by a worm gear. The time spent by the sensors to complete a cycle of displace-ment was 40 seconds.
In 2004, as a consequence of the frequent movement stops of the device in 2002, occurring just after the reversal of the movement, the photocell was eliminated and a simple, to-tally mechanical system of reversion described by Pilau & Angelocci (2004) was used, solving the problem.
(1) d .2. .Rh π
Rni 8 1 Rnc=
8
i 1=
NR 1 NR 2
NR 3
NR 4
NR 5
NR 6
NR 7
NR 8
frame
rail Net radiometer
2.30 m
Figure 2. Schematic representation of the net radiometers placement on the circular frame. The displacement of the sensors along the coffee plants row determines a notional cylindrical geometry of measurement
(2) LAI
Rnac 1−e −k.LAI
(
)
Rnc/LA=
(3) ALA=LWF
of apple orchard, with a cylindrical geometry of measure-ment. McNaughton et al. (1992) also used the same number of radiometers when they proposed the use of the “Whirli-gig” around an isolated tree. They found that placing the sensor plate of the net radiometers in non-horizontal posi-tions did not have a significant effect on their calibration fac-tors determined in the horizontal position. Calibrations of the net radiometers were performed in the horizontal posi-tion, being calculated to match all the sensors to the mean value of the set of them.
In the cylindrical geometry of measurements, it was as-sumed that each radiometer sampled 1/8 of the lateral sur-face of the notional cylinder of measurements, without tak-ing into account the radiation exchange by the bases of the cylinder. So, the integrated value of all-wave radiation ab-sorbed by a segment of coffee plants row in a period of time can be computed by:
where Rni is the net radiation measured by each radiometer;
dh the horizontal distance of the hedgerow scanned by the
sensors and R the radium of the imaginary cylinder. The device, including the rails, was black-painted to re-duce the reflection of solar radiation. This procedure was adopted because some measurements performed before the painting and with no plant inside the frame showed that reflection of solar radiation could be an important source of error. Alignment of the net radiometers was carried out by focusing each one to the geometric center of the circular frame. Thus, the plate of one radiometer faced that of the opposite one in the frame (Figure 2).
A datalogger CR-10 X (Campbell Scientific, Logan, Utah, USA) was fixed to the circular frame at the distance of 0.5 m from it (Figure 1A), being moved together with the frame and recording the signals each second, with storage of aver-ages every 15 minutes.
Relationships were established between all-wave coffee hedgerow net radiation and global solar radiation and all-wave turfgrass net radiation measured in a meteorological station located 200 m from the coffee crop. Regression analy-sis were used with values integrated over 15 min, daytime and 24-hr periods.
The absorbed energy per leaf area unit was also esti-mated by using Beer’s law with the extinction coefficient of coffee trees determined by the technique proposed by Ritchie (1972). Net radiation absorbed by leaves was cal-culated by Eq. 2 and the estimated values were compared to those determined from the measurements by the mov-ing radiometers:
where Rnc/LA is the radiation absorbed per leaf area unit
(W m-2); Rn
ac the net radiation measured above the crop per
unit of ground area (W m-2); k the extinction coefficient; LAI
the leaf area index with basis on the projected area of the canopy on the ground.
To calculate the extinction coefficient it was considered that the average of the values measured by NR1 and NR8 represented net radiation under the canopy and those of NR4 and NR5 net radiation on the top of the canopy (Figure 2). During the measurements in 2002, a net radiometer (NR Lite, Kipp & Zonen, Netherlands) was installed 4.0 m above the ground, to measure net radiation of the coffee crop. Es-timation of radiation absorbed by the hedgerow by Beer’s law was not tested in 2004 because there was no measurement of net radiation above the crop.
Leaf area (LA) of each scanned plant was determined by two methods. In the first method, all leaves of these plants were counted and multiplied by the mean leaf area (ALA) calculated by:
where L is the mean length and W the mean width of leaves determined from a sample of 10% of the leaves of the plants scanned by the system, and F a factor obtained from a lin-ear regression equation between the individual leaf area measured by an area meter (LI 3100 Area Meter, LI-COR, Inc.) and the product of the length (L) by the width (W) of 50 leaves randomly collected from the scanned coffee plants,
resulting in a value of 0.703 (R2= 0.99). This same factor
0.703, obtained in 2002, was also used to determine the leaf area of coffee plants in 2004.
d o h t e M
2 0 0
2 2004
1 l
P Pl2 Pl3 Pl4 Pl1 Pl2 Pl3 Pl4
m ( A
L 2) LAI LA(m2) LAI LA(m2) LAI LA(m2) LAI LA(m2) LA(m2) LA(m2) LA(m2)
0 0 0 2 -I A
L 9.1 13.8 11.6 6.1
g n it n u o
C 9.6 14.0 11.1 5.9 3.2 2.2 2.4 3.0
e g a r e v
A 9.3 3.6 13.9 4.5 11.4 3.4 6.0 2.4 3.2 2.2 2.4 3.0
Table 1. Values of leaf area (LA) for each plant (PI) determined with the canopy analyzer and by counting the leaves and measuring their width and length. Leaf area index (LAI) was calculated based on the projected canopy area on the soil surface
Net
radiation
(W
m)
-2
A.
-400 -200 0 200 400 600
800 Day 256 NR1
NR2 NR3 NR4 NR5 NR6 NR7 NR8
Net
radiation
(W
m)
-2
B.
-400 -200 0 200 400 600 800
Local time (hr)
Day 260 NR1
NR2 NR3 NR4 NR5 NR6 NR7 NR8
0 2 5 7 10 12 15 17 20 22
Figure 3. Daily course of net radiation measured by the eight sensors in two days of the year: Day 256: overcast sky (A); day 260 – clear sky (B). See Figure 2 for the positions (NR1… NR8) of the net radiometers.
R
ESULTSANDDISCUSSIONExamples of the daily course of the eight net radiometers measurements through days with overcast (A) and clear sky (B) in 2002 are shown in Figure 3. With clear sky, an ex-pected temporal (morning and afternoon) symmetry of the radiation absorbed by the two hedgerow faces was observed due to the planting rows orientation, as showed by the curves of the four upper net radiometers (3 and 4 facing to SE and 5 and 6 to NW quadrants). The upper half of the canopy was responsible for more than 90% of the coffee hedgerow net radiation. The participation of the lower half part of the canopy on the total amount of absorbed radiation was very small, with slightly positive or negative values, due to the high leaf density leading to high attenuation of radiation. In days of overcast sky, the symmetry of the absorbed radiation by the two sides of the hedgerow was not well defined due to the predominance of multi-directional diffuse radiation, but the largest contribution of the upper-half canopy sensors was always present.
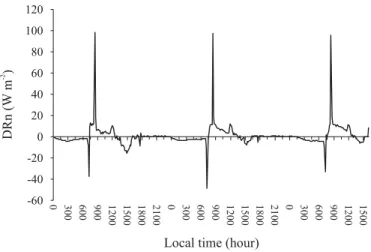
The lack of an independent method to measure the ab-sorption of radiation by the canopy made difficult the evalu-ation of the performance of the moving device and to draw conclusions about the reliability of its measurements, as also discussed by McNaughton et al. (1992). One error source is the null deviation, which can be detected by performing the measurement with the device free of plants inside it. In this situation values close to zero are expected, because if the opposite net radiometers are matched, instantaneous mea-surements and, consequently, the integrated values of the eight radiometers should be null for a determined period of time. So, the deviation from the null (DRn) of the integrated values of the eight net radiometers can be taken as a mea-sure of the partial error introduced by problems of sensor positioning or by other sources of errors, like sensors cali-bration and reflected radiation from the device components on the sensors.
Daily course of DRn for periods of 10-min is shown in Figure 4. Two peaks observed through each day, one of
nega-tive values, reaching about -40 W m-2 around 7:00 AM and
the other of positive values up to 100 W m-2 around 9:00 AM.
The mean DRn in the daytime was equal to 10.0 W m-2,
whereas in the night time low deviations tending to zero were observed. The mean values of DRn throughout the three days
was 5.6 W m-2, caused predominantly by the two peaks in
y = 0.6675x
R = 0.72892
0 10 20 30 40 50 60 70 80 90 100
0 50 100 150
Absorbed net radiation (MJ d )-1
Latent
heat
flux
(transp.)
(MJ
d
)
-1
Figure 5. Relationship between daily values of latent heat flux (equivalent to the coffee canopy transpiration) and coffee plants net radiation, both calculated for four plants scanned by the net radiometers in 2002 (4.28 m of hedgerow)
-60 -40 -20 0 20 40 60 80 100 120
0 300 600 900 1200 1500 1800 2100 0 300 600 900 1200 1500 1800 2100 0 300 600 900 1200 1500
Local time (hour)
DRn
(W
m
)
-2
Figure 4. Variation of the null deviation of the net radiation measurements with the device free of plants inside it, over three days
the integrated value of net radiation in the daytime or 24-hour periods. McNaughton et al. (1992) also found small values of DRn in their study with the “Whirligig”.
Another way to check the reliability of the values of Rnc is to compare them with the latent heat flow of the coffee canopy. During the net radiation measurements in 2002, daily sap flow of the four encompassed plants was determined by the stem heat balance method (Sakuratani, 1981; Baker & Van Bavel, 1987), as described by Marin (2003). If the sap flow of the four plants integrated in 24-h period is consid-ered as representative of the daily transpiration (Valancogne & Nasr, 1993), then it is possible to calculate the latent heat flux equivalent to transpiration in a 24-h period and com-pare it with the net radiation absorbed by the coffee canopy in the same period. A good relationship between the two variables is shown in Figure 5, indicating that the heat
la-tent flux (LE) was equivalent to about 67% of Rnc. If calcu-lated by the average of the ratios of these two variables, in the studied days, LE represented 73% of the net radiation absorbed by the coffee plants. As these plants were irrigated, the latent heat flux predominated over the sensible heat flux and the ratio of about 2:1 between these two processes, found in this study, seems very reasonable, strengthening the con-clusion about the reliability of the measurement by the mov-ing system.
Linear relationships, forced to pass by the origin of the x-y axis fitted well net radiation by hedgerow length unit
(Rnc, expressed in MJ m-1 15 min-1) and global solar
ra-diation and turfgrass net rara-diation (Rg and Rng, in
MJ m-215 min-1), for 15-min periods (Figure 6A, B).
Dif-ference between leaf areas of coffee plants in the two years (Table 1) led to different slopes of the fitted lines.
Normalizing the coffee hedgerow net radiation by leaf area unit (Rnc/LA), linear relationships also fitted data for both cases (global solar radiation and turfgrass net radia-tion) for 15-min periods (Figure 6C, D), with significant
values of R2.
Values calculated for more extended periods are normally interesting for certain purposes. Values of coffee hedgerow net radiation per leaf area unit, integrated over the daytime period (from 6:00 AM to 6:00 PM in September, from 5:45 AM and 6:15 PM in October, 2002, and from 6:00 AM to 6:00 PM in April and May, 2004) and for 24-hr period were correlated with global solar radiation and turfgrass net radiation (Figure 6E, F). Linear relationships showed higher
values of R2 than curvilinear ones.
Good correlations were also observed between coffee hedgerow net radiation (Rnc and Rnc/LA) and net radiation
measured above the coffee crop (Rncrop), with quadratic
re-lationships fitting better data than linear ones (Figure 6G, H). In spite of the small number of days used, they were representative of two seasons with different solar declina-tion and the results confirm the observadeclina-tion of Angelocci et al. (2004) about the possibility of estimating hedgerow net radiation from routine and simple measurements like
Rg, Rng and Rncrop. Caution must be taken to extrapolate
the found relationships to other coffee crops, because they are valid for similar conditions of canopy geometry and leaf densities observed in this study.
A.
R = 0.91712
y = 1.3292x
2002
y = 0.6816x R = 0.90672
2004
-0,2 0,0 0,2 0,4 0,6 0,8 1,0 1,2 1,4
0,0 0,2 0,4 0,6 0,8 1,0
Rg (MJ m 15min )-2 -1
Rnc
(MJ
m
15min
)
-1
-1
2002 2004 B. y = 2.1214x
R = 0.91392
2002
y = 1.1805x R = 0.90232
2004
-0,1 0,0 0,1 0,2 0,3 0,4 0,5 0,6
Rng (MJ m 15min )-2 -1 2002 2004
D.
Rnc/LA = 0.1408Rg R = 0.88832
2002/2004
0,0 0,2 0,4 0,6 0,8 1,0
Rg (MJ m 15.min )-2 -1
C.
R = 0.8692
Rnc/LA = 0.2311Rng
2002/2004
-0,04 -0,02 0 0,02 0,04 0,06 0,08 0,1 0,12 0,14 0,16 0,18
-0,1 0,0 0,1 0,2 0,3 0,4 0,5 0,6
Rng (MJ m 15min )-2 -1
Rnc/LA
(MJ
m
15min
)
-2
-1
Rng (MJ m d )-2 -1
F.
Diurnal period Rnc/LA = 0.1499Rng + 1.1492 R = 0.58182
Daily period Rnc/LA = 0.1518Rng + 1.0887 R = 0.58452
0,0 5,0 10,0 15,0 20,0
Diurnal Daily E.
Diurnal period Rnc/LA = 0.1154Rg + 0.5185 R = 0.72652
0,0 1,0 2,0 3,0 4,0
0,0 10,0 20,0 30,0
Rg (MJ m d )-2 -1
Rnc/LA
(MJ
m
d
)
-2
-1
G.
Rnc = 1.821Rncrop R = 0.92352
-0,2 0,0 0,2 0,4 0,6 0,8 1,0 1,2
-0,1 0,0 0,1 0,2 0,3 0,4 0,5 0,6 0,7
Rnc
(MJ
m
15min
)
-2
-1
Rncrop (MJ m 15min )-2 -1
H.
Rnc/LA = 0.1794Rncrop R = 0.92352
-0,02 0,00 0,02 0,04 0,06 0,08 0,10 0,12
-0,1 0,0 0,1 0,2 0,3 0,4 0,5 0,6 0,7
Rncrop (MJ m 15min )-2 -1
C
ONCLUSIONS1. The moving system had a good performance, showing itself to be a technique able to give reliable measurements of coffee hedgerows net radiation.
2. Good relationships between the radiation balance of coffee hedgerows (Rnc) and global solar radiation, gross net radiation, and coffee plantation net radiation were found, showing the possibility to estimate the first from one of the three variables.
3. Estimates of absorbed radiation by the canopy, based on Beer’s law, agreed well with the measured values in-tegrated for 15-min periods, with an tendency of overes-timation of about 10%, while for integrated values for the daytime period there was a tendency of overestimation of about 28%.
A
CKNOWLEDGEMENTSTo Dr. Paulo Cesar Sentelhas, for the critical review of the manuscript. To Fundação de Amparo a Pesquisa do Estado de São Paulo (FAPESP), Conselho Nacional de Desenvolvimento Científico e Tecnológico (CNPq) and Coordenação de Aperfeiçoamento do Pessoal de Nível Supe-rior (CAPES) for the financial support and fellowships.
LITERATURE CITED
Angelocci, L. R.; Villa Nova, N. A.; Coelho Filho, M. A.; Marin, F. R. Measurements of net radiation absorbed by isolated acid
lime trees (Citrus latifolia Tanaka). Journal of Horticultural
Science and Biotechnology, v.79(5), p.699-703, 2004. Baker, J. M.; van Bavel, C. H. M. Measurements of mass flow of
water in stems of herbaceous plants. Plant, Cell and Environ-ment, v.10, p.777-782, 1987.
Charles-Edwards, D. A.; Thornley, J. H. M. Light interception by an isolated plant: a simple model. Annals of Botany, v.37, p.919-928, 1973.
Charles-Edwards, D. A.; Thorpe, M. R. Interception of diffuse and direct-beam radiation by a hedgerow apple orchard. Annals of Botany, v.40, p.603-613, 1976.
Green S. R.; McNaughton, K. G. Modelling effective stomatal re-sistance for calculating transpiration from an apple tree. Agri-cultural and Forest Meteorology, v.83, n.1/2, p.1-26, 1997. Green, S. R.; Greer, D. H.; Wunsche, J. N.; Caspary, H.
Measure-ments of light interception and utilization in an apple orchard.
Acta Horticulturae, v.557, p.369-376, 2001.
Green, S. R.; McNaughton, K. G.; Greer, D. H.; Mcleod, D. J. Measurement of the increased PAR and net all wave radiation absorption by an apple tree caused by applying reflective ground covering. Agricultural and Forest Meteorology, v.76, p.163-183, 1995.
Green, S. R. Radiation balance, transpiration and photosynthesis of an isolated tree. Agricultural and Forest Meteorology, v.64, p.201-221, 1993.
Landsberg, J. J.; Beadle, C. C.; Biscol, P. V.; Butler, D. R.; Davidson, B.; Incoll, L. D.; James, G. B.; Jarvis, P. G.; Martin, P. J.; Neilson, R. E.; Powell, D. B. B.; Slack, E. M.; Thorpe, M. R.; Turner, N. C.; Warrit, B.; Watts, W. R. Diurnal energy,
wa-ter and CO2 exchanges in an apple (Malus pumila) orchard.
Jour-nal of Applied Ecology, v.12, p.645-683, 1975.
Marin, F. R. Evapotranspiração e transpiração máxima em cafezal adensado. Piracicaba: ESALQ/USP, 2003, 118p. Tese Doutorado McNaughton, K. G.; Green, S. R.; Black, T. A.; Tynan, B. R.; Edwards, W. R. N. Direct measurement of net radiation and photosynthetically active radiation absorbed by a single tree. Agricultural Forest Meteorology, v.62, p.87-107, 1992. Pilau, F. G.; Angelocci, L. R. Medida do saldo de radiação em
trechos de renque de cafezal. In. Congresso Argentino de Agrometeorologia, 2004, Mar del Plata. Anais…Mar del Plata: SAM, CD Rom
Riou, C.; Valancogne, C. Pieri, P. Une modèle simple d’interception du rayonnement solaire par la vigne – vérification expérimentale. Agronomie, v.9, p.441-450, 1989.
1:1
y = 1,096x R = 0,93582 A.
-0,05 0,00 0,05 0,10 0,15
-0,05 0,00 0,05 0,10 0,15
Rnc/LA (MJ m 15min )-2 -1
Rnc/LA_Beer
(MJ
m
15min
)
-2
-1
1:1
y = 1,277x R = 0,92822 B.
0,0 1,0 2,0 3,0 4,0
0,0 1,0 2,0 3,0 4,0
Rnc/LA (MJ m-2 d-1)
Rnc/LA_Beer
(MJ
m
d
)
-2
-1
Ritchie, J. E. Model for predicting evaporation from a row crop with incomplete cover. Water Resources Research, v.8, n.5, p.1204-1213, 1972.
Sakuratani, T. A heat balance method for measuring water sap flow in the stem of intact plant. Journal of Agricultural Me-teorology, v.39, n.1, p.9-17, 1981.
Thorpe, M. R. Net radiation and transpiration of apple trees in rows. Agricultural Meteorology, v.19, p.41-57, 1978.
Valancogne, C.; Nasr, Z. A heat balance method for measur-ing sap flow in small trees. In: Borghetti, M.; Grace, J.; Raschi, A. (ed.). Water transport in plants under climatic stress. Cambridge: Cambridge University Press, 1993. p.166-173.