TCD
5, 2159–2196, 2011Micrometeoroloical processes driving
snow ablation
R. Mott et al.
Title Page
Abstract Introduction
Conclusions References
Tables Figures
◭ ◮
◭ ◮
Back Close
Full Screen / Esc
Printer-friendly Version Interactive Discussion
Discussion
P
a
per
|
Dis
cussion
P
a
per
|
Discussion
P
a
per
|
Discussio
n
P
a
per
|
The Cryosphere Discuss., 5, 2159–2196, 2011 www.the-cryosphere-discuss.net/5/2159/2011/ doi:10.5194/tcd-5-2159-2011
© Author(s) 2011. CC Attribution 3.0 License.
The Cryosphere Discussions
This discussion paper is/has been under review for the journal The Cryosphere (TC). Please refer to the corresponding final paper in TC if available.
Micrometeorological processes driving
snow ablation in an Alpine catchment
R. Mott1, E. Egli1, T. Gr ¨unewald1, N. Dawes1, C. Manes2, M. Bavay1, and M. Lehning1
1
WSL Institute for Snow and Avalanche Research SLF, Davos, Switzerland 2
Dipartimento di Idraulica, Transporti e Infrastrutture Civili, Politecnico di Torino, Turin, Italy
Received: 19 July 2011 – Accepted: 12 August 2011 – Published: 22 August 2011
Correspondence to: R. Mott ([email protected])
TCD
5, 2159–2196, 2011Micrometeoroloical processes driving
snow ablation
R. Mott et al.
Title Page
Abstract Introduction
Conclusions References
Tables Figures
◭ ◮
◭ ◮
Back Close
Full Screen / Esc
Printer-friendly Version Interactive Discussion
Discussion
P
a
per
|
Dis
cussion
P
a
per
|
Discussion
P
a
per
|
Discussio
n
P
a
per
|
Abstract
Mountain snow covers typically become patchy over the course of a melting season. The snow pattern during melt is mainly governed by the end of winter snow depth distribution and the local energy balance. The objective of this study is to investigate micrometeorological processes driving snow ablation in an Alpine catchment. For this
5
purpose we combine a meteorological model (ARPS) with a fully distributed energy bal-ance model (Alpine3D). Turbulent fluxes above melting snow are further investigated by using data from eddy-correlation systems. We compare modelled snow ablation to measured ablation rates as obtained from a series of Terrestrial Laser Scanning campaigns covering a complete ablation season. The measured ablation rates
indi-10
cate that the advection of sensible heat causes locally increased ablation rates at the upwind edges of the snow patches. The effect, however, appears to be active over rather short distances except for very strong wind conditions. Neglecting this effect, the model is able to capture the mean ablation rates for early ablation periods but strongly overestimates snow ablation once the fraction of snow coverage is below a
15
critical value. While radiation dominates snow ablation early in the season, the turbu-lent flux contribution becomes important late in the season. Simulation results indicate that the air temperatures appear to overestimate the local air temperature above snow patches once the snow coverage is below a critical value. Measured turbulent fluxes support these findings by suggesting a stable internal boundary layer close to the snow
20
surface causing a strong decrease of the sensible heat flux towards the snow cover. Thus, the existence of a stable internal boundary layer above a patchy snow cover ex-erts a dominant control on the timing and magnitude of snow ablation for patchy snow covers.
1 Introduction
25
TCD
5, 2159–2196, 2011Micrometeoroloical processes driving
snow ablation
R. Mott et al.
Title Page
Abstract Introduction
Conclusions References
Tables Figures
◭ ◮
◭ ◮
Back Close
Full Screen / Esc
Printer-friendly Version Interactive Discussion
Discussion
P
a
per
|
Dis
cussion
P
a
per
|
Discussion
P
a
per
|
Discussio
n
P
a
per
|
variable snow-depth distribution at the time of peak accumulation (Luce et al., 1998; Liston et al., 2007; Anderton et al., 2004; Gr ¨unewald et al., 2010; Egli et al., 2011) and the local energy balance at the snow surface. As shown by several studies (e.g. Pomeroy et al., 1998; Liston and Sturm, 2002; Mott and Lehning, 2010), the end of win-ter snow cover can be highly variable due to wind-induced snow-transport processes,
5
consisting of saltation, suspension and preferential deposition of precipitation (Lehning et al., 2008; Dadic et al., 2010).
In this study, several research fields regarding snow ablation are investigated. These are the development of internal boundary layers above patchy snow covers, the local advection of sensible heat over heterogeneous surfaces, the relative contribution of
10
energy fluxes to snow ablation and the spatial variability of snow water equivalent and processes involved. In the following we give a brief overview of the state of the art of these research fields.
Although solar radiation provides the dominant source of energy for snow ablation, turbulent heat transfer also contributes to snow ablation, especially in mid-latitudes,
15
open landscapes and wind-exposed areas (Cline, 1997; Essery et al., 2006; Pohl et al., 2006). Once the snow cover is patchy, thermal internal boundary layers (e.g. Taka-hara and Higuchi, 1985; Marsh and Pomeroy, 1996) develop above the heterogeneous surface. As a result, local advection of warm air from adjacent bare ground to the snow surface provides an additional source of energy contributing to snow ablation (e.g.
20
Shook, 1995; Marsh and Pomeroy, 1996). In contrast, the existence of stable internal boundary layers above snow counteracts the local advection by suppressing turbulent exchange of sensible heat towards the snow surface. However, the interaction between all these driving processes acting on various scales is difficult to analyse and predict. In the Alpine environment in particular, additional factors affect the turbulent transfer
25
of heat over snow, including thermal wind regimes and topographically induced wind velocity patterns (Male and Granger, 1981; Raderschall et al., 2008).
TCD
5, 2159–2196, 2011Micrometeoroloical processes driving
snow ablation
R. Mott et al.
Title Page
Abstract Introduction
Conclusions References
Tables Figures
◭ ◮
◭ ◮
Back Close
Full Screen / Esc
Printer-friendly Version Interactive Discussion
Discussion
P
a
per
|
Dis
cussion
P
a
per
|
Discussion
P
a
per
|
Discussio
n
P
a
per
|
1995), numerical atmospheric boundary-layer models (Liston, 1995; Essery, 1997), concepts of advection efficiency (Marsh and Pomeroy, 1996) or boundary layer integra-tion methods (Granger et al., 2002; Essery et al., 2006). Measurements of either the effect of local advection of heat or the growth of internal boundary-layers above snow patches are extremely rare, except for the studies of Takahara and Higuchi (1985) and
5
Granger et al. (2006). Essery et al. (2006) applied boundary layer principles and esti-mated the additional sensible heat flux to melting snow. Nevertheless, none of these studies demonstrated the direct effect of advective fluxes on the spatial distribution of snow ablation by measurements. Moreover, the approach does not account for the effect of stable internal boundary layers close to the ground.
10
In the research field of spatial variability of snow water equivalent and the driving processes involved extensive research has been carried out in recent years (Male and Granger, 1981; Pomeroy et al., 1998; Bl ¨oschl, 1999; Marks et al., 1999; Lehning et al., 2006; Bewley et al., 2010). Several studies focussed on the relative importance of the energy contributed by solar radiation versus turbulent fluxes (Morris, 1989; Cline, 1997;
15
Pohl and Marsh, 2006). Most of these studies, however, are based on model studies using model resolutions of 100 m or coarser and lack sufficient measurements of the spatial variability of snow ablation.
Turbulent heat fluxes are approximately linearly dependent on the local wind speed. Thus the topographically induced air flow is essential for calculating the spatial
distri-20
bution of the turbulent exchange of sensible heat. Nonetheless, most studies assume constant wind velocities over the model domain. The study of Pohl et al. (2006) ad-dressed the small-scale variability of turbulent fluxes related to topographically induced wind speed variations. Even if the study could demonstrate the importance of the im-pact of wind fields on the variability of turbulent fluxes, only a very simple model was
25
TCD
5, 2159–2196, 2011Micrometeoroloical processes driving
snow ablation
R. Mott et al.
Title Page
Abstract Introduction
Conclusions References
Tables Figures
◭ ◮
◭ ◮
Back Close
Full Screen / Esc
Printer-friendly Version Interactive Discussion
Discussion
P
a
per
|
Dis
cussion
P
a
per
|
Discussion
P
a
per
|
Discussio
n
P
a
per
|
found only a weak correlation of the spatial variability of ablation rates with meteoro-logical and terrain parameters. A different study at the same test site (Egli et al., 2011) demonstrated that in spite of spatially highly variable ablation rates the development of total snow covered area could be predicted by spatially constant melt rates, if the initial snow depth distribution at the beginning of the melt season is known. At the
Wannen-5
grat test-site, the snow depth distribution was proven to be highly affected by the local wind field (Mott et al., 2010) leading to end of winter snow depth distribution with a high inter- and intra-annual consistency (Schirmer et al., 2011).
It is the purpose of this study to combine high-resolution measurements of the spatio-temporal snow ablation patterns at the Wannengrat test site with a fully distributed
10
energy balance model and an atmospheric model. We aim to analyse the complex in-teraction between atmospheric forces and spatio-temporal dynamics of the snow depth distribution driving snow ablation on a very small scale of 5 m. We address three main points concerning the understanding of small-scale snow ablation in an Alpine catch-ment: First, we discuss the different energy terms contributing to the spatial variability
15
of snow ablation including net solar radiation, turbulent flux exchange of sensible and latent heat and the effect of local advection of sensible heat. We investigate the ap-pearance of snow-free patches as controlled by wind-dependent spatial distribution of snow depths at the beginning of the ablation season and by the wind-dependent spatially variable turbulent fluxes. Second, we compare the measured and modelled
20
temporal dynamics of snow ablation. Here, we also focus on the relative importance of radiation-driven ablation versus turbulent heat exchange-driven ablation. These in-vestigations lead us to the final part of the paper, which deals with the existence of stable internal boundary layers and its impact on snow ablation calculations. We dis-cuss measured and modelled turbulent exchange of sensible heat over a melting snow
25
TCD
5, 2159–2196, 2011Micrometeoroloical processes driving
snow ablation
R. Mott et al.
Title Page
Abstract Introduction
Conclusions References
Tables Figures
◭ ◮
◭ ◮
Back Close
Full Screen / Esc
Printer-friendly Version Interactive Discussion
Discussion
P
a
per
|
Dis
cussion
P
a
per
|
Discussion
P
a
per
|
Discussio
n
P
a
per
|
2 Methods
2.1 Study site
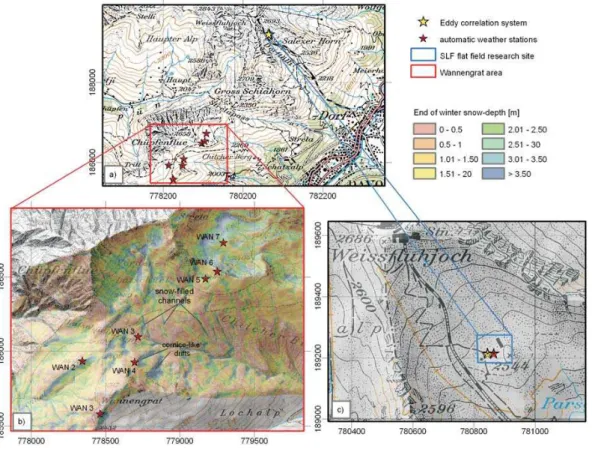
The study was conducted at two mountain sites (Fig. 1), located in the region of Davos (Switzerland). The investigation into the spatial variability of snow ablation was per-formed in an Alpine catchment, located in the Wannengrat area (Fig. 1b), where
sev-5
eral studies on snow depth variability, snowpack stability and snow-hydrology have been completed in recent years (Mott et al., 2010; Gr ¨unewald et al., 2010; Bellaire and Schweizer, 2011; Gr ¨unewald and Lehning, 2011; Groot Zwaaftink et al., 2011; Schirmer et al., 2011; Egli et al., 2011). The elevation ranges from 1940 to 2658 m a.s.l. and is above the local tree line. The Wannengrat area is equipped with seven
10
automatic weather stations.
The second part of study, focussing on turbulent fluxes above melting snow was con-ducted on the SLF flat field research site Versuchsfeld Weissfluhjoch (2540 m) (Fig. 1c) (e.g. Fierz and Lehning, 2001; St ¨ossel et al., 2010) located northeast of the Wannen-grat area. The research site Versuchsfeld exists since 1936 and is equipped with a high
15
number of manual and automatic measurement devices required for snow research.
2.2 Measurements: Wannengrat catchment
2.2.1 Snow depths and ablation rates
During spring 2009, seven Terrestrial Laser Scanning (TLS) campaigns were con-ducted to obtain snow-depth changes covering six ablation periods from 31 March
20
2009 (time of peak accumulation of winter 2008/09) to 9 June 2009. In spring 2011, another two measurement campaigns were carried out, but only for a small isolated snow patch. In this study we analyse five ablation periods in the ablation season 2009 and one ablation period in the ablation season 2011 (Table 1). One airborne laser scan (ALS) was performed on 9 April 2009 (Fig. 1b) to procure the complete coverage of the
TCD
5, 2159–2196, 2011Micrometeoroloical processes driving
snow ablation
R. Mott et al.
Title Page
Abstract Introduction
Conclusions References
Tables Figures
◭ ◮
◭ ◮
Back Close
Full Screen / Esc
Printer-friendly Version Interactive Discussion
Discussion
P
a
per
|
Dis
cussion
P
a
per
|
Discussion
P
a
per
|
Discussio
n
P
a
per
|
end of winter snow-cover (Mott et al., 2010; Gr ¨unewald and Lehning, 2011), which serves as an important input for energy balance modelling (see Sect. 2.5). For a de-tailed description of the measurement set-up and verification of TLS in the Wannengrat area, see Gr ¨unewald et al. (2010). A more general description of TLS measurements on snow can be found in Prokop (2008), Prokop et al. (2008) and Schaffhauser et
5
al. (2008). The accuracy of the ALS and TLS systems was evaluated by comparing the data with each other and with a tachymeter survey, which was performed simul-taneously (Gr ¨unewald et al., 2010). Compared to the tachymeter, they found a mean deviation in z-direction of less than 5 cm for TLS measurements.
In this study, we used measured snow-depth changes, obtained from the TLS to
10
determine mean daily ablation rates. The modelled and measured snow depth change (dHS) and the modelled change in snow water equivalent (dSWE) are always given as a daily mean. In Table 1 measured mean dHS are listed for all periods discussed in this study. The prevailing wind direction, the mean wind velocity ( ¯U) and the modelled snow-coverage (F) at the start of the respective ablation period are also shown in
15
Table 1.
2.2.2 Analysis of the influence of local advection of sensible heat on ablation rates
Measured ablation rates are not only used for model validation, but also to investigate increased ablation rates on the upwind edge of snow patches. We assume these edge
20
effects to be an indicator of the magnitude of the local advection of sensible heat from adjacent bare ground to the snow cover. We therefore simply analyse ablation rates as a function of the distance from the upwind edge of the snow patches. Six periods were subjected to the analysis, four periods of ablation season 2009 (P2, P3, P5, P6) and one single day in ablation season 2011 (P7). For the periods P2-P6 the entire
25
TCD
5, 2159–2196, 2011Micrometeoroloical processes driving
snow ablation
R. Mott et al.
Title Page
Abstract Introduction
Conclusions References
Tables Figures
◭ ◮
◭ ◮
Back Close
Full Screen / Esc
Printer-friendly Version Interactive Discussion
Discussion
P
a
per
|
Dis
cussion
P
a
per
|
Discussion
P
a
per
|
Discussio
n
P
a
per
|
For this reason we measured a small isolated snow patch with the TLS, once in the early morning and once in the evening in spring 2011 (P7). Thus P7 lasts only 9 h assuring that almost no cells melted out during the measurement period.
We chose to analyze only those ablation periods which were characterized by one clear prevailing wind direction. Based on this criterion, Period P4 is excluded from
5
the analysis, since no clear prevailing wind direction was detectable. First, the run-ning average of the mean daily ablation rate for each distance class was calculated for all snow-covered cells. Distance classes were defined by the distance of each snow-covered cell from the upwind edge of the respective snow patch. Snow patch boundaries were obtained from high-resolution orthofotos, also taken simultaneously
10
with the TLS measurements. We applied two different methods to calculate the running averages:
– Method 1: We only analysed the cells which were still snow-covered at the end of the respective ablation period. In this method, cells at the snow patch boundaries are excluded from the analysis even if they showed very high ablation rates. This
15
method was only applied for P7, where the short period led only to a few cells with complete melt.
– Method 2: In order to include the boundary cells, for which the snow disap-peared during the analysis period and which showed significantly high ablation rates in the analysis, i.e. had enough snow at the beginning of the period to
war-20
rant consideration, we introduced an alternative criterion: all cells which were snow-covered at the start of ablation period and which showed daily ablation rates above the area-wide mean daily ablation rate were included to the analysis. The mean area-wide ablation rate was calculated from those cells which were snow-covered at the end of the respective ablation period. Method 2 was applied for
25
P2, P3, P5 and P6, where considerable melt-out effects were observed.
TCD
5, 2159–2196, 2011Micrometeoroloical processes driving
snow ablation
R. Mott et al.
Title Page
Abstract Introduction
Conclusions References
Tables Figures
◭ ◮
◭ ◮
Back Close
Full Screen / Esc
Printer-friendly Version Interactive Discussion
Discussion
P
a
per
|
Dis
cussion
P
a
per
|
Discussion
P
a
per
|
Discussio
n
P
a
per
|
using measurement windows longer than one day, the second method assures that important snow-covered cells with high ablation rates at the snow patch boundaries are subjected to the analysis.
2.3 Measurements: SLF flat field research site Versuchsfeld Weissfluhjoch
2.3.1 Turbulent flux of sensible heat over melting snow
5
Turbulent fluxes of sensible heat were investigated by applying the eddy-covariance method (see Eq. 1) to data from two 3-D ultrasonic anemometers CSAT3 (Campbell Scientific, Inc.,) at approximately 2 and 4 m above the snow surface (St ¨ossel et al., 2010). Measurements were acquired at a frequency of 20 Hz. We analysed data from 1 April 2007 until 25 April 2007, when the snow cover was already melting. Air pressure,
10
relative humidity and air temperature were obtained from state of the art sensors to calculate air properties required for processing the turbulence data (e.g. the specific heat capacity of air and specific humidity). The weather station is also located at the SLF flat field research site, with data available in 30 min intervals.
The sensible heat fluxQsis calculated from the covariance between the perturbation
15
values of the vertical wind velocityw and the virtual potential temperatureθv:
Qs=w′θv′ (1)
As a function of available meteorological data, the turbulence data were averaged to 30 min intervals. Test studies indicate that the dependence of turbulent fluxes on the averaging time (15 min versus 30 min) is very small (not shown).
20
2.4 Numerical models
We compute snow ablation for the Wannengrat catchment by combining a three-dimensional meteorological model with a fully distributed energy balance model, using a horizontal grid resolution of 5 m. The energy balance model is part of the model sys-tem Alpine3d developed to calculate Alpine snow surface processes (Lehning et al.,
TCD
5, 2159–2196, 2011Micrometeoroloical processes driving
snow ablation
R. Mott et al.
Title Page
Abstract Introduction
Conclusions References
Tables Figures
◭ ◮
◭ ◮
Back Close
Full Screen / Esc
Printer-friendly Version Interactive Discussion
Discussion
P
a
per
|
Dis
cussion
P
a
per
|
Discussion
P
a
per
|
Discussio
n
P
a
per
|
2006; Bavay et al., 2009; Mott and Lehning, 2010). Based on the fully distributed ver-sion of the snow-cover module SNOWPACK (Lehning and Fierz, 2008), Alpine3D pro-vides the possibility to calculate snow drift including sublimation (Lehning et al., 2008; Mott and Lehning, 2010; Groot Zwaaftink et al., 2011), the energy balance (Helbig et al., 2009, 2010) and runoff. In this study we applied the user-defined model coupling
5
consisting of the modules SNOWPACK, runoff and the energy balance. The energy balance module supports shading, surface reflections of shortwave radiation and emis-sion of long-wave radiation (Bavay et al., 2009). Turbulent fluxes are calculated using the Monin-Obukhov bulk formulation which is based on local roughness length, wind speed and an estimation of atmospheric stability calculated by the difference between
10
snow surface and air temperature. The sensible heat flux Qs is calculated from the following equation:
Qs=Chρ cpU¯(Ta−Ts) (2)
whereCh is the heat exchange coefficient, ρ the density of air, cp the heat capacity
of air, ¯U mean wind velocity,Tais air temperature andTs is snow surface temperature.
15
The surface layer is defined as a constnat flux layer. Therefore, fluxes at any height are assumed to be equal to the surface flux.
The heat exchange coefficientCh depends on the instrument height z and surface
roughness lengthz0and is calculated after:
Ch= k2
ln(zz
0)
2 (3)
20
Taking into account the snow-covered topography, we used a surface roughness length ofz0 =0.005 m, which is in agreement with typical values for snow (Doorschot et al., 2004; Manes et al., 2008). Note that roughness lengths for momentumz0, heat zH
and moisturezQare approximated to be equal. Considering the snow-covered surface
we used a modified version of the stability correction functions of Stearns and Weidner
25
TCD
5, 2159–2196, 2011Micrometeoroloical processes driving
snow ablation
R. Mott et al.
Title Page
Abstract Introduction
Conclusions References
Tables Figures
◭ ◮
◭ ◮
Back Close
Full Screen / Esc
Printer-friendly Version Interactive Discussion
Discussion
P
a
per
|
Dis
cussion
P
a
per
|
Discussion
P
a
per
|
Discussio
n
P
a
per
|
Michlmayr et al. (2008).ψ is a function of height above the surfacez and of the Monin Obukhov lengthL:
L= −θ¯vu
3
∗
kg(w′θv′)s
(4)
whereθv is the virtual potential temperature, u∗the fiction velocity,k the von Karman
constant and g the gravitational constant. For a detailed description of the stability
5
correction function used in Alpine3D, see Michlmayr et al. (2008).
The model provides the possibility to be run with a correction for atmospheric stability or without stability correction assuming the local atmosphere to be neutrally stratified. Advection of sensible heat is neglected in the current version of Alpine3D.
The calculation of the surface albedo is based on an empirical approach. The albedo
10
function takes into account meteorological factors (air temperature, relative humidity, incoming shortwave radiation, wind velocity), an aging factor and the modelled cur-rent state of the snow surface (density, volumetric content, grain porperties). For a detailed description of the albedo function, see Lehning et al. (2002) and Michlmayr et al. (2008).
15
To account for the spatial variability of turbulent fluxes as a function of local flow conditions, we drive the energy balance module of Alpine3D with high-resolution at-mospheric flow fields, calculated with the non-hydrostatic and atat-mospheric prediction model Advanced Regional Prediction System (ARPS) (Xue et al., 2004). We only use the flow field for the first layer above ground with a horizontal grid resolution of 5 m. Due
20
to a terrain-following grid the vertical resolution varies between 0.5 m at ridges and 1.1 m at flatter terrain. A more detailed description of the model setup of ARPS is given by Mott et al. (2010). The ARPS flow fields were chosen as an hourly input for Alpine3D by using a classification scheme based on frequency distribution of the measured wind velocity and the wind direction at the wind station (WAN3) (Fig. 1) for the specific time
25
TCD
5, 2159–2196, 2011Micrometeoroloical processes driving
snow ablation
R. Mott et al.
Title Page
Abstract Introduction
Conclusions References
Tables Figures
◭ ◮
◭ ◮
Back Close
Full Screen / Esc
Printer-friendly Version Interactive Discussion
Discussion
P
a
per
|
Dis
cussion
P
a
per
|
Discussion
P
a
per
|
Discussio
n
P
a
per
|
variable snow melt processes as well as the melt-out of the seasonal snow cover. We therefore consider the snow-depth distribution at the start of the ablation season by initializing the Alpine3D model with snow depths measured by ALS at the time of peak accumulation, 9 April 2009 (Fig. 1) (Mott et al., 2011).
The mean snow density for the snow-cover initialization was derived from manual
5
measurements. The spatial variability of snow density is small compared to snow depth (e.g., Dickinson and Whiteley, 1972; Pomeroy and Gray, 1995; Jonas et al., 2009). Following these studies, Gr ¨unewald et al. (2010) analysed the spatial distribution of snow density in the Wannengrat catchment as a function of incoming solar radiation and time of season. They found that only the time of season has a significant effect
10
on snow density. We therefore assume the initialized mean snow-density of 310 kg m3 to be spatially homogeneous. Intialized snowpack temperatures were obtained from a near-by permanent weather station and assumed to be spatially homogeneous as well. For the calculation of the spatial variability of daily ablation rates on the Wannengrat study site, three different model setups of Alpine3D were used in order to account for
15
the effect of the spatial variability of wind velocity and the effect of stability correction in the model:
– M1: The energy balance model of Alpine3D is driven by meteorological input from a single weather station located in the study area (WAN 3), except for wind ve-locity. We use wind velocity distribution obtained from mean flow fields calculated
20
with ARPS. The correction for atmospheric stability is enabled.
– M2: The same set-up as for M1, but without correction for atmospheric stability. The local atmosphere is assumed to be neutrally stratified.
– M3: The energy balance model of Alpine3D is driven by meteorological input from a single weather station located in the study area (WAN 3), including wind velocity.
25
The correction for atmospheric stability is enabled.
TCD
5, 2159–2196, 2011Micrometeoroloical processes driving
snow ablation
R. Mott et al.
Title Page
Abstract Introduction
Conclusions References
Tables Figures
◭ ◮
◭ ◮
Back Close
Full Screen / Esc
Printer-friendly Version Interactive Discussion
Discussion
P
a
per
|
Dis
cussion
P
a
per
|
Discussion
P
a
per
|
Discussio
n
P
a
per
|
application of SNOWPACK on the Versuchsfeld study site, we use Dirichlet boundary conditions as long as no melt occurred. The Dirichlet boundary conditions assure that the model is forced to reproduce surface temperature as measured. Once the snow cover is at its melting point, Neumann boundary conditions were used to solve for the energy balance (Bartelt and Lehning, 2002).
5
3 Results and discussion
3.1 Local advection of sensible heat
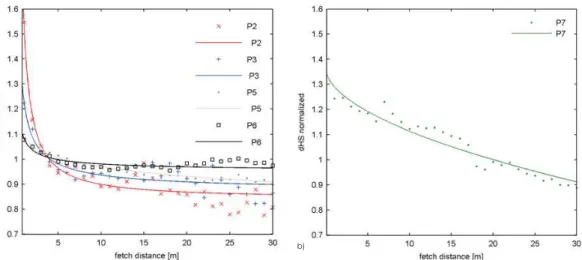
In Fig. 3 the normalized running averages of snow-depth changes (dHS) are shown per distance class of 1 m. All ablation periods subjected to the analyses are characterized by a northwesterly wind direction. Note that we used only pixels that did survive the full
10
period for P7 and all pixels with significant melt for the other periods (see Sect. 2.3). All of the periods showed significantly higher ablation rates at the upwind edges of the snow patches than further downwind. This indicates that the snow patches are highly affected by local advection of sensible heat at their upwind edges. The local significance of this effect is underlined by ablation rates being up to 60 % larger at the
15
upwind edges than average.
We could observe a link between the magnitude of increased ablation at the upwind edge of snow patches and the area-wide snow-coverage (F) (Table 1) as well as the mean wind velocity. The strongest advective effect on the upwind edges, but the short-est distance (about 4 m) until average snow ablation is reached, is evident for the early
20
periods (P2 and P3). For later periods (P5 and P6) the slope of the ablation curve is less steep, but average ablation is observed after a distance of 5 to 6 m.
By contrast, results for P7 suggest that advective processes are active over a longer distance. While at the upwind edge the ablation rates are about 30 % above the mean ablation rate, mean ablation is first observed after a distance of 20 m. One reason for
25
TCD
5, 2159–2196, 2011Micrometeoroloical processes driving
snow ablation
R. Mott et al.
Title Page
Abstract Introduction
Conclusions References
Tables Figures
◭ ◮
◭ ◮
Back Close
Full Screen / Esc
Printer-friendly Version Interactive Discussion
Discussion
P
a
per
|
Dis
cussion
P
a
per
|
Discussion
P
a
per
|
Discussio
n
P
a
per
|
We conclude that the local advection causes strongly increased local ablation rates at the upwind edges of the snow patches, but the effect of local advection seems to be only dominant over rather short distances, except for situations with high mean wind velocities and a small snow-coverage. The later in the season and the lower the snow-coverage, the smaller is the local effect of advection directly at the upwind edge,
5
but the longer are the distances over which advective processes appear to be active. This might be due to a generally higher amount of energy available for snow ablation acting over larger distances, fostered by high wind velocities (P5, P6, P7). A further reason is that the turbulent flow field advects heat not only from just one wind direction, if e.g. a snow patch is completely surrounded by a large area of snow free surface.
10
As the fraction of bare ground increases, the impact of warmer bare ground tends to dominate the micrometeorology of the entire area. Additionally the snow-cover became thin during the latter periods hence an increased number of cells were excluded from the analysis because of early melt-out.
3.2 Spatial variability of daily ablation rates driven by various energy fluxes
15
Five ablation periods were modelled using Alpine3D in order to investigate the spatial variability of daily ablation rates (Table 1) and to analyse the spatial distribution of snow ablation as a function of the spatially variable energy fluxes. For all simulations dis-cussed in this section, the energy balance was driven by high-resolution atmospheric flow fields obtained from ARPS and the corrections for atmospheric stability were
en-20
abled (M1).
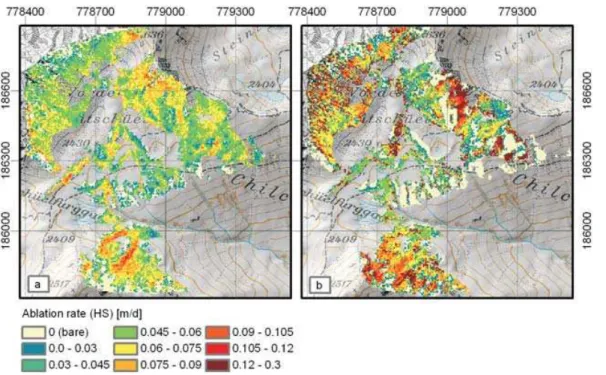
In Fig. 4 the spatial distribution of modelled dSWE are shown for ablation periods P2 (Fig. 4a), P3 (Fig. 4b), P4 (Fig. 4c), P5 (Fig. 4d) and P6 (Fig. 4e). The modelled results indicate a high spatial variability of dSWE for all modelled periods. Highest ablation rates are observed at lower altitudes, the sun-exposed slopes of the Chilcherberg and
25
TCD
5, 2159–2196, 2011Micrometeoroloical processes driving
snow ablation
R. Mott et al.
Title Page
Abstract Introduction
Conclusions References
Tables Figures
◭ ◮
◭ ◮
Back Close
Full Screen / Esc
Printer-friendly Version Interactive Discussion
Discussion
P
a
per
|
Dis
cussion
P
a
per
|
Discussion
P
a
per
|
Discussio
n
P
a
per
|
The modelled contributions of the different energy terms to snow ablation are illus-trated in Fig. 5 for the ablation period P3. In the Wannengrat area, most of the snow ablation is controlled by net radiation fluxes (Fig. 5a), except for some wind-exposed areas provoking turbulent fluxes (Fig. 5b). Considerable contribution of net turbulent fluxes to snow ablation is primarily revealed at the Latschuelfurgga, the steep NE and
5
NW slopes of the Wannengrat summit and local areas at ridges and bumps (Fig. 5). These areas correspond well to areas of early melt-out and increased ablation rates (Fig. 4). Within these exposed areas, the net turbulent exchange of sensible and latent heat contributes 30 to 50 % of the melt energy. The latent heat flux is, however, quite small. Thus sensible heat flux is the prime energy source for snow ablation due to
tur-10
bulent exchange (not shown). As expected, model simulations driven by atmospheric flow fields indicate that the wind velocity distribution has a considerable local effect on the magnitude of the mean daily ablation rates, as turbulent fluxes are a linear function of wind velocity.
Furthermore, as already suggested by Gr ¨unewald et al. (2010) and Anderton et al.
15
(2004), the snow depth distribution at the end of the accumulation period (Fig. 1), ap-pears to have a strong influence on the timing of melt-out. Snow-free patterns emerge first at ridges, bumps and wind-exposed slopes (Gr ¨unewald et al., 2010), provoked by enhanced wind velocities and thus reduced deposition and erosion of snow during the accumulation period (Mott et al., 2010). Snow patches tend to survive in channels and
20
wind-sheltered slopes, characterized by low wind velocities and thus strong snow ac-cumulation during winter (Fig. 4). Later in the ablation season, the survival of snow patches in accumulation areas is often further fostered by smaller wind velocities sup-pressing turbulent fluxes and thus diminishing snow ablation. Such a negative feedback is visible in the bowl located at the foot of Vorder Latschuel (Bowl), where small wind
25
TCD
5, 2159–2196, 2011Micrometeoroloical processes driving
snow ablation
R. Mott et al.
Title Page
Abstract Introduction
Conclusions References
Tables Figures
◭ ◮
◭ ◮
Back Close
Full Screen / Esc
Printer-friendly Version Interactive Discussion
Discussion
P
a
per
|
Dis
cussion
P
a
per
|
Discussion
P
a
per
|
Discussio
n
P
a
per
|
The strongest influence of wind velocity on snow ablation and melt-out is visible at the Latschuelfurgga. This wind-exposed anticline features areas of high accumulation close to areas of thin snow cover, which promote the development of patchy snow cov-ers early in the ablation season. Once the snow cover is patchy, this area is more prone to melt-out due to the effect of local advection of sensible heat from adjacent
5
bare ground to the snow surface, providing an additional source of energy contributing to snow melt. As explained above, this process has been neglected in the model sim-ulations. Simulations driven by hourly wind velocities obtained from a single weather station (not shown) result in significantly lower ablation rates and a temporal shift of melt-out, especially at the Latschuelfurgga and the NE/NW slopes of the Wannengrat
10
summit.
Comparing modelled ablation rates (as dHS) to measured ablation rates (as dHS) (Fig. 6) we also observe an enhanced decrease of snow depths for the NE slope of the Wannengrat summit and the SW slopes in the TLS measurements. Modelled and measured changes of snow depths indicate a strong ablation at two cornice-like drifts
15
at the NE slope of the Wannengrat summit (Fig. 6). Model results suggest, however, that the snow-depth changes at the cornice-like drifts are driven by settling processes only affecting absolute snow depth changes and do not directly contribute to snow ablation as SWE (Fig. 4). Although the model is able to capture most spatial patterns of snow ablation, a considerable difference in spatial variability between modelled and
20
measured ablation rates is observed in the bowl-shaped Vorder Latschuel (bowl). The model strongly underestimates melt energy in the bowl, which we attribute to two main processes neglected in the model runs. First, the modelled NW wind fields show very small wind velocities within these slopes (Mott et al., 2010) involving strong suppression of turbulent fluxes (Fig. 5). Local thermal winds, which are reinforced once
snow-25
TCD
5, 2159–2196, 2011Micrometeoroloical processes driving
snow ablation
R. Mott et al.
Title Page
Abstract Introduction
Conclusions References
Tables Figures
◭ ◮
◭ ◮
Back Close
Full Screen / Esc
Printer-friendly Version Interactive Discussion
Discussion
P
a
per
|
Dis
cussion
P
a
per
|
Discussion
P
a
per
|
Discussio
n
P
a
per
|
by rocky and rough terrain which might be a considerable factor for increased energy supply to the snow cover.
We summarize that modelled results demonstrate that the patterns of early melt-out and the spatial variability of the snow ablation rates are not only driven by altitude and exposition but also by the small-scale spatial variability of wind velocities. Beside the
5
local energy balance as a controlling factor, melt-out appears to also be controlled by the interaction of two main processes: The effect of snow depth distribution at the end of the accumulation season drives the appearance of snow-free patches and therefore the onset of local advection processes while the low wind velocities over the remaining snow patches suppress turbulent fluxes and ablation rates.
10
3.3 Temporal development of ablation rates and energy fluxes in the course of the ablation season
In Fig. 7 the temporal development of measured and modelled mean daily ablation rates (as dHS) is shown for the ablation season 2009. Modelled results for M1, M2 and M3 were analysed for the area covered by TLS measurements which was still
15
snow-covered at the end of the respective ablation period. Measurements show high-est ablation rates for P3, with a daily decrease in snow depth of about 6 cm. Even if model setup M1 (flow field and stability correction enabled) shows the best results, this mode is only able to capture mean daily ablation rates for the early ablation periods P2 and P3, but overestimates the ablation periods late in ablation season (P4, P5, P6). In
20
contrast, M3 (no atmospehric wind field, stability correction enabled) strongly underes-timates early periods and overesunderes-timates periods late in the season. Modelled results of M2 show that assuming a neutral atmospheric layer causes a strong overestimation of turbulent fluxes leading to unrealistically high snow ablation. We summarize, that the model M1, which accounts for stability effects and for the spatial variability of wind
25
TCD
5, 2159–2196, 2011Micrometeoroloical processes driving
snow ablation
R. Mott et al.
Title Page
Abstract Introduction
Conclusions References
Tables Figures
◭ ◮
◭ ◮
Back Close
Full Screen / Esc
Printer-friendly Version Interactive Discussion
Discussion
P
a
per
|
Dis
cussion
P
a
per
|
Discussion
P
a
per
|
Discussio
n
P
a
per
|
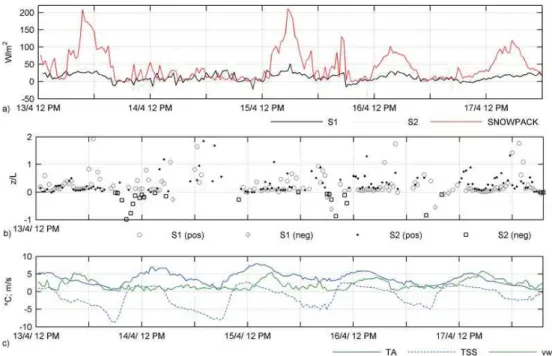
Mean daytime energy fluxes averaged for the five ablation periods are shown in Fig. 8 (M1) for snow-covered cells. Note that, all energy fluxes are defined positive if directed towards the snowpack. It is evident that net radiation clearly dominates the total amount of melt energy (Qm) early in the ablation season, while for the later ablation periods the sensible heat flux becomes also important. Especially for P5 the sensible heat flux (Qs)
5
contributes 35 % to the net melt energy, mainly driven by a high mean air temperature (Fig. 2) accompanied by an above-average mean wind velocity (Table 1). For this period net melt energy (Qm) averages 260 W m−2during daytime. Measured ablation
rates (as dHS) (Fig. 7) show, however, that melt energy must have been highest for P3, which only averages about 160 W m−2 for simulation results (Fig. 8). Snow depth
10
change during early periods P2 and P3 might also be due to the settling process. In previous studies, radiation-driven melt has been identified to be dominant early in the season while turbulent heat exchange-driven melt could be shown to gain im-portance late in the season (e.g. Shook et al., 1993). In this study, however, we do not directly account for the local advection of sensible heat from bare ground to snow
15
covered areas, but we indirectly account for the effect of heating of bare ground. The heating of bare ground is provoked by a significantly lower albedo for bare ground than for snow-covered areas.
Based on the huge net melt energy produced in P5 (Fig. 8) and the related high abla-tion rates (Fig. 7), we observe that we strongly overestimate the effect of the turbulent
20
exchange of sensible heat transported towards the snow surface late in the season. The overestimation of heat flux is believed to be caused by initializing the energy bal-ance model with the measured air temperatures at 3 m above ground, which might overestimate the local air temperature above the snow surface. Based on the constant flux layer assumption we then simply integrate between the surface temperature values
25
TCD
5, 2159–2196, 2011Micrometeoroloical processes driving
snow ablation
R. Mott et al.
Title Page
Abstract Introduction
Conclusions References
Tables Figures
◭ ◮
◭ ◮
Back Close
Full Screen / Esc
Printer-friendly Version Interactive Discussion
Discussion
P
a
per
|
Dis
cussion
P
a
per
|
Discussion
P
a
per
|
Discussio
n
P
a
per
|
3.4 Turbulent exchange of sensible heat above a melting snow surface
In the previous subsection we demonstrated that modelled snow ablation is overesti-mated as soon as snow-coverage is below a critical value. We hypothesized that the overestimation of snow ablation is evoked by overestimating the sensible heat flux to-wards the snow surface. The aim of this subsection is to support this hypothesis by
5
investigating the measured turbulent exchange of sensible heat above a melting snow surface using the eddy-covariance method (see Eq. 1) and by comparing it to modelled turbulent heat fluxes using a Monin Obukhov bulk formulation (see Eqs. 2–4).
In Figs. 9a and 10a the turbulent exchange of sensible heat measured at two different instrument heights of approximately 2 and 4 m above the snow surface is compared to
10
modelled fluxes at the snow surface for two measurement periods in spring 2007. For details on the measurement set-up and a validation of latent heat fluxes in February see also St ¨ossel et al. (2010). Note that the common constant flux layer assumption allows us to compare vertical turbulent fluxes at different heights. The stability parameter z/L, calculated from turbulence statistics (see Eq. 4) is shown in Figs. 9b and 10b.
15
Measured air temperature, snow surface temperature and wind velocity obtained from a near-by weather station are illustrated in Figs. 9c and 10c.
For most days, the turbulent flux of sensible heat follows a clear diurnal variation (Figs. 9a, 10a). We observe positive sensible heat fluxes mostly starting shortly after noon and lasting until the evening. During the night, calm wind conditions suppress the
20
turbulent exchange of sensible heat. Peak fluxes of sensible heat towards the melting snow surface are periodically observed some hours after the daily peak of air tem-perature in the afternoon. At this time, the snow surface has already been cooled by longwave radiation, resulting in a strong temperature gradient between air and snow surface. Hours of peak sensible heat fluxes towards the snow surface additionally
co-25
TCD
5, 2159–2196, 2011Micrometeoroloical processes driving
snow ablation
R. Mott et al.
Title Page
Abstract Introduction
Conclusions References
Tables Figures
◭ ◮
◭ ◮
Back Close
Full Screen / Esc
Printer-friendly Version Interactive Discussion
Discussion
P
a
per
|
Dis
cussion
P
a
per
|
Discussion
P
a
per
|
Discussio
n
P
a
per
|
daily maximum of the positive turbulent heat fluxes appears to be driven by a diurnal local thermal wind system prevailing in the afternoon. This thermal wind system is observed for all days shown in Figs. 9c and 10c, except for 14 April. Although the air temperature is high at 14 April (Fig. 9a only weak sensible heat fluxes towards the snow surface are observed due to very low wind velocities (Fig. 9c).
5
During the afternoon, z/L indicates strongly stable conditions for both sensors. The lower sensor, however, reveals stronger statically stable conditions near the ground than the senor above (Fig. 9a, Fig. 10a).
We finally compare the measured turbulent fluxes at two instrument heights with the sensible heat flux modelled at the snow surface. The comparison between modelled
10
and measured turbulent fluxes indicate significant differences in the amount of the tur-bulent heat flux directed towards the snow surface, especially for peak flux situations. The model strongly overestimates the positive sensible heat flux at the snow surface. In the model, the heat flux is driven by strong temperature gradients between the melting snow surface and the air at 3.5 m above ground. High wind velocities usually observed
15
in the afternoon further enhance the modelled positive heat flux.
Over a continuous winter snow cover the correction for stability is known to create an shut down of turbulent fluxes, where very often a strong temperature gradient be-tween the cold surface and the warmer air causes modelled turbulent fluxes strongly underestimating measured fluxes (St ¨ossel et al., 2010). In spring, the existence of a
20
patchy snow cover appears to change this model behaviour. In face of high air tem-perature and high wind velocities the amount of measured negative turbulent heat flux is small compared to the modelled flux. In the context of increased static stability (z/L) and relatively small observed turbulent heat fluxes towards the ground, the measure-ments indicate the existence of a stable internal boundary layer (SIBL) close to the
25
TCD
5, 2159–2196, 2011Micrometeoroloical processes driving
snow ablation
R. Mott et al.
Title Page
Abstract Introduction
Conclusions References
Tables Figures
◭ ◮
◭ ◮
Back Close
Full Screen / Esc
Printer-friendly Version Interactive Discussion
Discussion
P
a
per
|
Dis
cussion
P
a
per
|
Discussion
P
a
per
|
Discussio
n
P
a
per
|
overestimate the sensible heat flux transported towards a melting snow surface. Al-though measured turbulence data suggest a SIBL near the ground, more turbulence measurements close to the ground are required to provide a clear evidence of the de-velopment of a SIBL above melting snow, the height of such internal boundary layers and the net amount of sensible heat flux gained at the snow surface. The constant
5
flux layer assumption, however, appears to be inaccurate for simulating turbulent fluxes above melting and patchy snow surfaces in complex terrain.
4 Conclusions
We have explored the main micrometeorological processes driving the spatio-temporal snow ablation dynamics in a small alpine catchment. Based on model results and high
10
resolution measurements we were able to identify ablation patterns controlled by net radiation and net turbulent exchange of sensible and latent heat. Results further con-firm earlier results on (Gr ¨unewald et al., 2010; Egli et al., 2011) the significant impact of end-of winter snow depth distribution on the patchiness of the melting snow cover. The small-scale information of the snow depth distribution at the end of winter was therefore
15
shown to be essential to accurately model snow ablation dynamics in complex terrain. Furthermore the investigation emphasized the importance of the spatial distribution of wind velocity as a driving factor for the local energy balance and for the snow depth distribution. The effect of the local wind field on the magnitude of turbulent heat fluxes at wind-exposed or wind-sheltered areas pointed to a necessity to drive the energy
20
balance model with meteorological wind fields.
On the very small scale (m), the local advection of sensible heat from adjacent bare ground to snow covered areas was observed to cause strongly increased ablation rates at the upwind edges of snow patches. While for conditions with moderate wind veloci-ties, the significant advection effect appeared to be active over a rather short distance
25
TCD
5, 2159–2196, 2011Micrometeoroloical processes driving
snow ablation
R. Mott et al.
Title Page
Abstract Introduction
Conclusions References
Tables Figures
◭ ◮
◭ ◮
Back Close
Full Screen / Esc
Printer-friendly Version Interactive Discussion
Discussion
P
a
per
|
Dis
cussion
P
a
per
|
Discussion
P
a
per
|
Discussio
n
P
a
per
|
very high horizontal resolution is required. Neglecting the local advection of sensible heat, model results demonstrate that snow ablation is mainly controlled by net radiation fluxes. In some wind-exposed areas, however, net turbulent exchange of sensible and latent heat contributes up to 50 % to the net melt energy. More important is the effect of a SIBL over snow patches. Based on the constant flux layer assumption, energy
5
balance models tend to overestimate snow ablation later in the ablation season due to the fact that most energy balance models do not consider the existence of stable in-ternal boundary layers. The development of a SIBL close to the snow-covered ground significantly alter the local energy balance above melting snow by suppressing turbu-lence, hence reducing snow ablation. Measured turbulent fluxes above a melting snow
10
cover support this hypothesis by giving evidence of relatively small turbulent fluxes of sensible heat compared to modelled results.
For a more quantitative investigation of the effect of existing SIBLs on snow ablation a more detailed analysis of turbulent flux profiles above melting snow patches coupled to high-resolution snow ablation measurements is required. Furthermore, considering
15
the locally strong effect of the advection of sensible heat, a consequent further step would be the implementation of advection processes in very high-resolution energy balance models on a scale below 5 m, by following e.g. the idea of a boundary layer integration method provided by Essery et al. (2006). This approach, however, needs to be augmented by the counteractive effect of SIBL development close to the melting
20
snow surface. One alternative straightforward approach to investigate boundary layer dynamics above a patchy melting snow cover would be to use a numerical atmospheric boundary-layer model. Using existing snow-coverage data measured by TLS and ALS may allow us to model the daily development of stable and instable internal boundary layers as well as their interaction above the heterogeneous surface. This would,
how-25
TCD
5, 2159–2196, 2011Micrometeoroloical processes driving
snow ablation
R. Mott et al.
Title Page
Abstract Introduction
Conclusions References
Tables Figures
◭ ◮
◭ ◮
Back Close
Full Screen / Esc
Printer-friendly Version Interactive Discussion
Discussion
P
a
per
|
Dis
cussion
P
a
per
|
Discussion
P
a
per
|
Discussio
n
P
a
per
|
Acknowledgements. The wind simulations were made using the Advanced Regional Prediction
System (ARPS) developed by the Center for Analysis and Prediction of Storms (CAPS), Uni-versity of Oklahoma. Part of the work was funded by the Swiss National Science Foundation and the European Community (FP7 project HYDROSYS). We are grateful to our colleagues who helped during the field campaigns, especially Franziska Stoessel.
5
References
Anderton, S. P., White, S. M., and Alvera, B.: Evaluation of spatial variability in
snow water equivalent for a high mountain catchment, Hydrol. Process., 18, 435–453, doi:10.1002/hyp.1319, 2004. 2161, 2173
Bartelt, P. and Lehning, M.: A physical SNOWPACK model for Avalanche Warning Services.
10
Part I: numerical model, Cold Reg. Sci. Technol., 35, 123–145, 2002. 2171
Bavay, M., Lehning, M., Jonas, T., and L ¨owe, H.: Simulation of future snow cover and discharge in Alpine headwater catchments, Hydrol. Process., 23, 95–108, 2009. 2168
Bellaire, S. and Schweizer, J.: Measuring spatial variations of weak layer and slab prop-erties with regard to snow slope stability, Cold. Reg. Sci. Technol., 65(2), 234–241,
15
doi:10.1016/j.coldregions.2010.08.013, 2011. 2164
Bewley, D., Essery, R., Pomeroy, J., and M ´enard, C.: Measurements and modelling of snowmelt and turbulent heat fluxes over shrub tundra, Hydrol. Earth Syst. Sci., 14, 1331–1340, doi:10.5194/hess-14-1331-2010, 2010. 2162
Bl ¨oschl, G.: Scaling issues in snow hydrology, Hydrol. Process., 13, 2149–2175, 1999. 2162
20
Clifton, A. and Lehning, M.: Improvement and validation of a snow saltation model using wind tunnel measurements, Earth Surf. Proc. Land., 33, 2156–2173, 2008.
Cline, D. W.: Snow surface energy exchanges and snowmelt at a continental, midlatitude Alpine site, Water Resour. Res., 33(4), 689–701, doi:10.1029/97WR00026, 1997. 2161, 2162
Dadic, R., Mott, R., Lehning, M., and Burlando, P.: Wind Influence on Snow
25
Depth Distribution and Accumulation over Glaciers, J. Geophys. Res., 115, F01012, doi:10.1029/2009JF001261, 2010. 2161
Dickinson, W. T. and Whiteley, H. R.: A sampling scheme for shallow snow packs, Bulletin of the International Association of Hydrological Sciences, 16, 247–258, 1972. 2170
Egli, L., Jonas, T., Gr ¨unewald, T., Schirmer, M., and Burlando, P.: Dynamics of snow ablation
TCD
5, 2159–2196, 2011Micrometeoroloical processes driving
snow ablation
R. Mott et al.
Title Page
Abstract Introduction
Conclusions References
Tables Figures
◭ ◮
◭ ◮
Back Close
Full Screen / Esc
Printer-friendly Version Interactive Discussion
Discussion
P
a
per
|
Dis
cussion
P
a
per
|
Discussion
P
a
per
|
Discussio
n
P
a
per
|
in a small Alpine catchment observed by repeated terrestrial laser scans, Hydrol. Process., doi:10.1002/hyp.824, accepted, 2011. 2161, 2163, 2164, 2169, 2179
Essery, R.: Modelling fluxes of momentum, sensible heat and latent heat over heterogeneous snowcover, Q. J. Roy Meteor. Soc., 123, 1867–1883, 1997. 2162
Essery, R., Granger, R., and Pomeroy, J. W.: Boundary-layer growth and advection of heat over
5
snow and soil patches: modelling and parameterization, Hydrol. Process., 20, 953–967, 2006. 2161, 2162, 2180
Fierz, C. and Lehning, M.: Assessment of the microstructure-based snow-cover model SNOW-PACK: thermal and mechanical properties, Cold Reg. Sci. Technol., 33, 123–131, 2001. 2164
10
Granger, R. J., Pomeroy, J. W., and Parvianen, J.: Boundary layer integration approach to advection of sensible heat to a patchy snowcover, Hydrol. Process., 16, 3559–3569, 2002. 2162
Granger, R. J., Pomeroy, J. W., and Essery, R.: Boundary-layer growth and advection of heat over snow and soil patches: field observations, Hydrol. Process., 20, 953–967, 2006. 2162
15
Groot Zwaaftink, C. D., L ¨owe, H., Mott, R., Bavay, M., and Lehning, M..: Drifting snow subli-mation: A high-resolution 3-D model with temperature and moisture feedbacks, J. Geophys. Res., doi:10.1029/2011JD015754, in press, 2011. 2164, 2168
Gr ¨unewald, T., Schirmer, M., Mott, R., and Lehning, M.: Spatial and temporal variability of snow depth and SWE in a small mountain catchment, The Cryosphere Discuss., 4, 1–30,
20
doi:10.5194/tcd-4-1-2010, 2010. 2161, 2162, 2164, 2165, 2169, 2170, 2173, 2179
Gr ¨unewald, T. and Lehning, M.: Altitudinal dependency of snow amounts in two small alpine catchments: can catchment-wide snow amounts be estimated via single snow or precipita-tion staprecipita-tions?, Ann. Glaiol., 52(58), 153–158, 2011. 2164, 2165
Helbig, N., L ¨owe, H., and Lehning, M.: Radiosity approach for the shortwave surface radiation
25
balance in complex terrain, J. Atmos. Sci., 66, 2900–2912, 2009. 2168, 2174
Helbig, N., Lehning, M., L ¨owe, H., and Mayer, B.: Explicit validation of a shortwave radiation model over snow covered complex terrain, J. Geophys. Res., 115, D18113, doi:10.1029/2010JD013970, 2010. 2168
Jonas, T., Marty, C., and Magnusson, J.: Estimating the snow water equivalent from snow depth
30
measurements in the Swiss Alps, J. Hydrol., 378, 161–167, 2009. 2170
TCD
5, 2159–2196, 2011Micrometeoroloical processes driving
snow ablation
R. Mott et al.
Title Page
Abstract Introduction
Conclusions References
Tables Figures
◭ ◮
◭ ◮
Back Close
Full Screen / Esc
Printer-friendly Version Interactive Discussion
Discussion
P
a
per
|
Dis
cussion
P
a
per
|
Discussion
P
a
per
|
Discussio
n
P
a
per
|
Reg. Sci. Technol., 35 (3), 169–184, doi:10.1016/S0165-232X(02)00072-1, 2002. 2169 Lehning, M., V ¨olksch, I., Gustafsson, D., Nguyen, T. A., St ¨ahli, M., and Zappa, M.: A detailed
model of mountain surface processes and its application to snow hydrology, Hydrol. Process., 20, 2111–2128, 2006. 2162, 2167
Lehning, M., L ¨owe, H., Ryser, M., and Raderschall, N.: Inhomogeneous precipitation
5
distribution and snow transport in steep terrain, Water Resour. Res., 44, W09425, doi:10.1029/2007WR006544, 2008. 2161, 2168
Lehning, M. and Fierz, C.: Assessment of snow transport in avalanche terrain, Cold Reg. Sci. Technol., 51, 240–252, doi:10.1016/j.coldregions.2007.05.012, 2008.
Liston, G. E.: Local Advection of Momentum, Heat and Moisture during the Melt of Patchy
10
Snow Covers, J. Appl. Meteorol., 34, 1705–1715, 1995. 2162
Liston, G. E. and Sturm, M.: Winter precipitation patternsin arctic Alaska determined from a blowing-snow model and snow-depth observations, J. Hydromet., 3, 646–659. 2002. 2161 Liston, G. E., Haehnel, R. B., Sturm, M., Hiemstra, C. A., Berezovskaya, S., and Tabler, R.
D.: Instruments and methods simulating complex snow distributions in windy environments
15
using SnowTran-3D, J. Glaciol., 53(181), 241–256, 2007. 2161
Luce, C. H., Tarboton, D. G., and Cooley K. R.: The influence of the spatial distribution of snow on basin-averaged snowmelt, Hydrol. Process., 12(10–11), 1671–1683, 1998. 2161
Male, D. H. and Granger, R. J.: Snow surface energy exchange, Water Resour. Res., 17(3), 609–627, doi:10.1029/WR017i003p00609, 1981. 2161, 2162
20
Manes, C., Guala, M., L ¨owe, H., Bartlett, S., Egli, L., and Lehning, M.: Statistical properties of fresh snow roughness, Water Resour. Res., 44, W11407, doi:10.1029/2007WR006689, 2008.
Marks, D., Domingo, J., Susong., D., Link, T., and Garen, D.: A spatially distributed energy balance snowmelt model for application in mountain basins, Hydrol. Process., 13, 1935–
25
1959, 1999. 2162
Marsh, P. and Pomeroy, J. W..: Meltwater fluxes at an arctic forest-tundra site, Hydrol. Process., 10, 1383–1400, 1996. 2161, 2162
Morris, E. M.: Turbulent fluxes over snow and ice, J. Hydrol., 105, 205-233, 1989. 2162 Michlmayr, G., Lehning, M., Kobolotschnig, G., Holzmann, H., Zappa, M., Mott, R., and
30
Sch ¨oner, W.: Application of the Alpine 3D model for glacier mass balance and glacier runoff studies at Goldbergkees, Austria, Hydrol. Process., 22, 3941–3949, 2008. 2169
TCD
5, 2159–2196, 2011Micrometeoroloical processes driving
snow ablation
R. Mott et al.
Title Page
Abstract Introduction
Conclusions References
Tables Figures
◭ ◮
◭ ◮
Back Close
Full Screen / Esc
Printer-friendly Version Interactive Discussion
Discussion
P
a
per
|
Dis
cussion
P
a
per
|
Discussion
P
a
per
|
Discussio
n
P
a
per
|
and Snow Deposition for Mountains, J. Hydrometeorol., doi:10.1175/2010JHM1216.1, 2010. 2161, 2168
Mott, R., Schirmer, M., Bavay, M., Grnewald, T., and Lehning, M.: Understanding snow-transport processes shaping the mountain snow-cover, The Cryosphere, 4, 545–559, doi:10.5194/tc-4-545-2010, 2010. 2163, 2164, 2165, 2169, 2173, 2174
5
Mott, R., Schirmer, M., and Lehning, M.: Scaling properties of wind and snow depth distribution in an Alpine catchment, J. Geophys. Res., 116, D06106, doi:10.1029/2010JD014886, 2011. 2170
Pohl, S., Marsh, P., and Liston, G. E.: Spatial-Temporal Variability in Turbulent Fluxes during Spring Snowmelt, Arct. Antarct. Alp. Res., 38(1), 136–146, 2006. 2161, 2162
10
Pohl, S. and Marsh, P.: Modelling the spatialtemporal variability of spring snowmelt in an arctic catchment, Hydrol. Process., 20, 1773–1792, doi:10.1002/hyp.5955, 2006. 2162
Pomeroy, J. W., Gray, D. M., Shook, K. R., Toth, B. ,Essery, R. L. H., Pietroniro, A., and Hed-strom, N.: An evaluation of snow accumulation and ablation processes for land surface mod-elling, Hydrol. Process., 12, 2339–2367, 1998. 2161, 2162
15
Pomeroy, J. W. and Gray, D. M.: Snowcover: Accumulation, Redistribution and Management, National Hydrology Research Institute Science Report No. 7., Saskatoon, Saskatchewan, Canada, 144 p., 1995. 2170
Prokop, A.: Assessing the applicability of terrestrial laser scanning for spatial snow depth mea-surements, Cold Reg. Sci. Technol., 54(3), 155–163, 2008. 2165
20
Prokop, A., Schirmer, M., Rub, M., Lehning, M., and Stocker, M.: A comparison of measure-ment methods: Terrestrial laser scanning, tachymetry and snow probing, for the determina-tion of spatial snow depth distribudetermina-tion on slopes, Ann. Glaciol., 49, 210–216, 2008. 2165 Raderschall, N., Lehning, M., and Sch ¨ar, M.: Fine-scale modeling of the boundary l ayer wind
field over steep topography, Water Resour. Res., 44, W09425, doi:10.1029/2007WR006544,
25
2008. 2161
Stull, R.,: Boundary Layer Meteorology. Kluwer Academic, 666 pp, 1988. 2178
Schaffhauser, A., Adams, M., Fromm, R., J ¨org, P., Luzi, G., Noferini, L., and Sailer, R.: Remote sensing based retrieval of snow-cover properties, Cold Reg. Sci. Technol., 54(3), 164–175, 2008. 2165
30
Schirmer, M., Wirz, V., Clifton, A., and Lehning.: Persistence in Intra-annual Snow
TCD
5, 2159–2196, 2011Micrometeoroloical processes driving
snow ablation
R. Mott et al.
Title Page
Abstract Introduction
Conclusions References
Tables Figures
◭ ◮
◭ ◮
Back Close
Full Screen / Esc
Printer-friendly Version Interactive Discussion
Discussion
P
a
per
|
Dis
cussion
P
a
per
|
Discussion
P
a
per
|
Discussio
n
P
a
per
|
Shook, K., Gray, D. M., Pomeroy, J. W.: Temporal variation in snowcover area during melt in praerie and alpine environments, Nord. Hydrol., 24, 183–198, 1993. 2161, 2176
Shook, K.: Simulation of ablation of prairie snowcovers, Ph.D thesis, University of
Saskatchewan, 189 pp., 1995. 2161
Stearns, C. and Weidner, G.: Sensible and latent heat estimates in antarctica, Antar. Res. S.,
5
61, 109–138, 1994. 2168
St ¨ossel, F., Manes, C., Guala, M., Fierz, C., and Lehning, M.: Micrometeorological and mor-phological observations of surface hoar dynamics on a mountain snow-cover, Water Resour. Res., doi:10.1029/2009WR008198, 2010. 2164, 2167, 2177, 2178
Takahara, H. and Higuchi, K.: Thermal modification of air moving over melting snow surfaces,
10
Ann. Glaciol., 6, 235–237, 1985. 2161, 2162
TCD
5, 2159–2196, 2011Micrometeoroloical processes driving
snow ablation
R. Mott et al.
Title Page
Abstract Introduction
Conclusions References
Tables Figures
◭ ◮
◭ ◮
Back Close
Full Screen / Esc
Printer-friendly Version Interactive Discussion
Discussion
P
a
per
|
Dis
cussion
P
a
per
|
Discussion
P
a
per
|
Discussio
n
P
a
per
|
Table 1.Measured ablation periods (P) for the ablation season 2009 and ablation season 2011 used for the current analysis with start and end date (time), prevailing wind direction (dir) (◦)
measured at wind station (WAN3), mean wind velocity ( ¯U) [m s−1] and height of wind velocity
measurements (h) [m] for respective period, modelled snow-coverage at the start of the period (F) and measured mean daily change in snow depth (dHS) [m d−1].
P Time dir U¯ h F dHS Advection Ablation
Analysis Simulations
P2 01/5–12/5/09 NW 3.0 2.8 0.96 0.03 Yes Yes
P3 12/5–15/5/09 NW 2.7 3.1 0.75 0.06 Yes Yes
P4 15/5–20/5/09 NW/SE 2.6 3.2 0.62 0.04 Yes Yes
P5 20/5–25/5/09 NW 3.6 3.5 0.47 0.04 Yes Yes
P6 25/5–02/6/09 NW 3.5 3.9 0.33 0.02 Yes Yes