Received May 6, 2010 and accepted February 15, 2011. Corresponding author: [email protected]
Biomass components in Massai grass during establishment and regrowth
under five nitrogen fertilization levels
1Marcos Neves Lopes2, Magno José Duarte Cândido2*, Roberto Cláudio Fernandes Franco Pompeu3, Rodrigo Gregório da Silva4, José Wellington Batista Lopes2, Francisco Marcus
Lima Bezerra2
1Pesquisa financiada pelo MEC/SESu. 2Universidade Federal do Ceará - UFC.
3Empresa Brasileira de Pesquisa Agropecuária, Centro Nacional de Pesquisa Caprinos e Ovinos. 4Instituto Federal de Educação, Ciência e Tecnologia – IFCE, Campus Avançado do Tauá. *Pesquisador do CNPq e Tutor do PET Zootecnia/UFC.
ABSTRACT - To evaluate biomass components of Massai grass under five doses of N (0, 150, 300, 450 and 600 mg N/dm3 soil) during three cycles of growth (establishment, regrowth 1 and regrowth 2) this study was carried out.
The experiment was carried out in a greenhouse, in a completely randomized design with measures repeted over time and five replications. In the three cycles, nitrogen doses had increasing linear effect on green herbage dry matter (GHDM), green leaf dry matter (GLDM), on the tiller population density (TPD) and on forage density. Canopy height and foliage height were the highest ones in establishment of regrowth 2, respectively, and they decreased at the highest doses of nitrogen. Irrigation depth was the greatest at the highest doses and in regrowth 1. Water use efficiency responded positively to the doses, being the regrowth 2 the highest values were obtained at the highest doses of nitrogen. Nitrogen use efficiency by Massai grass is influenced by fertilizantion as well as by the cycles. Nitrogen fertilization has positive effects on the components of Massai grass biomass.
Key Words: fertilization, forage dry matter, Panicum maximum
www.sbz.org.br
Introduction
Pastures are the main means of livestock exploitation in Brazil and the need to intensify grazing production systems has increased the demand for studies on new forage cultivars and their responses to intensive management. Massai grass, derived from a cross between the Panicum maximum and Panicum infestum (natural hybrid) species,
has been shown to be promising and well adapted to intensive management, especially for sheep rearing, due to its low stand and great capacity to emit leaves and tiller and quick regrowth after cutting because of the high number of base sprouts.
The production potential of a forage plant is determined genetically but for this potential to be reached, abiotic conditions (temperature, moisture, light, nutrient availability) and management should be observed (Fagundes et al., 2005). Increase in forage production depends on proper nutrient availability, especially nitrogen, because it is the most limiting element to pasture growth (Chapin et al., 1987) and because it is responsible for characteristics such as leaf and stem size, by the tiller appearance and development (Werner, 1986), associated to a greater leaf expansion rate
(Garcez Neto et al., 2002), factors directly related to the dry matter production of the forage plant.
Considering the importance of Massai grass and the need for research on this forage plant, the objective of the present study was to assess the canopy biomass components of this forage plant during the establishment and two regrowth cycles under nitrogen fertilization.
Material and Methods
The research was carried out in a greenhouse in the Departamento de Fitotecnia at the Universidade Federal do Ceará - UFC, in Fortaleza, from June to December 2008. Fortaleza is located at 21 m altitude, 03° 45' 47" S, 38° 31' 23" W. The climate in Fortaleza is classified according to the Köppen classification as Aw’, wet tropical. The minimum and maximum temperatures were recorded daily and presented mean values of 28.8 and 40.5°C (establishment), 25.6 and 40.6°C (regrowth 1), 25.9 and 40.9°C (regrowth 2), respectively.
split-plot arrangement with measurements repeated in time, considering the five nitrogen levels as plots and the three growth cycles (establishment, regrowth 1 and regrowth 2) as subplots, with five replications, totaling 25 experimental units (pots).
The soil used during the experimental period was a yellow argisoil with sand and clay sediments in barrier formation as material of origin. After collection, the soil was sieved for homogenization and removal of the big particles. The soil samples, obtained in the 0 - 20 cm deep layer, presented the following chemical composition: phosphorus = 4 mg/dm3; potassium = 76 mg/dm3; Ca2+ = 2.0 cmolc/dm3; Mg2+ = 1.9 cmolc/dm3; Al3+ = 0.0 cmolc/dm3; Na+ = 11 mg/dm3; organic matter = 9.10 g/kg; base saturation = 4.14 cmolc/dm3;
CTCt = 4.14 cmolc/dm3; pH in water = 5.7; Fe2+ = 19 mg/dm3;
Cu2+ = 0.14 mg/dm3; Zn2+ = 3.91 mg/dm3; manganese =
12.18 mg/dm3, corrected by following recommendations
from CFSEMG (1999), to nitrogen levels suggested for grasses with high productive potential and high production level. The pots were placed randomly in the greenhouse. When the 10 dm3 pots were filled, the soil was corrected by applying a 6.169 g/pot dose of calcium calcite, equivalent to 1.233 kg/ha according to the fertility analysis to increase the calcium content and the pH. The samples were irrigated daily during a 10-day period to accelerate the corrective reaction.
The irrigation water application was controlled daily with the installation of mercury (Hg) tensiometers in the pots (2 tensiometers per treatment) and water was replaced when the mercury column reached approximately 10 cm in the treatments supplied with the highest nitrogen levels. The treatment that received 600 mg N/dm³ soil was a reference for the water replacements applied to the other treatments, following the equation:ψm = –12.6 h + h1 + z, in
which: ψm = matrix potential; h = mercury (Hg) column
height in the cube (cm); h1 = height of Hg level in the cube (cm) compared to the soil surface; and z = porous capsule depth (10 cm) (Amaro Filho et al., 2008). At the end of the irrigation, the mercury column height in the cube (cm) was recorded, and it presented approximately 5.0 cm for all the treatments, i.e., the soil moisture conditions were maintained close to field capacity in all the experimental units (pots). Sowing was carried out using an average of 50 seeds per pot.Thinning was carried out eight days after germination, maintaining 12 plants per pot, which were reduced to three after the final thinning, 13 days after germination.
Three cuts were made: the first for standardization, that had as reference the horizontal length of the stem, i.e., all the plants in the pots were cut leaving a 10-cm long stem
residue, 43 days after sowing. This criterion was adopted for greater standardization of the cut plants, because they grew with different degrees of tiller inclination, making uniform cutting difficult if this was carried out at a fixed vertical height. The second and third cuts followed the same criterion and were made after a 28-day rest period.
Fertilization with (simple super phosphate), potassium (potassium chloride) and micro nutrients (FTE BR-12) was made according to the results of the soil analysis and calcite application. The nitrogen (urea) and potassium applications were divided. In the establishment growth, the nitrogen level for each treatment was divided in two, and the last half was applied shortly after the final thinning and the second half was applied after 14 days. In all the nitrogen applications, urea was diluted in the irrigation water for a more uniform fertilizer application. Potassium was applied in two applications, the first (120 mg/dm3 K2O) at sowing. The second potassium application (120 mg/dm3 K2O) in water solution was shortly after the standardizing cut, together with the first nitrogen application in regrowth 1. Phosphorus (125 mg/dm3 P
2O5) was applied once at sowing. At this time,
the micronutrients (25 mg/dm3 FTE BR-12) were supplied.
The second half of the nitrogen doses for each treatment applied in regrowth 1 were applied half way through the rest period (28-day cycles). The same management was carried out in regrowth 2.
At the end of each cycle (establishment, regrowth 1 and regrowth 2), following the rest period adopted for the forage plant (43 and 28 days for establishment and regrowths, respectively), all plants of each experimental unit (pot) were harvested and taken to the laboratory for separation of the components: open leaf, budding leaf, stem (stem + skirt) and dead matter.
Data was submitted to analysis of variance, means comparison test and regression analysis. Fertilization levels´ growth cycles interaction was partitioned at p<0.05 by F test. The means were compared by Tukey test (p>0.05). The effect of the fertilization levels was also assessed by regression analysis on the main effect when there was no interaction or in the effect condition when this occurred. The models were chosen based on the significance of the linear and quadratic coefficients, by the student t-test (p<0.05) and on the coefficient of determination. The GLM procedure was adopted from the SAS statistical program (SAS, 2003) as an auxiliary tool to the statistical analysis.
Results and Discussion
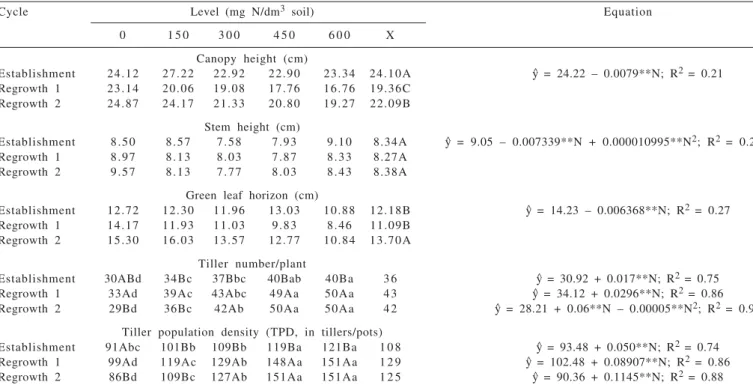
The canopy height decreased (p<0.05) as nitrogen fertilization increased and the value was higher for the establishment growth compared to regrowth 1 (Table 1) but there was no interaction among the factors (p>0.05). The greatest height (24.10 cm) observed in the establishment was justified by the longest rest period (43 days) during the forage establishment phase, because the height of the pasture is a consequence of rest time when the grass is managed and its morphological adaptations during this process. The lower canopy height observed in regrowth 1 (19.36 cm) compared to regrowth 2 (22.09 cm) may have been
the result of an impact of the first cut on the plant because its structure had not been consolidated, yet.
Canopy height decreased with nitrogen fertilization (p<0.05), with estimated values at 24.2 and 19.48 cm for the levels from 0 to 600 mg N/dm³ soil, respectively (Table 1). Although it is known that nitrogen availability in the soil and its consequent absorption by plants accelerates tissue growth, reflected in the plant height, in the present study, this increase in height was not observed because the plants which received the highest nitrogen levels had extremely decumbent growth performance, resulting in decreased canopy height. This decumbent response in the canopy height may have been caused by the greater tillering with the increase in nitrogen, associated to the escape mechanism of the plant, maintaining the meristem tip more distant from the cutting height (Pompeu et al., 2009).
In spite of different performance with the nitrogen levels, observation of the canopy height performance receiving the same fertilization levels (five replications) within the same growth cycle showed that the canopy height at pre-cut was fairly consistent and homogeneous during each growth period. This was promising for the possibility of using the canopy height in the pre-grazing condition as a practical parameter for pasture control and management in intermittent leaf loss situations (Pena et al., 2009) and under intensive management conditions, with
Cycle Level (mg N/dm3 soil) Equation
0 1 5 0 3 0 0 4 5 0 6 0 0 X
Canopy height (cm)
Establishment 24.12 27.22 22.92 22.90 23.34 24.10A y^ = 24.22 – 0.0079**N; R2 = 0.21
Regrowth 1 23.14 20.06 19.08 17.76 16.76 19.36C Regrowth 2 24.87 24.17 21.33 20.80 19.27 22.09B
Stem height (cm)
Establishment 8.50 8.57 7.58 7.93 9.10 8.34A y^ = 9.05 – 0.007339**N + 0.000010995**N2; R2 = 0.21
Regrowth 1 8.97 8.13 8.03 7.87 8.33 8.27A Regrowth 2 9.57 8.13 7.77 8.03 8.43 8.38A
Green leaf horizon (cm)
Establishment 12.72 12.30 11.96 13.03 10.88 12.18B y^ = 14.23 – 0.006368**N; R2 = 0.27
Regrowth 1 14.17 11.93 11.03 9.83 8.46 11.09B Regrowth 2 15.30 16.03 13.57 12.77 10.84 13.70A
Tiller number/plant
Establishment 30ABd 34Bc 37Bbc 40Bab 40Ba 3 6 y^ = 30.92 + 0.017**N; R2 = 0.75
Regrowth 1 33Ad 39Ac 43Abc 49Aa 50Aa 4 3 y^ = 34.12 + 0.0296**N; R2 = 0.86
Regrowth 2 29Bd 36Bc 42Ab 50Aa 50Aa 4 2 y^ = 28.21 + 0.06**N – 0.00005**N2; R2 = 0.90
Tiller population density (TPD, in tillers/pots)
Establishment 91Abc 101Bb 109Bb 119Ba 121Ba 1 0 8 y^ = 93.48 + 0.050**N; R2 = 0.74
Regrowth 1 99Ad 119Ac 129Ab 148Aa 151Aa 1 2 9 y^ = 102.48 + 0.08907**N; R2 = 0.86
Regrowth 2 86Bd 109Bc 127Ab 151Aa 151Aa 1 2 5 y^ = 90.36 + 0.1145**N; R2 = 0.88
y^ = estimated values from the regression equation for each variable analyzed; n= nitrogen levels; x = mean.
Means followed by the same lower case letters within the same line and followed by the same capital letters within the same column do not differ (P>0.05) by Tukey test; Significant at the level of 1%.
controlled fertilization and irrigation, considering a determined period of the year when radiation, temperature and moisture have a certain constancy (Silva et al., 2009). However, canopy height should be determined associated to the morpho-physiological parameters of the pasture for it to be efficient as a management tool.
The stem height did not show (p>0.05) nitrogen level × growth cycle interaction but nitrogen level effect (p<0.05) was observed on this variable, with a quadratic increase and values estimated at 9.05 and 8.60 cm for the plants supplied with 0 to 600 mg N/dm3 soil, respectively, reaching the minimum point (7.82 cm) at the 333.74 mg N/dm3 soil
dose (Table 1). The greatest stem height observed in the present study for plants without nitrogen was attributed to their more erect growth performance in consequence of the lower tiller population density, resulting in a less dense but more verticle canopy, resulting from the tiller size × density compensation reported by Bircham & Hodgson (1983).
The green leaf horizon was greater (P<0.05) in regrowth 2 (13.70 cm) compared to the other growths (12.18 and 11.09, respectively) and decreased (P<0.05) with the increase in the nitrogen levels (without interaction among the factors), at estimated values14.23 and 10.41 cm for 0 and 600 mg N/dm3 soil, respectively (Table 1). The decrease
in this variable in response to nitrogen fertilization was justified because the canopy height decreased more with the increase in the nitrogen levels compared to the stem height decrease, which narrowed this horizon. Animals tend to select leaves from the upper parts of the canopy (Chacon & Stobbs, 1976; Hodgson, 1990), concentrating bites on the horizon above the stem (Hodgson, 1990). Thus, Massai grass canopy structure where leaf matter predominates in detriment of stems and dead matter favors the ingestion rate of grazing animals.
The tiller population density (TPD) and the number of tillers per plant were influenced (p<0.05) by nitrogen fertilization and by the growth cycles, with interaction (p<0.05) among the factors. An increase in the TPD was observed from the establishment to the regrowths (Table 1), but the values did not differ (p>0.05) between regrowths 1 and 2 at high nitrogen levels (300; 450 and 600 mg N/dm3 soil). For the plants receiving lower nitrogen levels (0 and 150 mg de N/dm3 soil) decrease (p<0.05) was observed in
the TPD and tiller number per plant from regrowth 1 to regrowth 2, showing the exhaustion of the nitrogen remaining in the soil during the cycles and that the low fertilization levels did not supply the maximum response in tillers of forages with high productive potential and high tillering capacity.
The smaller nitrogen supply may have acted negatively on the grass tillering in regrowth 2 because when factors related to growth and plant development are restricted, one of the first adaptation mechanisms initiated by the plant is a decrease in new tiller emission (Davies et al., 1983; Gomide & Gomide, 1999), which may have decreased the TPD in the last growth cycle for the plants without or supplied with the low nitrogen levels.
The tiller population density increased (p<0.05) with the increase in the nitrogen levels in the three growth cycles whereas the variable tiller number per plant increased (p<0.05) for the establishment and regrowth 1 and showed quadratic increase (p<0.05) in regrowth 2 (Table 1). In the establishment period the TPD ranged (p<0.05) from 93 to 124 tillers/pot for the 0.0 and 600 mg N/dm3 soils, respectively. An increase of 32.9% in the variable was observed for the 600 mg N/dm3 soil level compared to absence of
nitrogen fertilization. Analysis of the regrowths showed that TPD ranged from 102 to 156 tillers/plant (regrowth 1) and from 90 to 159 tillers/plant (regrowth 2) for the 0.0 and 600 mg N/dm3 soil levels, respectively. Increases of 52.1% (regrowth 1) and 76.0% (regrowth 2) were observed in this variable for the 0.0 and 600 mg N/dm3 soil levels compared
to no nitrogen fertilization.
The high tillering capacity observed in the forage plant assessed was attributed to the positive effect of nitrogen on the greater speed of bud formation and the start of the corresponding tillering (Nabinger, 1996). It is emphasized that this grass, under vegetative condition and submitted to nitrogen fertilization, also presented a large quantity of base sprouts, that allowed high tillering. The nutrient availability in the soil influences forage tillering and the data presented in the present study showed the direct influence of nitrogen fertilization on tillering by the stimulating effect of the nitrogen on the growth points (Alexandrino et al., 2004). In addition to the aspects mentioned, the induction and later maintenance of high tiller population by technical fertilization management, especially nitrogen, maintained the canopy productive potential at high levels, in addition to improving the use of productive resources, such as water, nutrients, labor, a light and temperature, used in grazing.
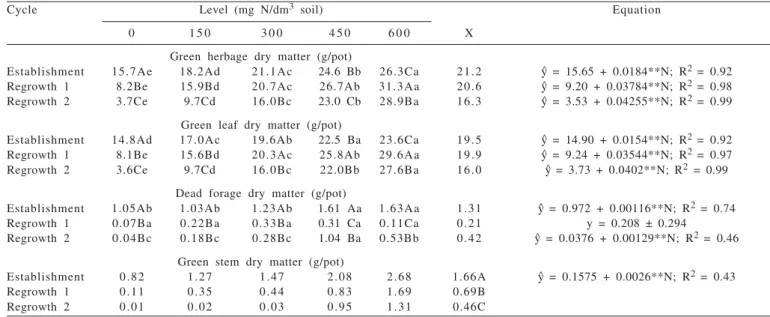
for the plants supplied with higher nitrogen levels. The GHDM ranged from 15.7 to 26.7 g/pot (establishment), 9.2 to 31.9 g/pot (regrowth 1) and 3.5 to 29.0 g/pot (regrowth 2) for 0 to 600 mg N/dm3 soil levels, respectively. For each 1 mg N/dm3 soil, increases of 0.0184, 0.03784 and 0.04255 g
GLDM/plant for establishment were observed in regrowth 1 and regrowth 2, respectively (Table 2). The greater increases observed for these variables over the cycles was justified by the increase in the tiller population density observed for the growth in regrowth 1, because of the intense cutting and the exposure of the base sprouts to a luminous environment which favored new tillering.
The green leaf dry matter (GLDM) ranged from 14.9 to 24.1 g/pot (establishment), 9.2 to 35.5 g/pot (regrowth 1) and 3.7 to 27.9 g/pot (regrowth 2) for the 0 to 600 mg N/dm3 soil
levels, respectively, with increases of 61.7% (establishment), 231.5% (regrowth 1) and 654.1% (regrowth 2) for the 0 to 600 mg N/dm3 soil levels compared to the plants which were
not supplied with nitrogen (Table 2). The increase in leaf biomass resulting from nitrogen fertilization in Massai grass plants was partly justified by leaf elongation rates (LER), which were positively related to regrowth 1 vigor and GLDM accumulation (Vilela et al., 1978). Increases in GHDM and GLDM were attributed to the tiller population density (TPD) which increased with the nitrogen levels, together with the yield per tiller. This performance resulted from the high correlation (p<0.05) between the tiller population density and the forage and green leaf dry matter production, respectively (r = 0.76 and r = 0.80).
Response of Massai grass to the nitrogen levels clearly demonstrated that the supply of this nutrient from the soil did not meet the requirement for maximum growth of high productive potential forage grasses, which have great demand for this element (Simpson & Stobbs, 1981). To obtain high forage biomass production, in addition to nitrogen fertilization, it should be maintained adequate levels of phosphorus, potassium and sulfur and the other nutrients, which influence the response capacity of the forage plant submitted to high nitrogen levels. In the present study, based on the results of the soil analysis, it was endeavored to meet the nutritional requirements of the Massai grass plants.
Interaction (P<0.05) was observed among the factors for the dead forage dry matter (DFDM) which increased (P<0.05) with the nitrogen levels in the establishment and regrowth 2 and decreased (P<0.05) from establishment to regrowth 1 but did not differ (p>0.05) between regrowths 1 and 2 (Table 2) for the plants supplied with the lowest nitrogen levels (0, 150 and 300 mg N/dm3 soil). The greater
DFDM value in the establishment was a result of the longer growth period (43 days) in this phase of the forage, compared to the 28-day rest period adopted in the two regrowth cycles.
Dead forage dry matter ranged from 0.97 to 1.67 g/pot (establishment) and from 0.038 to 0.81 g/pot (regrowth 2) for the 0 to 600 mg N/dm3 soil levels, respectively. There was
no effect (p>0.05) for this variable during regrowth 1, with a mean of 0.208 g/pot, possibly because it was the first
y^ = estimated values from the regression equation for each variable analyzed; n= nitrogen levels; x = mean.
Means followed by the same letters within line (lower case) and within column (capital letter) do not differ (p>0.05) by Tukey test; Significant at the level of 1%.
Cycle Level (mg N/dm3 soil) Equation
0 1 5 0 3 0 0 4 5 0 6 0 0 X
Green herbage dry matter (g/pot)
Establishment 15.7Ae 18.2Ad 21.1Ac 24.6 Bb 26.3Ca 21.2 y^ = 15.65 + 0.0184**N; R2 = 0.92
Regrowth 1 8.2Be 15.9Bd 20.7Ac 26.7Ab 31.3Aa 20.6 y^ = 9.20 + 0.03784**N; R2 = 0.98
Regrowth 2 3.7Ce 9.7Cd 16.0Bc 23.0 Cb 28.9Ba 16.3 y^ = 3.53 + 0.04255**N; R2 = 0.99
Green leaf dry matter (g/pot)
Establishment 14.8Ad 17.0Ac 19.6Ab 22.5 Ba 23.6Ca 19.5 y^ = 14.90 + 0.0154**N; R2 = 0.92
Regrowth 1 8.1Be 15.6Bd 20.3Ac 25.8Ab 29.6Aa 19.9 y^ = 9.24 + 0.03544**N; R2 = 0.97
Regrowth 2 3.6Ce 9.7Cd 16.0Bc 22.0Bb 27.6Ba 16.0 y^ = 3.73 + 0.0402**N; R2 = 0.99
Dead forage dry matter (g/pot)
Establishment 1.05Ab 1.03Ab 1.23Ab 1.61 Aa 1.63Aa 1.31 y^ = 0.972 + 0.00116**N; R2 = 0.74
Regrowth 1 0.07Ba 0.22Ba 0.33Ba 0.31 Ca 0.11Ca 0.21 y = 0.208 ± 0.294
Regrowth 2 0.04Bc 0.18Bc 0.28Bc 1.04 Ba 0.53Bb 0.42 y^ = 0.0376 + 0.00129**N; R2 = 0.46
Green stem dry matter (g/pot)
Establishment 0.82 1.27 1.47 2.08 2.68 1.66A y^ = 0.1575 + 0.0026**N; R2 = 0.43
Regrowth 1 0.11 0.35 0.44 0.83 1.69 0.69B Regrowth 2 0.01 0.02 0.03 0.95 1.31 0.46C
growth in regrowth and dead matter had not yet accumulated during this growth cycle (Table 2). The DFDM response pattern in the establishment was due to the combined effect of the nitrogen levels × prolonged growth cycle in this phase (43 rest days). In regrowth 2 increase in the forage dead dry matter at the higher N levels was probably a result from the accumulative effect of dead matter with the successive cycles because during the regrowth cycles the dead matter accumulation in the lower strata contributed to greater dead forage dry matter.
The green stem dry matter (GCDM) was influenced (p<0.05) both by nitrogen fertilization and the growth cycles but there was no interaction (p>0.05) among the factors. Linear increase (p<0.05) was observed for this variable, with estimated values at 0.158 and 1.72 g/pot for 0.0 to 600 mg N/dm3 soil, respectively, that presented a higher value (1.66 g/pot) during establishment (Table 2). The higher value observed for this variable in the establishment was attributed to the prolonged rest period (43 days).
In spite of raising forage production, increase in GCDM had negative effects on the quality of the forage produced and its use by grazing animals (Silva et al., 2007), due to the voluntarily reduced dry matter intake by the animal (Cândido et al., 2006), as a result of the thickening of the secondary plant cell wall, with lignin accumulation and less digestible structural carbohydrates (Wilson & Kennedy, 1996).
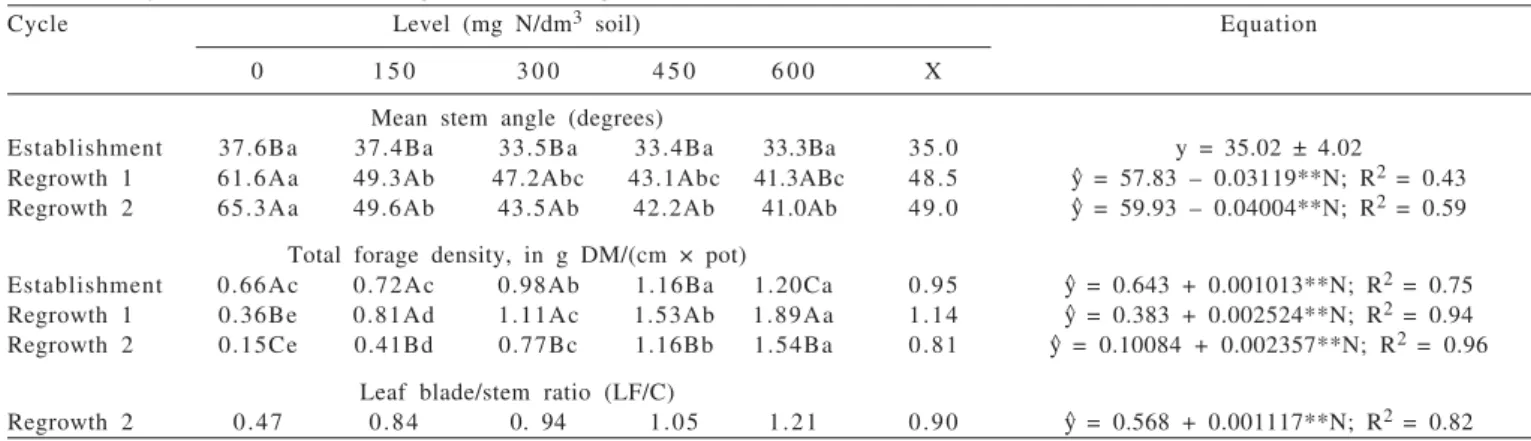
The mean stem angle was influenced (p<0.05) by nitrogen fertilization and the growth cycles, with interaction (p<0.05) among the factors. Decrease was observed (p<0.05) from the establishment to the regrowths, justified by the more vertical growth of the plants during the regrowth period (Table 3). The variable assessed was not influenced (p>0.05) by the increasing nitrogen levels in the establishment, with an average of 35°, but gross values tended to decrease (P
£
0.1619).Decrease (p<0.05) was observed for the mean stem angle during the regrowths, with estimated values at 57.83 to 39.12° (regrowth 1) and 59.93 to 35.91° (regrowth 2) for 0 and 600 mg N/dm3 soil, respectively (Table 3). This
performance may have resulted from the great nitrogen supply that raised tillering and consequently led to greater competition for environmental resources, especially light, due to the decrease in the V/Ve ratio (Deregibus et al., 1985) leading to decumbent growth as an escape mechanism to maintain the tip meristem far the from the cutting height (phenotypic plasticity).
It is important to monitor this variable (mean stem angle) in relation to the structural performance of the pasture with the successive cycles of cutting or grazing. When working with grasses with curling growth habit, the mean stem angle reflects the growth pattern of the forage, indicating an erect or prostrate growth in response to the management adopted, ratifying the importance of this variable in pasture management. Under more prostrate growth conditions, the coefficient of canopy luminous extinction and the attenuating photosynthesis active radiation (PAR) is raised, increasing mutual shading and reducing the photosynthesis capacity of the new leaves. Interaction was observed (p<0.05) among the factors for total forage density, which increased (p<0.05) with nitrogen fertilization in the three growth cycles, with estimated values from 0.643 to 1.25 DM/(pot×cm) (establishment), from 0.383 to 1.90 g DM/(pot × cm) (regrowth 1) and from 0.101 to 1.52 g DM/(pot × cm) (regrowth 2) for the 0 to 600 mg N/dm3 soil levels, respectively, with increases
of 94.4% (establishment), 396.1% (regrowth 1) and 1,405.0% (regrowth 2) for the 600 mg N/dm3 soil level compared to
absence of nitrogen fertilization (Table 3), explained by the maintenance of a high tiller population in the pasture leading to a more compact canopy architecture. This variable
Cycle Level (mg N/dm3 soil) Equation
0 1 5 0 3 0 0 4 5 0 6 0 0 X
Mean stem angle (degrees)
Establishment 37.6Ba 37.4Ba 33.5Ba 33.4Ba 33.3Ba 35.0 y = 35.02 ± 4.02
Regrowth 1 61.6Aa 49.3Ab 47.2Abc 43.1Abc 41.3ABc 48.5 y^ = 57.83 – 0.03119**N; R2 = 0.43
Regrowth 2 65.3Aa 49.6Ab 43.5Ab 42.2Ab 41.0Ab 49.0 y^ = 59.93 – 0.04004**N; R2 = 0.59
Total forage density, in g DM/(cm × pot)
Establishment 0.66Ac 0.72Ac 0.98Ab 1.16Ba 1.20Ca 0.95 y^ = 0.643 + 0.001013**N; R2 = 0.75
Regrowth 1 0.36Be 0.81Ad 1.11Ac 1.53Ab 1.89Aa 1.14 y^ = 0.383 + 0.002524**N; R2 = 0.94
Regrowth 2 0.15Ce 0.41Bd 0.77Bc 1.16Bb 1.54Ba 0.81 y^ = 0.10084 + 0.002357**N; R2 = 0.96
Leaf blade/stem ratio (LF/C)
Regrowth 2 0.47 0.84 0. 94 1.05 1.21 0.90 y^ = 0.568 + 0.001117**N; R2 = 0.82
y^ = estimated values from the regression equation for each variable analyzed; n= nitrogen levels; x = mean.
Means followed by the same letters within the same line (lower case letters) and within the same column (upper case) do not differ (p>0.05) by Tukey test; Significant at the level of 1%.
decreased (p<0.05) from the establishment to regrowths 1 and 2 in the plants without nitrogen but increase (p<0.05) was observed at the highest nitrogen levels (450 and 600 mg N/dm3 soil) from the establishment to regrowth 1, justified by the decrease in the canopy height from establishment to regrowth 1 observed in the present study, resulting in a more compact and dense pasture (Table 3).
The forage density increased because of the increase in tillers, probably because of their greater size and inclination that conferred less height for the same forage mass. Nitrogen fertilization is a strategy that allows increase in forage density and especially production in the canopy profile, because nitrogen has a significant effect on the rate of leaf appearance and elongation in grasses (Mazzanti et al., 1994).
Leaf/stem ratio (LF/C), assessed in regrowth 2, increased (P<0.05) with the increases in nitrogen levels at estimated values of 0.057 and 1.24 for 0.0 and 600 mg N/dm3 soil,
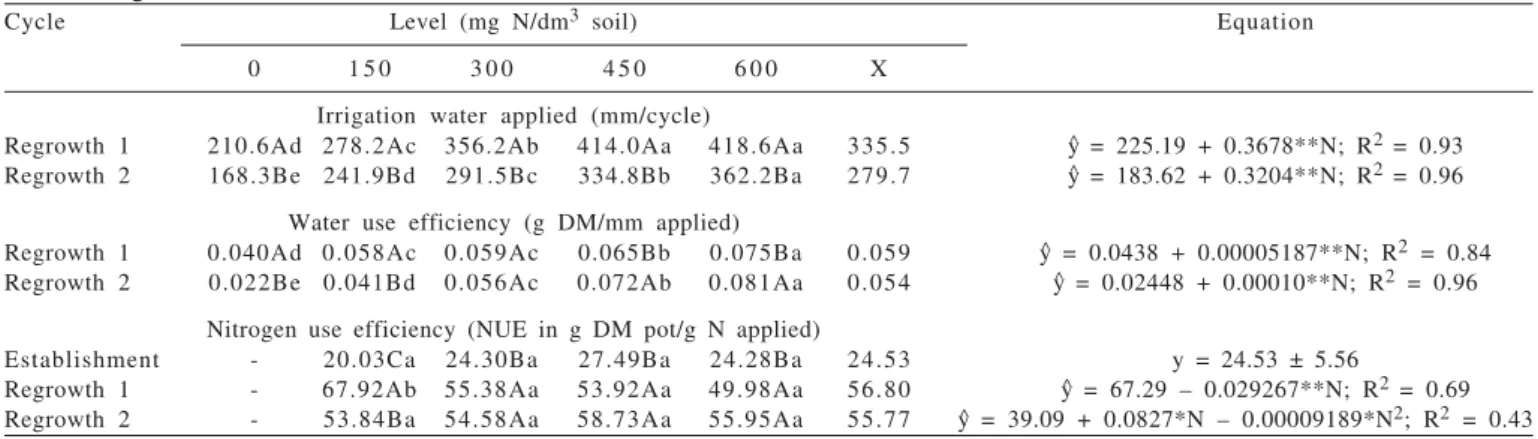
respectively (Table 3). Therefore, it was inferred that the elongation of the stems of the forage studied and its consequent increase in dry matter were not so consistent as to decrease the LF/C ratio, because the leaf production also increased with nitrogen fertilization, in greater proportion than that of the stem. Thus, nitrogen fertilization resulted in more consistent effects on the leaf biomass production than on the stem matter yield, showing the relevance of this nutrient for increase in leaf biomass in the Massai grass canopy. Reduction in the leaf/stem ratio and, consequently, the relative decrease in leaf quantity and the manner how they are offered to the animal affect intake, because leaf quality is superior to that of the stems and leaves consist of tissues that are more easily fragmented and digested (Akin, 1989). The variables irrigation water applied (IWA) and water use efficiency (WUE) showed interaction (P<0.05) among the factors assessed and increased more(P<0.05) in both
regrowths with the increases in nitrogen levels (Table 4). The water applied decreased (P<0.05) from regrowth 1 to regrowth 2 when the growth cycles were compared, possibly because the biomass area decreased, especially GLDM (Table 2), therefore reducing the water demand in regrowth 2 in response to the small leaf area, resulting in less water loss through transpiration. Water use efficiency was greater (p<0.05) in regrowth 2 for the plants supplied with high nitrogen levels (450 and 600 mg N/dm3 soil), justified by the
smaller water requirement in this growth cycle (regrowth 2) and increase in root matter (data not shown) at the highest nitrogen fertilization levels.
The irrigation water applied (IWA) ranged from 225.19 to 445.87 mm/cycle (regrowth 1) and from 183.62 to 375.86 mm/cycle (regrowth 2) and water use efficiency (WUE) from 0.0438 to 0.0749 g DM/mm applied (regrowth 1) and from 0.0245 to 0.0845 g DM/mm applied (regrowth 2) for the 0 to 600 mg N/dm3 soil levels, respectively. At the 600 mg N/dm3 soil level, the IWA increased by 98.0 and 104.7%, in regrowth 1 and 2, respectively, compared to the treatment without nitrogen fertilization (Table 4).
The increase in the irrigation water applied with the increase in the nitrogen levels was justified because of the effect of this nutrient on canopy biomass, especially GLDM (Table 2) which resulted in larger leaf area, with greater leaf surface and transpiration rate, enhancing water uptake potential by the plant community that consequently required a greater water supply (Bonfim-Silva et al., 2007) for the proper physiological functioning of the forage plant.
Although the irrigation water applied increased with the nitrogen levels, these increases were balanced with the increase in biomass area, so that the water use efficiency was not damaged, because the GLDM production was also
Cycle Level (mg N/dm3 soil) Equation
0 1 5 0 3 0 0 4 5 0 6 0 0 X
Irrigation water applied (mm/cycle)
Regrowth 1 210.6Ad 278.2Ac 356.2Ab 414.0Aa 418.6Aa 335.5 y^ = 225.19 + 0.3678**N; R2 = 0.93
Regrowth 2 168.3Be 241.9Bd 291.5Bc 334.8Bb 362.2Ba 279.7 y^ = 183.62 + 0.3204**N; R2 = 0.96
Water use efficiency (g DM/mm applied)
Regrowth 1 0.040Ad 0.058Ac 0.059Ac 0.065Bb 0.075Ba 0.059 y^ = 0.0438 + 0.00005187**N; R2 = 0.84
Regrowth 2 0.022Be 0.041Bd 0.056Ac 0.072Ab 0.081Aa 0.054 y^ = 0.02448 + 0.00010**N; R2 = 0.96
Nitrogen use efficiency (NUE in g DM pot/g N applied)
Establishment - 20.03Ca 24.30Ba 27.49Ba 24.28Ba 24.53 y = 24.53 ± 5.56
Regrowth 1 - 67.92Ab 55.38Aa 53.92Aa 49.98Aa 56.80 y^ = 67.29 – 0.029267**N; R2 = 0.69
Regrowth 2 - 53.84Ba 54.58Aa 58.73Aa 55.95Aa 55.77 y^ = 39.09 + 0.0827*N – 0.00009189*N2; R2 = 0.43
y^ = estimated values from the regression equation for each variable analyzed; n= nitrogen levels; x = mean.
Means followed by the same lower case letters within same line (lower case) and within the same column (capital letter) do not differ (P>0.05) by Tukey test; Significant at the level of 1%.
greater at higher levels (Table 2) compared to the increase in the IWA as the nitrogen fertilization increased, justifying the performance for WUE in this experiment and showing the relevance of considering all factors (including irrigation water applied, fertilization level, forage species) involved in the system so that there is synchrony in the process with positive responses in function of management adopted for the forage production in plants with high productive potential.
The nitrogen use efficiency (NUE) was influenced (p<0.05) by nitrogen fertilization and by the growth cycles, with interaction (p<0.05) among the factors (Table 4). In regrowth 1, linear decrease was observed (p<0.05) and in regrowth 2 a quadratic response was observed, whereas in the establishment, there was no effect (p>0.05) of the nitrogen levels with a mean of 24.5 g DM pot/g N applied. The regrowths presented higher values for this variable and there was no difference (p>0.05) (regrowth 1 and 2) for the plants supplied with the higher nitrogen levels (300, 450 and 600 mg N/dm3 soil) (Table 4).
In regrowth 1, the estimated values were 62.9 and 49.7 for the 150 and 600 mg N/dm3 soil levels, respectively, with
a 20.9% reduction in the 600 mg N/dm3 soil dose compared
to the treatment supplied with 150 mg N/dm3 soil. In regrowth 2, maximum NUE (58.5 g DM pot/g N applied) was obtained in the 450 mg N/dm3 soil dose (Table 4). The absence of the effect of nitrogen fertilization on NUE in the forage establishment was probably due to the homogeneity of the substrate (soil) used, i.e., to the similar organic matter content of the soil that supplied this nutrient in adequate quantity for good plant development in the establishment growth, leading to the standardization in the Massai grass stand in all the treatments assessed and consequent absence of difference in nitrogen use efficiency.
The reduction in the nitrogen use efficiency with the increase in the levels applied in regrowth 1 was probably caused by less N use by the plant (Dougherty & Rhykerd, 1985) and greater losses by a volatilization. Nitrogen use efficiency can vary in function of fertilization applications, the fertilization source used, soil organic matter content, climatic conditions and plant stand in the pasture.
Conclusions
Growth cycles modify the Massai grass canopy structure and the nitrogen fertilization results in positive responses in most of the canopy biomass components up to the level of 600 mg de N/dm3 soil. Aplication of irrigation water and
water use efficiency are positively affected up to the least nitrogen level.
Acknowledgments
The authors thank the SESu, especially the Tutorial Education Program (PET), for financial help and study grants.
References
AKIN, D.E. Histological and phisical factors affecting digestibility of forages. Agronomy Journal, v.81, n.1, p.17-25, 1989. ALEXANDRINO, E.; NASCIMENTO JÚNIOR, D.; MOSQUIM,
P.R. et al. Características morfogênicas e estruturais na rebrotação da Brachiaria brizantha cv. marandu submetida a três doses de nitrogênio. Revista Brasileira de Zootecnia, v.33, n.6, p.1372-1379, 2004.
AMARO FILHO, J.; ASSIS JÚNIOR, R.N.; MOTA, J.C.A. Física do solo: conceitos e aplicações. Fortaleza: Editora Imprensa Universitária, 2008. 290p.
BIRCHAM, J.S.; HODGSON, J. The influence of sward condition on rates of herbage growth and senescence in mixed swards under continuous stocking management. Grass and forage Science, v.38, n.4, p.323-331, 1983.
BONFIM-SILVA, E.M.; MONTEIRO, F.A.; DA SILVA, T.J.A. Nitrogênio e enxofre na produção e no uso de água pelo capim-braquiária em degradação. Revista Brasileira de Ciência do Solo, v.31, n.2, p.309-317, 2007.
CÂNDIDO, M.J.D.; SILVA, R.G.; NEIVA, J.N.M. et al. Fluxo de biomassa em capim-tanzânia pastejado por ovinos sob três períodos de descanso. Revista Brasileira de Zootecnia, v.35, n.6, p.2234-2242, 2006.
CHACON, E.; STOBBS, T.H. Influence of progressive defoliation of a grass sward on the eating behaviour of cattle. AustralianJournal of Agricultural Research, v.27, n.5, p.709-727, 1976. CHAPIN, F.S.; BLOOM, A.J.; FIELD, C.B. et al. Plant response to
multiple environmental factors. Bio Science,v.37, p.49-57, 1987. COMISSÃO DE FERTILIDADE DO SOLO DO ESTADO DE MINAS GERAIS – CFSEMG. Recomendações para uso de corretivos e fertilizantes em Minas Gerais - 5ª Aproximação. Viçosa, MG: UFV, 1999. 359p.
DAVIES, A.; EVANS, M.E.; EXLEY, J.K. Regrowth of perennial ryegrass as affected by simulated leaf sheaths. Journal Agricultural Science, v.101, n.1, p.131-137, 1983. DEREGIBUS, V.A.; SANCHEZ, R.A.; CASAL, J.J. et al. Tillering
responses to enrichment of red light beneath the canopy in a humid natural grassland. Journal of Applied Ecology, v.22, n.1, p.199-206, 1985.
DOUGHERTY, C.T.; RHYKERD, C.L. The role of nitrogen in forage-animal production. In: HEATH, M.E.; BARNES, R.F.; METCALFE, D.S. (Eds.) Forages: the science of grassland agriculture. Ames: Iowa State University Press, 1985. p.318-325. FAGUNDES, L.J.; FONSECA, D.M.; GOMIDE, J.A. et al. Acúmulo de forragem em pastos de Brachiaria decumbens adubadas com nitrogênio. Pesquisa Agropecuária Brasileira, v.40, n.4, p.397-403, 2005.
GARCEZ NETO, A.F.; NASCIMENTO JÚNIOR, D.; REGAZZI, A.J. et al. Respostas morfogênicas e estruturais de Panicum Maximum cv. Mombaça sob diferentes níveis de adubação nitrogenada e alturas de corte. Revista Brasileira de Zootecnia, v.31, n.5, p.1890-1900, 2002.
GOMIDE, C.A.M.; GOMIDE, J.A. Análise de crescimento de cultivares de Panicum maximum Jacq. Revista Brasileira de Zootecnia, v.28, n.4, p.675-680, 1999.
HODGSON, J. Grazing management: science into practice. Harlow: Longman Scientific & Technical, 1990. 203p. MAZZANTI, A.; LEMAIRE, G.; GASTAL, F. The effect nitrogen
continuously grazed with sheep. 1 - Herbage growth dynamics.
Grass and forage Science, v.49, n.2, p.111-120, 1994. NABINGER, C. Princípios da exploração intensiva de pastagens.
In: PEIXOTO, A.M.; MOURA, J.C.; FARIA, V.P. (Eds.)
P r o d u ç ã o d e b o v i n o s a p a s t o. Piracicaba: Fundação de
Estudos Agrários Luiz de Queiroz, 1996. p.15-95.
PENA, K.S.; NASCIMENTO JÚNIOR, D.; SILVA, S.C. et al. C a r a c t e r í s t i c a s m o r f o g ê n i c a s , e s t r u t u r a i s e a c ú m u l o d e forragem do capim-tanzânia submetido a duas alturas e três intervalos de corte. Revista Brasileira de Zootecnia, v.38, n.11, p.2127-2136, 2009.
POMPEU, R.C.F.F.; CÂNDIDO, M.J.D.; NEIVA, J.N.M. et al. Fluxo de biomassa em capim-tanzânia sob lotação rotativa com quatro níveis de suplementação concentrada. Revista B r a s i l e i r a d e Z o o t e c n i a, v.38, n.5, p.809-817, 2009.
SILVA, R.G.; CÂNDIDO, M.J.D.; NEIVA, J.N.M. et al. Características estruturais do dossel de pastagens de capim-tanzânia mantidas sob três períodos de descanso com ovinos. Revista Brasileira de Zootecnia, v.36, n.5, p.1255-1265, 2007.
SILVA, S.C.; BUENO, A.A.O.; CARNEVALL, R.A. et al. Sward s t r u c t u r a l c h a r a c t e r i s t i c s a n d h e r b a g e a c c u m u l a t i o n o f
P a n i c u m m a x i m u m cv. Mombaça subjected to rotational
stocking managements. Scientia Agricola, v.66, n.1, p.8-19, 2 0 0 9 .
SIMPSON, J.R.; STOBBS, T.H. Nitrogen supply and animal p r o d u c t i o n f r o m p a s t u r e s . I n : M O R L E Y, F. H . W. ( E d . ) .
Grazing animals. Amsterdam: Elsevier, 1981. p.261-288. STATISTICAL ANALYSES SYSTEM - SAS. SAS System for W i n d o w s. Version 9.0. Cary: SAS Institute Inc., 2003. (2 CD-ROM).
VILELA, H.; GOMIDE, J.A.; MAESTRI, M. Efeito da idade da planta ao primeiro corte e dos intervalos entre cortes sobre o rendimento forrageiro, teor de carboidratos solúveis na base da planta, índice de área foliar e interceptação da luz em aveia forrageira. Revista Brasileira de Zootecnia, v.7, n.1, p.79-83, 1978.
WERNER, J.C. Adubação de pastagens. Nova Odessa: Instituto
de Zootecnia, 1986. 49p. (Boletim Técnico, 18).