BUILDING PREDICTIVE MODELS OF SOIL PARTICLE-SIZE
DISTRIBUTION
(1)Alessandro Samuel-Rosa(2), Ricardo Simão Diniz Dalmolin(3) & Pablo Miguel(4)
SUMMARY
Is it possible to build predictive models (PMs) of soil particle-size distribution (psd) in a region with complex geology and a young and unstable land-surface? The main objective of this study was to answer this question. A set of 339 soil samples from a small slope catchment in Southern Brazil was used to build PMs of psd in the surface soil layer. Multiple linear regression models were constructed using terrain attributes (elevation, slope, catchment area, convergence index, and topographic wetness index). The PMs explained more than half of the data variance. This performance is similar to (or even better than) that of the conventional soil mapping approach. For some size fractions, the PM performance can reach 70 %. Largest uncertainties were observed in geologically more complex areas. Therefore, significant improvements in the predictions can only be achieved if accurate geological data is made available. Meanwhile, PMs built on terrain attributes are efficient in predicting the particle-size distribution (psd) of soils in regions of complex geology.
Index terms: digital soil mapping, terrain attributes, multiple linear regression, cross-validation, additive log-ratio.
RESUMO: CONSTRUÇÃO DE MODELOS PREDITIVOS DA DISTRIBUIÇÃO DO TAMANHO DE PARTÍCULAS DO SOLO
É possível construir modelos preditivos (MPs) da distribuição do tamanho de partículas do solo (DTP) em uma região que possua geologia complexa e uma superfície geomórfica
(1) Extracted from the Master Thesis of the first author. Received for publication on December 21, 2011 and approved on August 17, 2012.
(2) PhD student, Post-Graduation Course in Agronomy - Soil Science (PPGCS), Federal Rural University of Rio de Janeiro. CNPq scholarship. Antiga Rodovia Rio-São Paulo, km 7. CEP 23890-000 Seropédica (RJ). E-mail: alessandrosamuel@yahoo.com.br. Homepage: <http://soil-scientist.net>
jovem e instável? O principal objetivo deste trabalho foi responder a essa questão. Um conjunto de 339 amostras de solo de uma pequena bacia hidrográfica de encosta do sul do Brasil foi usado para construir MPs da DTP na camada superficial do solo. Modelos de regressão linear múltiplos foram construídos com atributos de terreno (elevação, declividade, área de captação, índice de convergência, índice de umidade topográfica). Os MPs explicaram mais da metade da variância dos dados. Esse desempenho é semelhante (se não melhor) ao da abordagem tradicional de mapeamento de solos. Para algumas frações de tamanho, o desempenho dos MPs pode chegar a 70 %. As maiores incertezas ocorrem nas áreas de maior complexidade geológica. Assim, melhorias significativas nas predições somente poderão ser alcançadas se dados geológicos acurados forem disponibilizados. Enquanto isso, MPs construídos a partir de atributos de terreno são eficientes em estimar a DTP de solos de regiões com geologia complexa.
Termos de indexação: mapeamento digital de solos, atributos de terreno, regressão linear múltipla, validação cruzada, log-razão aditiva.
INTRODUCTION
The particle-size distribution (psd) is one of the most important soil attributes. It determines and influences most soil properties. These properties are essential when attempting to determine an appropriate soil use. For this purpose, the psd of soils must be known on a worldwide basis. However, to carry out this task by conventional soil mapping techniques would be too difficult and expensive, for requiring sampling and analyses of an all too large set of soil data. The main alternative is to build quantitative predictive models (PMs) (McBratney et al., 2003), based on the relation between psd and environmental co-variates, such as terrain attributes (Bishop & Minasny, 2006).
However, the relation between psd and terrain attributes is not evident in all land surfaces: it can be strong in one but weak in another (Grunwald, 2006). Therefore, it will never be possible to construct a single, globally valid PM of soil psd (Grunwald, 2009). Studies must be developed in a broad range of land surfaces (McKenzie et al., 2000), as for example in the region of Serra Geral in southern Brazil. The regional geology is complex and includes several igneous and sedimentary rocks (Sartori, 2009), which define hydrology and topography. The relief ranges from plain to mountainous and periodic landslides occur in the steepest areas (Pinheiro & Soares, 2004). Despite the soil fragility, the region was deforested in the late XIX century and soils were used for agriculture during several decades, resulting in high rates of soil erosion (Samuel-Rosa et al., 2011).
The above-mentioned aspects show that the Serra Geral region is geologically complex and has a young and unstable land-surface. Is it possible to develop PMs of soil psd in this situation? Should the region be stratified into less heterogeneous domains before building the PMs? In general, any region should be stratified into distinct geology-based, physiographic domains before developing PMs (Gessler et al., 1995). However, a geology-based stratification in the Serra Geral region would be extremely time-consuming since
the accuracy of the geologic information available is limited. Many recent sedimentary bodies, such as fluvial and colluvial deposits, are not represented in the maps. Therefore, the region can only be stratified into two physiographic domains: the first where igneous rocks prevail and the second where sedimentary rocks prevail. Does this stratification allow the development of PMs with a greater predictive capacity? The purpose of this study was to answer these questions.
MATERIAL AND METHODS
Study site
The study was carried out in a catchment (18.92 km2)
which is assumed to be representative of the whole region of Serra Geral (Figure 1). Central UTM coordinates are 22 J 229489 m E and 6718530 m S. The climate is classified as Cfa (humid subtropical climate without a defined dry season), with a mean annual
temperature of 19.2 oC and mean annual precipitation
of 1,708 mm (Maluf, 2000). The relief varies from plain to mountainous, at elevations between 139 and 475 m asl.
The geology of the catchment is complex (Sartori, 2009): the Superior Sequence of the Serra Geral formation (igneous rocks - rhyolite-rhyodacite) is found at ±350 m and the Inferior Sequence of the Serra Geral formation (igneous rocks - basalt-andesite and sedimentary rocks - intertrapped aeolian sandstone) between ±200 and ±350 m. Below it lies the Botucatu formation (sedimentary rocks - aeolian sandstone) and at elevations below ±200 m the Caturrita formation (sedimentary rocks - fluvial sandstone). Colluvial deposits (material from the Serra Geral and Botucatu formations) are found between ±250 and ±300 m. Colluvial deposits (material from the Caturrita and Botucatu formations) can also be found at ±200 m. Close to the drainage channels, recent fluvial deposits are common.
expeditions, the catchment was divided into two physiographic domains: an upslope (>300 m), where igneous rocks prevail, and downslope domain (<300 m), with mostly sedimentary rocks (Figure 1). Therefore, aside from the PMs developed for the whole catchment, PMs were also built for each physiographic domain.
Soil sampling and analysis
Soil samples to construct the PMs were collected in earlier studies of soil and land use survey of the area (Miguel, 2010; Samuel-Rosa et al., 2011) (Figure 1). Expert knowledge was used to select the 339 sampling sites, at which three soil pits were opened within an area of 100 m². Samples were taken from the surface layer (0-20 cm or the whole A horizon when the soil was shallower than 20 cm). A composite sample was obtained from the mixture of the three subsamples and the parent material of the soil was identified visually. Composite samples were taken to the laboratory and passed through a 2-mm sieve after they had been air-dried. Particle-size distribution (Figure 2) was determined by the pipette method after
removal of the organic matter with H2O2 (30 % v/v)
in those samples containing more than 5 % of organic matter (Embrapa, 1997). Sodium hydroxide was the dispersing agent in the analysis.
Digital elevation models and predictor variables
A 10-m resolution digital elevation models (DEM) was derived from contour lines digitized from topographic maps of the geographic service of the Brazilian army (1:25,000). The DEM resolution was selected using the method described by Hutchinson
(1996). Interpolation was carried out in ArcGIS 9.3
using the Topo to raster command. Fifteen terrain
attributes were derived from the DEM using SAGA GIS. The attributes were selected according to 1) their relation with processes that influence soil psd and 2) the frequency of use in similar studies. They comprised: catchment area, catchment slope, convergence index, curvature, elevation, elevation above channel network, land surface ruggedness index, LS-factor, northerness
(|180o - aspect|), plan curvature, profile curvature,
slope, slope length, stream power index, and topographic wetness index. The information on the
Figure 2. The particle-size distribution of the soils according to its parent material (black - igneous rocks, gray - sedimentary rocks).
Cla y, %
S ilt
, %
Sand, % Survey are a location map
0 750 1,500 3,000 Meters
475
139 Legend
Samples
Limits of the study area 300 m
Elevation (m)
Figure 1. The study catchment: sampling points, delimitation of the upslope and downslope domains and elevation.
terrain attributes was sampled from the 339 georeferenced observations using the nearest neighbor algorithm. Descriptive statistics and histograms of
frequency were obtained using the package fitdistrplus
(Delignette-Muller et al., 2010) in R (R Development Core Team, 2011). Variables with skewness > 1.0 were transformed to the natural logarithmic scale or to its square root to approach a normal distribution. The degree of multicollinearity was evaluated using linear correlation and principal component analysis with the
package stats in R. In the end, only five terrain
attributes were used for the PMs: elevation (ELEV), natural logarithm of catchment area (CATCH_A), slope (SLOPE), convergence index (CONV) and natural logarithm of topographic wetness index (WET).
Development of predictive models (PMs)
Multiple linear regression models were built to estimate the psd of the soils. Before building the PMs, the three size fractions (sand, silt and clay) were transformed to additive log-ratios (alr), according to recommendations of Aitchison (1986):
[
]
úû ù ê ë é ÷÷ ø ö çç è æ ÷÷ ø ö çç è æ -D D D i D i x x x x = y y 1
1 ln Lln
L , for all i = 1, 2, …, D-1 (1)
where xD is the value of the remaining Dth variable.
In this study D = 3; therefore, xi = x1 = clay, xD–1 = x2
= silt, and xD = x3 = sand. In this way, two
alr-transformed variables were obtained: ln (clay/sand) and ln (silt/sand). The PMs built to predict the soil psd in the entire catchment are henceforth called PMs-1. They were developed from a subset of 300 randomly sampled observations (seed=123) from the complete dataset (n=339). Terrain attributes were subjected to forward selection and backward elimination. Predictions of ln(clay/sand) and ln(silt/sand) were back-transformed as follows:
( ) ( )
{exp y1+Lexp yD-1+1}
[x1 x2LxD]=[exp( )y1 Lexp(yD-1)1]/ (2) The psd predictions made by PMs-1 were plotted against measured values, and the residuals kriged to evaluate the performance of PMs-1. A 10-fold cross-validation was performed using the complete dataset (339 observations) and repeated 100 times to validate
the PMs-1 using the package chemometrics
(Filzmoser & Varmuza, 2011). The folds were selected randomly (seed=1234). On each occasion, after back-transformation by equation 2 for each size fraction, four statistics were calculated: root mean square error (RMSE), normalized root mean square error (NRMSE = RMSE/data range), bias and adjusted
coefficient of determination (R²aj). For each statistics,
the 2.5 percentile, median and 97.5 percentile were calculated. These statistics were also obtained separately for each physiographic domain (upslope and downslope).
Multiple linear regression models were built on alr-transformed variables from observations located
downslope (< 300 m; n=165) and upslope ( < 300 m;
n=174) (Figure 1), to verify if predictions are improved by the stratification of the area into two physiographic domains. These PMs are henceforth called PMs-2 and PMs-3, respectively. A set of 150 observations was randomly selected (seed = 123) from each subset and used to build the PMs. The same five predictor variables were used. The PMs were subjected 10-fold cross-validation using the complete datasets (165 and 174 observations) repeated 50 times, where the folds were randomly selected (seed=1234). On each occasion, after the predictions were back-transformed, the above statistics were calculated to evaluate PMs-2 and PMs-3.
RESULTS
Since 1 had a better performance than PMs-2 and PMs-3, only the former is shown (Table 1). The results show that clay and silt-size fractions increase with increasing ELEV while the sand-size fraction increases with increasing SLOPE, WET and CONV. Terrain attribute ELEV explains the largest proportion of variance (60 %), followed by the attribute SLOPE. Terrain attributes CONV and WET explained only a minor proportion of variance while CATCH_A was not used in PMs-1.
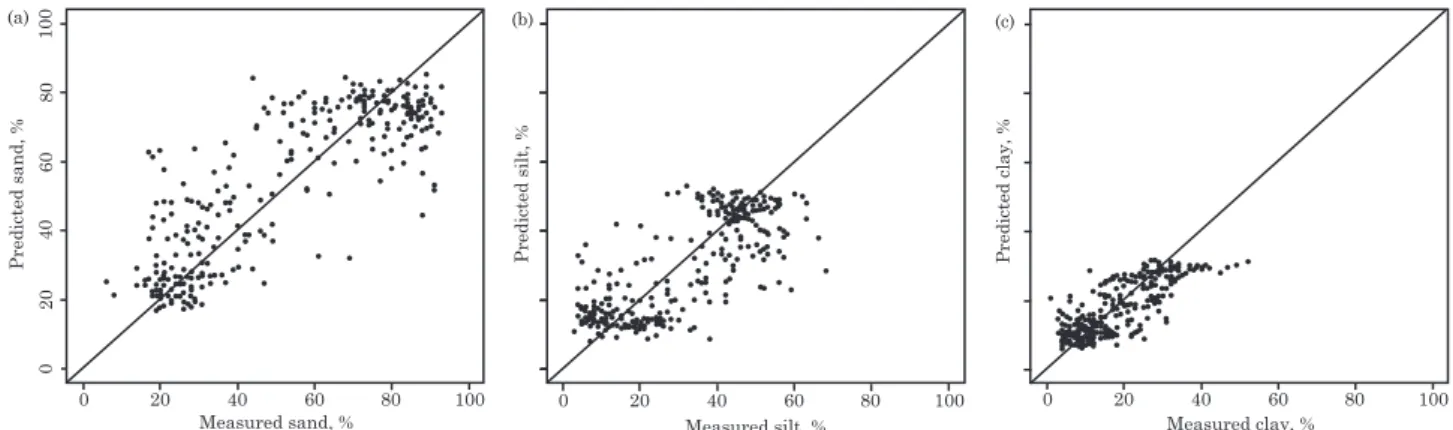
Cross-validation statistics showed that more than half of the variance was explained by PMs-1 (Table 2). Of the sand-size fraction, 70 % of the variance was explained, but only 55 % of the variance of the clay-size fraction. However, the prediction errors of the clay-size fraction represented only 13 % of the total range of the data. The prediction errors of the silt-size fraction were largest with almost 18 % of the total data range. In general, PMs-1 overpredicted the sand-size fraction, while the clay and silt-size fractions were underpredicted (comparison of the predicted with the measured values in figure 3). The point dispersion around the 1:1 line was high but more pronounced at intermediate values. Besides, the formation of two clusters was noted, which is closely related to the parent material of the soils (Figure 2).
and igneous rocks were mixed. Several discontinuities occurred in the parent material, markedly differentiating soil formation. The residuals were lowest at intermediate positions of both downslope and upslope domains.
When PMs were developed for each domain, all five terrain attributes were used. However, the performance was better in the upslope domain (Table 3). For downslope points, PMs-2 explained less than 15 % of the variance and the predictions were best for the sand size-fraction. For upslope points, PMs-3 explained almost 50 % of the clay size-fraction and 40 % of the sand size-fraction variance. The worst predictions were those based on the silt size-fraction. Table 4 shows the statistics of the PMs-1 performance in each domain. The statistics show that PMs-1 had
a better performance than PMs-2 and PMs-3 and that the performance was always better in the upslope.
DISCUSSION
Prediction of particle-size distribution
Ten Caten et al. (2011a) proved that PMs of soil classes can be developed in the Serra Geral region. Now it is known that it is also possible to build PMs of soil properties such as psd. The two factors of soil forming with major influence are parent material and topography. Parent material influence is reproduced by ELEV, since igneous rocks prevail in upslope and sedimentary rocks in downslope positions. Soils
Estimate Standard error t P
ln(clay/sand)
Intercept -1.0027474 0.8440731 -1.188 0.2358
ELEV 0.0081838 0.0003939 20.777 < 2e-16
SLOPE -0.0413414 0.0067446 -6.130 2.82e-09
WET -0.9702653 0.3397474 -2.856 0.0046
CONV -0.0107230 0.0047712 -2.247 0.0253
ln(silt/sand)
Intercept -0.9136230 0.9775466 -0.935 0.350755
ELEV 0.0090393 0.0004562 19.815 < 2e-16
SLOPE -0.0278960 0.0078111 -3.571 0.000415
CONV -0.0151896 0.0055256 -2.749 0.006348
WET -0.9682048 0.3934717 -2.461 0.014441
Table 1. Regression coefficients for predictive models PMs-1 built to predict the particle-size distribution (%) of the soils of the entire catchment
* ELEV: elevation (m), SLOPE: slope (%), WET: natural logarithm of topographic wetness index (dimensionless), CONV: convergence index (dimensionless).
Particle-size fraction Statistic(¹) 2.5 percentile Median 97.5 percentile
Sand RMSE (%) 14.33 14.43 14.55
NRMSE 0.165 0.166 0.167
Bias (%) 1.42 1.48 1.55
R²aj 0.744 0.748 0.752
Silt RMSE (%) 11.49 11.56 11.65
NRMSE 0.177 0.178 0.179
Bias (%) -1.14 -1.07 -1.03
R²aj 0.671 0.674 0.679
Clay RMSE (%) 6.61 6.65 6.70
NRMSE 0.130 0.130 0.131
Bias (%) -0.43 -0.40 -0.37
R²aj 0.546 0.551 0.555
Table 2. Cross-validation statistics (10-fold; 100 repetitions) for prediction of particle-size distribution based on application of the predictive models PMs-1
(1) RMSE: root mean square error, NRMSE: normalized RMSE, R²
derived from igneous rocks have a finer psd. Since ELEV explains the largest part of the variance, the influence of the parent material is stronger than that of the topography.
The possibility of developing PMs in the Serra Geral region is supported by the heterogeneity in the terrain attributes (Sumfleth & Duttmann, 2008). However, due to the highly variable nature of psd and the errors associated to the methods used it is unlikely to expect that multiple linear regression models could explain more than about 70 % of the variance (Moore et al., 1993). Even traditional soil maps (based on soil classes with sharp boundaries) usually explain only about half of the variance in soil attributes such as psd in a region (Webster & Oliver, 1990). Therefore, from the point of view of the pedometrician, the performance of the PMs built in this study can be considered satisfactory. However, the real usefulness of the PMs (and maps
produced) can only beevaluated by the user of soil
information, especially if soil mapping is to be user-driven (Basher, 1997). Besides, one must bear in mind that the statistics of the cross-validation procedure used here can be biased since the sampling locations were selected purposively (Brus et al., 2011).
F a c t o r s a f f e c t i n g p r e d i c t i v e m o d e l performance
Due to the complex geology of the Serra Geral region it was expected that stratification into two physiographic domains would improve PM performance. However, the results showed that this is not the case: the PMs developed separately for each domain had the worst performance. One possible reason for this inferior performance is the larger homogeneity of the terrain attributes due to the stratification (Sumfleth & Duttmann, 2008). However, the PMs performed differently in each domain. Predictions were always more accurate in the upslope domain. This suggests that the greater homogeneity of the terrain attributes is not the main factor affecting PM performance.
Actually, the upslope and downslope domains
Figure 3. Measured and predicted particle size-fractions using the predictive models PMs-1: (a) sand, (b) silt, and (c) clay.
100
80
60
40
20
0
0 20 40 60 80 100
Measured sand, %
Predicted sand, %
(a)
0 20 40 60 80 100
Predicted silt, %
Measured silt, % (b)
0 20 40 60 80 100
Predicted clay, %
Measured clay, % (c)
differed in the larger geologic homogeneity of the first. Igneous rocks prevail in upslope. Only small areas of soils derived from sandstone occur in its lower boundary. Besides, this physiographic domain is a more stable land surface. Under these conditions, the relation between psd and the terrain attributes is more evident, and PMs with a satisfactory performance from the pedometrician’s viewpoint can be constructed. On the other hand, the major part of the downslope domain is a younger land surface (depositional area) with greater geologic heterogeneity. Despite the mostly sedimentary origin of the parent materials, they belong to five types: aeolian sandstones (Botucatu Formation), fluvial sandstones (Caturrita Formation), colluviums of Botucatu and Serra Geral Formations, colluviums of Botucatu and Caturrita Formations, and recent fluvial deposits. Soils developed on colluviums and recent fluvial deposits are younger than those formed under the stable conditions of the upslope domain. Besides, soils developed on sandstones were strongly altered by the high erosion rates caused by the inadequate agricultural practices used in the region for several decades (Samuel-Rosa et al., 2011). As a result, the psd is poorly related with most terrain attributes. The performance of PMs built under these conditions cannot be expected to be better than of that in the present study.
Particle-size
Statistic(1) Downslope (PMs-2) Upslope (PMs-3)
2.5 percentile Median 97.5 percentile 2.5 percentile Median 97.5 percentile
Sand RMSE (%) 14.79 14.97 15.31 13.41 13.64 13.93
NRMSE 0.19 0.20 0.20 0.16 0.16 0.16
Bias (%) 2.10 2.19 2.44 0.21 0.32 0.43
R²aj 0.125 0.139 0.154 0.384 0.394 0.409
Silt RMSE (%) 10.58 10.72 10.97 11.26 11.38 11.62
NRMSE 0.19 0.19 0.20 0.18 0.18 0.18
Bias (%) -1.99 -1.82 -1.75 -0.07 0.11 0.25
R²aj 0.119 0.169 0.183 0.225 0.242 0.260
Clay RMSE (%) 5.12 5.16 5.28 7.57 7.66 7.82
NRMSE 0.18 0.18 0.19 0.15 0.15 0.15
Bias (%) -0.43 -0.37 -0.33 -0.56 -0.41 -0.33
R²aj 0.119 0.129 0.141 0.449 0.463 0.477
fraction
Table 3. Cross-validation statistics (10-fold; 50 repetitions) for prediction of particle-size distribution based on application of predictive models PMs-2 and PMs-3
(1) RMSE: root mean square error; NRMSE: normalized RMSE (dimensionless); Bias: bias or mean error; R²aj: adjusted coefficient of determination (dimensionless).
(a) (b) (c)
Figure 4. Quantiles of the kriged residuals of the particle-size distribution: (a) sand, (b) silt, and (c) clay, of the soils predicted using the predictive models PMs-1.
Particle-size
Statistic(1) Downslope Upslope
2.5 percentile Median 97.5 percentile 2.5 percentile Median 97.5 percentile
Sand RMSE (%) 15.57 16.48 18.36 14.02 20.46 23.31
NRMSE 0.20 0.22 0.24 0.16 0.24 0.27
Bias (%) 0.90 1.12 1.41 1.17 1.30 1.71
R²aj 0.155 0.163 0.169 0.537 0.545 0.553
Silt RMSE (%) 10.84 11.62 13.02 11.70 14.13 16.34
NRMSE 0.19 0.21 0.23 0.18 0.22 0.25
Bias (%) -1.00 -0.77 -0.62 -1.30 -1.07 -0.89
R²aj 0.143 0.152 0.159 0.366 0.375 0.383
Clay RMSE (%) 5.47 5.78 6.17 8.32 11.00 12.76
NRMSE 0.19 0.20 0.22 0.16 0.22 0.25
Bias (%) -0.44 -0.34 -0.27 -0.49 -0.29 -0.09
R²aj 0.157 0.163 0.169 0.240 0.246 0.249
fraction
Table 4. Cross-validation statistics (10-fold; 100 repetitions) for prediction of psd in downslope and upslope positions based on application of predictive models PMs-1
the psd varies less with varying ELEV. One possible reason for this behavior is that these sites are more similar in terms of physiographic features to the adjacent physiographic domains (the Planalto in the North and the Depressão Central in the South) than
to the SerraGeral itself.
Improving the predictions
The performance of the PMs developed in this study can be considered satisfactory form the point of view of pedometricians. However, is it satisfactory for users of the soil information? Unfortunately, this question cannot be answered yet, although it will have to be answered soon. Otherwise, digital soil mapping could be faced with the same problems as the conventional soil mapping approach, well-described in Basher,
1997, ‘Is pedology dead and buried?’. Although the
above question was not answered, it is believed that the predictions can be improved significantly. One alternative is to use nonlinear and more complex PMs, since the relation between soil properties and terrain attributes is not perfectly linear (Grunwald, 2006). However, this may result in building less generally applicable and thus less useful PMs (Gessler et al., 1996). Besides, more complex PMs are harder to develop and understand, which may lead to a lack of basic pedological and environmental interpretation of the results (Grunwald, 2009). An example is given by Park & Vlek (2002), who compared artificial neural networks, regression trees and generalized linear regression models to predict the silt-size fraction. The generalized linear models were chosen due to their structure simplicity, which allows a direct and easy interpretation of the relation between the soil properties and terrain attributes.
Another alternative is related to the predictor variables used to develop the PMs. Principal component regression was suggested by Ten Caten et al. (2011b) to reduce the number of predictor variables, although the authors argue that a loss in the predictive capacity of the PMs may occur. Besides, the result interpretation is very laborious. There is also the possibility of using more complex terrain attributes that describe the underlying physics of the processes that influence the psd (Moore et al., 1993; Böhner & Selige, 2006). However, the derivation of these complex attributes depends on land surface source data with high resolution and accuracy, which are not available for most of the Brazilian territory. Another alternative is to use predictor variables related to the other soil forming factors, mainly the parent material, which was the most important in determining the psd of the soils. However, the accuracy of the geologic maps available for the region is limited since they were based on the information contained in small-scale topographic maps. The more recent colluvial and fluvial deposits were not represented in these maps. Consequently, to improve the predictions of psd and other soil properties, accurate geologic and land-surface data are urgently needed.
CONCLUSIONS
1. Predictive models built on terrain attributes can be developed in regions with complex geology to estimate the psd of the soils. From the point of view of a pedometrician, their performance is considered satisfactory. However, the geologic complexity can reduce the predictive accuracy of the PMs for some of the particle-size fractions.
2. In geologically more homogenous areas, the terrain attributes are better correlated to the psd. However, stratifying the land surfaces according to the origin of the parent materials (sedimentary or igneous) does not ensure an improved PM performance. Improvements could be achieved using accurate geologic and land-surface data (not yet available).
3. Although the PM performance was satisfactory from the pedometrician’s viewpoint, no feedback from the potential users of the soil information was taken into consideration. These potential users should define quality standards to influence the soil information produced by pedometricians. Otherwise digital soil mapping may be affected by the same problems as the conventional soil mapping approach.
ACKNOWLEDGEMENTS
The authors are grateful to the National Council of Technological and Scientific Development/CNPq and the Brazilian Federal Agency for Support and Evaluation of Graduate Education/CAPES for the fellowships, and to BSc. (Agri) Jean Michel Moura Bueno and BSc. (Agri) Andrisa Balbinot for their help with the field and laboratory work.
LITERATURE CITED
AITCHISON, J. The statistical analysis of compositional data. London, Chapman & Hall, 1986. 416p.
BASHER, L.R. Is pedology dead and buried? Austr. J. Soil Res., 35:979-994, 1997.
BISHOP, T. & MINASNY, B. Digital soil-terrain modeling: the predictive potential and uncertainty. In: GRUNWALD, S., ed. Environmental soillandscape modeling -Geographic information technologies and pedometrics. Boca Raton, Taylor & Francis, 2006. p.185-213.
BÖHNER, J. & SELIGE, T. Spatial prediction of soil attributes using terrain analysis and climate regionalisation. In: BÖHNER, J.; McCLOY, K. & STROBL, J., eds. SAGA -Analysis and modelling applications. Göttingen, Göttinger Geographische Abhandlungen, 2006. p.13-28.
DELIGNETTE-MULLER, M.L.; POUILLOT, R.; DENIS, J.-B. & DUTANG, C. Fitdistrplus: Help to fit of a parametric distribution to non-censored or censored data. R package version 0.1-2010. Available at: <http://CRAN.R-project.org/ package=fitdistrplus>.
EMPRESA BRASILEIRA DE PESQUISA AGROPECUÁRIA -EMBRAPA. Handbook of methods of soil analysis. 2.ed. Rio de Janeiro, Centro Nacional de Pesquisa de Solos, 1997. 212p.
FILZMOSER, P. & VARMUZA, K. Chemometrics: Multivariate statistical analysis in chemometrics. 2011. R package version 1.3.8. Available at: <http://CRAN.R-project.org/ package=chemometrics>.
GESSLER, P.E.; MOORE, I.D.; McKENZIE, N.J. & RYAN, P.J. Soil-landscape modelling and spatial prediction of soil attributes. Inter. J. Geogr. Inf. Syst., 9:421-432, 1995.
GESSLER, P.; McKENZIE, N. & HUTCHINSON, M. Progress in soil-landscape modeling and spatial prediction of soil attributes for environmental models. In: INTERNATIONAL CONFERENCE/WORKSHOP ON INTEGRATING GIS AND ENVIRONMENTAL MODELING, 3., Santa Fe, New Mexico, 1996. Proceedings… Santa Barbara, U.S. National Center for Geographic Information and Analysis, 1996.
GRUNWALD, S. Multi-criteria characterization of recent digital soil mapping and modeling approaches. Geoderma, 152:195-207, 2009.
GRUNWALD, S. What do we really know about the space– time continuum of soil-landscapes? In: GRUNWALD, S., ed. Environmental soil-landscape modeling - geographic information technologies and pedometrics. Boca Raton, Taylor & Francis, 2006. p.3-36.
HUTCHINSON, M.F. A locally adaptive approach to the interpolation of digital elevation models. In: INTERNATIONAL CONFERENCE/WORKSHOP ON INTEGRATING GIS AND ENVIRONMENTAL MODELING, 3., Santa Fe, New Mexico, 1996. Proceedings… Santa Barbara, U.S. National Center for Geographic Information and Analysis, 1996.
MALUF, J. A new climatic classification for the state of Rio Grande do Sul, Brazil. R. Bras. Agrometeorol., 8:141-150, 2000.
McBRATNEY, A.; MENDONÇA-SANTOS, M. & MINASNY, B. On digital soil mapping. Geoderma, 117:3-52, 2003. McKENZIE, N.; GESSLER, P.E.; RYAN, P.J. & O’CONNELL,
D. The role of terrain analysis in soil mapping. In: WILSON, J. & GALLANT, J., eds. Terrain analysis: Principles and applications. New York, John Wiley & Sons, 2000. p.245-266.
MIGUEL, P. Pedological characterization, land use and modeling of the soil loss in hillslope areas the Plateau Border of RS. Santa Maria, Universidade Federal de Santa Maria, 2010. 112p. (Dissertação de Mestrado)
MOORE, I.D.; GESSLER, P.E.; NIELSEN, G.A. & PETERSON, G.A. Soil attribute prediction using terrain analysis. Soil Sci. Soc. Am. J., 57:443-452, 1993.
PARK, S. & VLEK, P. Environmental correlation of three-dimensional soil spatial variability: A comparison of three adaptive techniques. Geoderma, 109:117-140, 2002. PINHEIRO, R.J. & SOARES, J.M. Condicionantes
geológicos-geotécnicos de movimentos de massa na encosta da Serra Geral - RS. Teor. Prática Eng. Civ., 4:59-68, 2004. R DEVELOPMENT CORE TEAM. R: A language and
environment for statistical computing. 2011.
SAMUEL-ROSA, A.; MIGUEL, P.; DALMOLIN, R.S.D. & PEDRON, F.A. Uso da terra no Rebordo do Planalto do Rio Grande do Sul. Ci. Nat., 33:161-173, 2011.
SARTORI, P. Geologia e geomorfologia de Santa Maria. Ci. Amb., 38:19-42, 2009.
SUMFLETH, K. & DUTTMANN, R. Prediction of soil property distribution in paddy soil landscapes using terrain data and satellite information as indicators. Ecol. Indic., 8:485-501, 2008. TEN CATEN, A.; DALMOLIN, R.S.D.; PEDRON, F.A. & MENDONÇA-SANTOS, M.L. Multiple logistic regressions: Controlling factors in applications to soil class prediction. R. Bras. Ci.. Solo, 35:53-62, 2011a.
TEN CATEN, A.; DALMOLIN, R.S.D.; PEDRON, F.A. & MENDONÇA-SANTOS, M.L. Principal components as predictor variables in digital mapping of soil classes. Ci. Rural, 41:1170-1176, 2011b.