O
R
I
G
I
N
A
L
A
R
T
I
C
L
E
Effect of shrimp shells milling on the molar
mass of chitosan
Helton José Alves
1*, Maristela Furman
1, Cristie Luis Kugelmeier
1, Clayton Rodrigues de Oliveira
2,
Vanessa Rossato Bach
1, Karine Natani Lupatini
1, Andressa Caroline Neves
1and Mabel Karina Arantes
11
Laboratory of Catalysis and Biofuel Production – LabCatProBio, Universidade Federal do Paraná – UFPR,
Palotina, PR, Brazil
2
Department of Chemistry – DQ, Universidade Federal de São Carlos – UFSCar, São Carlos, SP, Brazil
Abstract
Shrimp shells are a raw material rich in chitin, a precursor of chitosan biopolymer. The variables of processing (demineralization, deproteination and deacetylation) can be manipulated to determine the main characteristics of chitosan, the degree of deacetylation (DD), and average molar mass. This study evaluated the inluence of one of the unit operations of shrimp shell physical processing, the milling, on the inal product characteristic, chitosan. After different milling conditions, the raw material was subjected to standard chemical processing for chitin extraction, followed by deacetylation to obtain chitosan, which is characterized by 1H NMR, SEM, XRD, N
2 physisorption (BET) and viscometry. The results indicated that the milling time of the raw material can be manipulated to increase the material depolymerization, signiicantly inluencing the molecular weight reduction of chitosan a desirable feature for many applications of this biopolymer, and usually obtained by complex chemical and enzymatic methods.
Keywords: biopolymers, chitosan, degree of polymerization (DP), viscosity, particle size distribution.
1. Introduction
When researching the reduction of the molecular weight of polymers or biopolymers, many studies seek to employ chemical and enzymatic methods, but less attention is given to physical methods. In a previous work, our group evaluated the influence of different drying routes over depolymerization and properties of the biopolymer chitosan (2-amino-2-deoxy-D-glucose and 2-acetamido-2-deoxy-D-glucose copolymer)[1]. The results indicated that the physical drying process may decisively affect the molar mass of the biopolymer, and the drying of chitosan with supercritical CO2 (SAS) was reduced more than 10 times its molar mass (from 35.3 to 3.0 kDa). Although changes were not observed in the chemical properties of the material, drying with supercritical CO2 caused an increased degree of crystallinity and crystallite size, as well as a significant change in the textural properties, resulting in values of specific area and much higher pore volume.
In the case of depolymerization of chitini
*
and chitosan, the most recent studies described in the literature suggest the following methods:
- Chitosan: oxidative degradation by catalysts with peroxide active sites (for example, W (O2)) leading to a depolymerization rate higher than 90%[2]; depolymerization by a plasma treatment solution applied to the metal-chitosan complex allowed to obtain oligomers (in order of 103 Da); however, the technical
*
i Chitin: a linear polymer predominantly made of (1-4)-ᵦ linked
2-acetamido-2-deoxy-D-glucose, estimated to be the second most abundant natural polymer after cellulose. It is isolated from shrimp waste by demineralization and deproteination of shells.
efficiency varied with the complexed metal[3]. The use of enzymes such as lysozyme or celullase caused depolymerization, but the enzyme activity varies even with the deacetylation degree[4]. Ultraviolet-irradiated oxygen treatment applied to a chitosan solution (slightly acidic) gave the molar mass reduction up to seven times after 300 min of reaction[5]; use of gamma radiation, proposed as depolymerization chitosan mechanism; however, the darkening of the material is a problem inherent to this method, leading to studies that can inhibit an occurrence such as pH control and O2[6];
- Chitin: gamma radiation and combining enzymatic hydrolysis where the partial depolymerization of chitin through radiation promotes accessibility to enzymatic peroxide active sites so that the following processes lead to obtaining oligomers and even monomers[7]. Using high concentrations of inorganic acid (HCl 3-12M) under average temperatures allowed chitin degradation in short term experiments[8].
When a particulate solid material is milled in a ball mill, for example, there are mainly two types of combined actions that are responsible for the particles’ shearing of the material: impact and abrasion. In the first case, the fracture occurs when force is applied quickly and the intensity is greater than the particle strength in areas (area A in Figure 1) where the grinding elements (balls/beads) roll down by force of gravity during the rotation of the pitcher, forming a kind of cascade. The second mechanism is the attrition existing between the grinding elements and the particles of the material during the movement of the balls on the other in concentric layers (Zone B in Figure 1), resulting in small fractures. When reaching the critical speed the balls can achieve the highest point of the mill without detaching the wall. Above the critical velocity, it is possible to observe the cataract effect, as shown in Zone C of Figure 1[12].
Computer simulations that considered the effect of milling time on the split of the polymer chains, taking into account the bonds around it, were studied by Cook and Mercer[13]. By using experimental data from van der Hoff and Chopra in their deduced equations, the author found that the milling time is the most important parameter that influences the average molar mass of the polymer during this unit operation. Its kinetic study showed that the increase in milling time causes an increase in the number of disruptions in the polymer chains, which is proven by the reduction of the average molar mass[9].
In research performed by Delezuk et al.[14] with the β chitin, ultrasound irradiation was used to promote chitin deacetylation starting from the assumption that when macromolecule solutions are exposed to ultrasound irradiation, their viscosity decreases as a result of depolymerization processes. In the case of the production of chitosan, depolymerization increases the reactive sites accessibility on the polymer chain, increasing the reaction efficiency. In a later work with β chitin[15], a selection of particle size of the material was performed, and each fraction obtained was evaluated as to molar mass and average degree of chitin deacetylation (DD), leading to the understanding that these two parameters suffer changes during grinding, and to the observation that as the particle size gets smaller, the crystallinity and molar mass of chitin are smaller.
In this work, we evaluated the effect of another physical stage of obtaining chitosan process, the milling, over their molar mass. However, unlike other studies assessing the influence of grinding on the molecular weight of a polymer, compared with the original, in this case, the polymer
is submitted to chemical transformation to become the product of interest and then the evaluation is carried out. It is to show how some milling parameters of shrimp shells, raw materials for the production of biopolymer chitosan, interfere with the viscosimetric molar mass of the final product of chemical processing—the chitosan. Besides the milling time, another variable selected for this initial study was the “grinding elements size” that is added into the ball mill, being fixed the other variables encountered during the material processing.
2. Materials and Methods
2.1 Cleaning of shrimp shells
The shrimp shells used in this study were obtained after the harvest of marine shrimp from the Parana State coast (Brazil). The shells remained in the freezer at –10 °C until use. They were washed in running water to remove the excess organic material (meat, eggs, etc.) and dried at 60 °C for 24 h.
2.2 Milling
After complete drying, the shells were ground for 60 seconds in a blender, and then fractionated to compose six samples (M1, M2, M3, M4, M5, M6) to be ground in different ways for this work. For milling, a laboratory ball mill (Solab) was used, with the rotation of 300 rpm, composed by a jar of 14 cm in diameter and 20 cm in length, with the ball charge fixed at approximately 1400 g and the sample mass to be milled around 30 g. There were three different milling times (30, 90 and 180 min), and two compositions of different sizes of porcelain balls (Composition A: 100% wt. of balls with 20 mm; Composition B: 70% wt. of balls with 20 mm + 30% wt. of balls with 15 mm) were chosen. Thus, each time, two compositions were tested in different balls, as can be seen in Table 1. After the grinding stage each powdery sample was sieved individually using a series of three stacked sieves with openings of 106, 63 and 43 µm, and then shaken in a sieve shaker for 10 min for the granulometry selection.
2.3 Chitin extraction
The samples were submitted to a demineralization process of three washes (15 min each) with HCl solution of 0.55 mol.L-1, under agitation. After rinsing them to neutral pH, we proceeded to deproteination with three washes (20 min each) with NaOH solution 0,3 mol.L-1, under agitation and 80 °C, followed by washing to neutral pH.
2.4 Obtaining chitosan
After deproteination, the chitin samples were still wet, subjected to solutions of NaOH 60% (w.V-1) under stirring of 125 rpm in a rotary incubator at 27-30 °C for 172 h. Then the material was washed with distilled water under vacuum filtration to neutral pH and dried in an electric oven at 60 °C for 24 h, finally obtaining the chitosan.
2.5 Chitosan characterization
Absolute density and particle size distribution (PSD): the absolute density of chitosan (sample M1) was determined by helium pycnometry (Quantachrome Ultrapycnometer Figure 1. A schematic diagram of a tubular ball mill. The balls
1000), to be used in determining the PSD. Chitosan samples (M1 to M6) were subjected to the X-ray sedimentometry test (Sedigraph Model 5000 D, Micromeritics) to obtain the PSDs.
Specific area (BET): The analyses of N2 adsorption (physisorption) were performed at a temperature of –196 °C (Quantachrome Co. Nova-2000). The samples were previously treated at 150 °C for 4 hours. The specific area was determined by BET equation (Brunauer, Emmett and Teller), using p/p0 ≤ 0.3[17].
X-ray diffractometry: X-ray diffractometry was performed at a range of 5° < 2Ө < 40°, with CuKα radiation (λ = 1.54 Å, 45 kV, 25 mA) and a speed of 1o.min-1, in a Rigaku Geingerflex diffractometer[18], allowing the evaluation of the crystallinity of the chitosan samples and also the diameter of the crystallites, by applying Scherrer’s equation (Equation 1)[19]:
0cos
ap
K
D = λ
β θ (1)
where, Dap is the average diameter of the crystallite (Å) in a perpendicular direction to the plane (110); β0 corresponds to the width of the peak referring to the main signal of the crystalline regions, and to the intensity of half-height (radians); K is a constant; θ corresponds to half of Bragg’s angle of the most intense signal (radians); and λ is the wavelength of radiation employed (Å).
Molar mass viscosimetric: Molar mass viscosimetric was obtained as the intrinsic viscosity chitosan solutions (in 0.3 M HAc/0.2 M NaAc) using a Ubbelohde Dilution Viscosimeter (Cannon Instrument Co., USA) that has a capillary size of 0.44 mm in a water bath at 25 °C. The relation between the intrinsic viscosity, [η], and the average viscosimetric molecular weight of the polymer, MV, is established by the equation of Mark-Houwink-Sakurada (
[ ]
K MVα η = ) where K and α are constants for a given polymer-solvent system, which in the case of chitosan, varies according to the degree of acetylation (DA)[16].
Chitin extraction was confirmed by determining the rates of demineralization and deproteination, and the average degree of acetylation of chitosan was obtained by 1H NMR,
using a Bruker Avance III spectrometer and 9.4 Tesla, in the following experimental conditions: 400 MHz for hydrogen frequency (SWH), experimental temperature of 323 K, 16 scans (ns), wait time of 10 s (d1), acquisition time of 6.83 s (aq), and 65,536 data points (td). The %DA and %DD were calculated as described by Santos et al.[20].
3. Results and Discussions
3.1 Particle size distribution of shrimp shells after milling
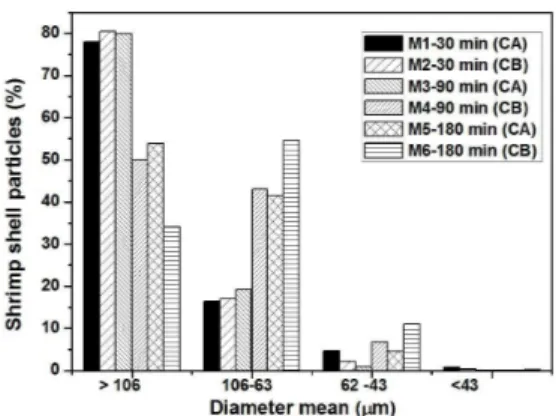
Figure 2 shows the particle size distribution for shrimp shells after milling under different times. Note that as the milling time increased, there was an overall significant reduction of the particle sizes. The increase in M3’s milling time (90 min) did not contribute to the reduction of particle size in relation to M1 or M2 (30 min).
When comparing the compositions M1, M3 and M5 with M2, M4 and M6, it appears that the latter have a content of particles with an average diameter Ø reduced (< 106 µm) much higher, particularly for milling times of 90 and 180 min. Observing the result set, this trend is evident when comparing the M3 and M4 compositions (90 min) where M3 has Ø equal to 21%, while M4 has the value of 50%.
This can be explained by the fact that the load balls and their diameter can decisively influence the material particle size distribution, and balls are typically larger and heavier, favoring the shear mainly by impact. The use of smaller balls reduces the empty spaces between the milling elements increasing the friction between the balls and the particles.
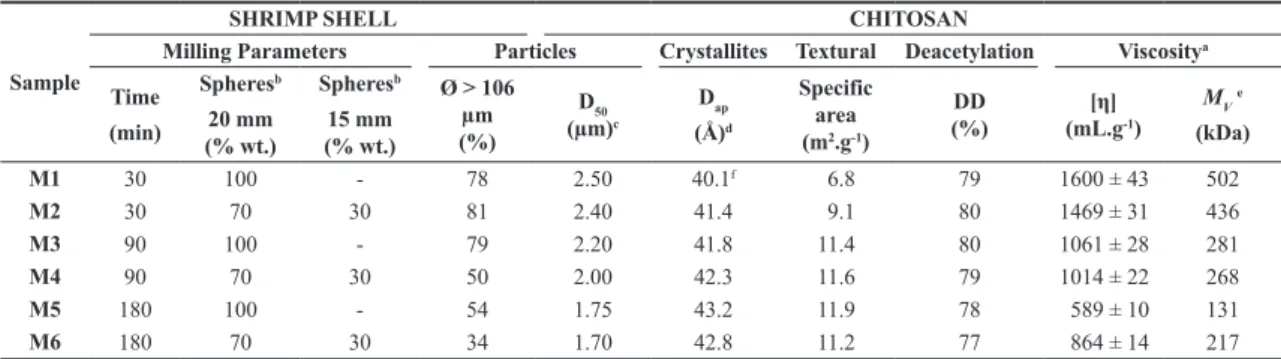
It is worth noting in this case that the shrimp shells are not exclusively composed of chitin, but are typically also found minerals calcium, magnesium and phosphorus associated, which in turn are comminuted along with the biopolymer and protein residues, which may not have been eliminated during the washing stage. Note also that the common process of the preparation of chitin (kiln drying after deproteination, then disintegration in mortar and pestle for subsequent deacetylation) was not used in this work in order to avoid the interference of the physical processes of particle aggregation and disaggregation; this could compromise the results, and undermine the interpretation of them. Thus, it Table 1. Milling conditions and physicochemical properties of samples.
Sample
SHRIMP SHELL CHITOSAN
Milling Parameters Particles Crystallites Textural Deacetylation Viscositya
Time
(min)
Spheresb
20 mm (% wt.)
Spheresb
15 mm (% wt.)
Ø > 106 µm (%)
D50 (µm)c
Dap
(Å)d
Specific area (m2.g-1)
DD (%)
[η] (mL.g-1)
M
V
e
(kDa)
M1 30 100 - 78 2.50 40.1f 6.8 79 1600 ± 43 502
M2 30 70 30 81 2.40 41.4 9.1 80 1469 ± 31 436
M3 90 100 - 79 2.20 41.8 11.4 80 1061 ± 28 281
M4 90 70 30 50 2.00 42.3 11.6 79 1014 ± 22 268
M5 180 100 - 54 1.75 43.2 11.9 78 589 ± 10 131
M6 180 70 30 34 1.70 42.8 11.2 77 864 ± 14 217
a K= 0.074 and α = 0.76 (solvent 0.3M HAc / 0.2M NaAc, at 25 °C)[16]; b The total charge of balls was 1390 ± 2.0 g; c The absolute density value determined by Helium pycnometry, and used in X-ray sedimentometry is 1.5454 g.cm-1; d The calculation was based on the data of the main peak
at 2θ = 19.350; e Calculating M
V was determined using the average value of [η];
f For M1, was chosen the crystalline peak of greatest intensity
can be said that the only variable that distinguishes samples M1 to M6 is the milling of shrimp shells.
3.2 Particle Size Distribution (PSD)
The distribution curve of particle sizes (PSD) of samples M1 to M6, obtained by X-ray sedimentometry, is found in Figure 3. In general, curves with a similar inclination are observed, indicating that the PSD is similar between the samples. There were no significant differences when different compositions of the milling balls were used. However, the positioning of a given curve to the left indicates a more effective milling that result in finer particles, as in the case of M5 and M6. From these curves were extracted the D50 values, as shown in Table 1, which are a statistical parameter representing the average particle diameter when the cumulative mass is 50%. Therefore, larger D50 values indicate that the PSD curves have shifted more to the right in Figure 3, which is associated with a less effective milling of the material (M1 and M2), resulting in coarser particles.
Overall, it can be said that the effect caused by using balls of different sizes compositions was higher on the milling of shrimp shells (Figure 2), than on the properties of chitosan particles (Figure 3).
3.3 Specific area (BET)
The results of N2 physisorption corroborate those obtained by X-ray sedimentometry, since they indicate an increase in the specific area of the chitosan samples according to the milling time increase, which is associated with the reduction of particle size. With the increase of milling time from 30 min to 180 min, the specific area nearly doubled, from 6.8 m2.g-1 in M1 to 11.9 m2.g1 in M5. Significant differences were not observed for the use of different compositions of balls.
However, after 90 minutes of grinding, the specific area of the particles of chitosan does not vary significantly. For milling times of 90 and 180 min were not observed differences in the specific area values between the compositions of spheres A and B employed. This may indicate that after the significant reduction of the particle size of shrimp shell up to 30 minutes milling, the use of smaller spheres (composition B) is not able to change significantly the surface characteristics of the particles so as to modify the specific area of chitosan.
3.4 Degree of deacetylation (DD)
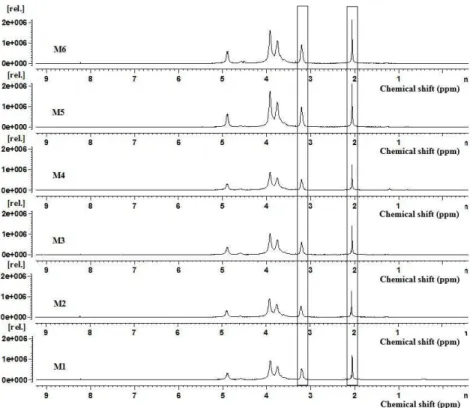
The method used in this work to promote the chitin deacetylation has been tested in our laboratory in order to obtain chitosan with higher deacetylation without heating or reflux and with experimental apparatuses that are not easily scalable. In an earlier work[1], when using reflux for 10 hours at 100 °C in 50% of NaOH solution, chitosan was obtained whose DD ranged between 95 and 97%. When performing the adaptation for this simplified method and stirring under room temperature, DD values obtained by 1H NMR (Figure 4) located between 77 and 80% (Table 1) demonstrate the viability of this method when the DD range is suitable for the intended purpose of chitosan produced.
Also noteworthy is that from the results shown, the variations employed in the shrimp shells milling process
did not cause significant differences in the deacetylation reactions, although they have been identified as able to reduce the viscosimetric molecular weight, indicating biopolymer degradation[14]. It was expected that the depolymerization would be accompanied by increasing deacetylation to increase the accessibility of reaction sites, but this was not observed.
Another observation concerning the employed deacetylation method is that it can be used when minimizing the polymer degradation during the deacetylation is desired. While the molar mass of chitosan obtained by refluxing (10h, 100 °C) in our studies is very low (about 30 kDa), in this method, the largest value obtained was about 500 kDa.
3.5 X-ray diffraction and apparent crystallites diameter (Dap)
It is noted that in Figure 5 the chitosan samples have typical diffractograms of a semi-crystalline material with crystalline major peaks at 2θ ≈ 10° and 20°. The peak at 10° is assigned to the reflections of the planes (010), derived from the α-chitin structure (orthorhombic crystals of nature), since the asymmetric peak at 20° is associated with the planes (010) and (020).
Sample M1 has a diffraction pattern that is distinct from the others, because the crystalline peak at 10° is more intense than at 20°. As the milling time increases, Figure 2. Particle size distribution of shrimp shells milled into ball mill under different conditions (CA: composition A; CB: composition B).
a significant decrease of peak intensity at 10° is observed for all samples, suggesting the preferential progressive destruction of the crystal planes (010). At the same time, there is a less pronounced increase in intensity at 20°. These changes are most marked for Composition A (M1, M3 and M5), which may indicate that the impact milling has a greater effect on the destruction of the planes (010), as can be seen in Figure 5a.
It is worth mentioning that when analyzing the group of diffractograms of Figure 5, we can affirm that with increasing milling time, the crystallinity of the chitosan generally decreases, which is according to literature[21].
In Table 1, the apparent diameter values of the crystallites (Dap) can be verified. It is worth mentioning that given the partially amorphous character of chitosan, observed in the diffractograms of Figure 5, the determination of the crystalline peaks’ baseline used to determine the values of β0 in the equation of Scherrer (Equation 1) may lead to a small deviation of the estimated values, which in turn varied between 40.1 and 43.2 Å.
However, some observations are pertinent:
i) The lower Dap values for M1 and M3, when compared to M2 and M4, respectively, may be explained by the fact that when using Composition A (balls of the same size), the impact generated in the particles is more effective, which may result in crystallites with smaller diameters; the segments in molecular crystalline domains are broken by splits into a greater number of biopolymer chains.
Figure 4. 1H NMR spectra of samples M1, M2, M3, M4, M5 and M6. The solid lines in the regions of 3.30 to 3.10 ppm and of 2.08 to 2.00 ppm refer to the hydrogens of the amino and acetyl groups, respectively.
ii) The M5 and M6 samples have similar values with each other for both D50 and for Dap. If compared with the other samples, the D50 values are lower due to the effective reduction of the shell particle size with the grinding time advance. In contrast, there was not such a significant change in Dap values of chitosan. This suggests that after 90 min the increase of Dap is less pronounced.
3.6 Viscosimetric molar mass (MV)
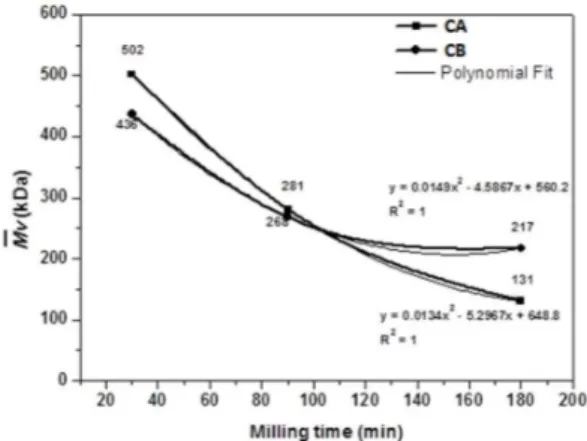
The results in Figure 6 and Table 1 reveal that as the milling time of shrimp shells increases, the molar mass of the chitosan decreases significantly, independent of the composition of balls used. Note that between the milling time of 30 and 180 min, the viscosimetric molar mass decreases almost four times, from 502 kDa to 131 kDa. The polynomial equations of the second degree are those that best describe the observed behavior: Composition A y = 0.0134x2 – 5.2967x + 648.8 and Composition B: y = 0.0149x2 – 4.5867x + 560.2. Note that the quadratic equations are very similar, and therefore, they have the same trend.
Although it was not done in this work the milling of chitosan to evaluate the reduction of its molar mass, but the milling of shrimp shells, it is known that chitin is chemically very similar to chitosan, and in this case, any changes made in the chitin structure can potentially be observed in the chitosan, so that the results of molar mass reduction of chitosan are agree with those found in previous studies[9,14]. Thus one can say that the processing stages of chitin to obtain chitosan, subsequent to milling, acted in the same manner over the material which shows que the only variable analyzed actually was the milling time.
4. Conclusions
It may be concluded that milling is a stage of processing the shrimp shell, which significantly reduces the average molar mass of chitosan (nearly four times in the range of 30 to 180 min of milling). With the exception of reducing the particle size followed by an increase of the specific
area and decreased crystallinity, the other properties of the chitosan did not vary as significantly as the crystallites size and degree of deacetylation.
The diameter of the balls used in the milling of shrimp shells can decisively influence the particle size distribution of the material, directly affecting the size distribution of particles of chitosan. When a composition containing 30% undersize milling balls was evaluated, the result was the reduction of particle size of shell and chitosan, due to reduced voids between the grinding elements and the increased friction between the balls and the particles.
The milling time of shrimp shells can be used in a manner associated with the drying of chitosan to obtain a product with low molar mass. Both deal with physical processes (unit operations) already employed in the traditional route from chitosan production, and can possibly replace partially or totally other more sophisticated and expensive technologies (enzymes, irradiation, etc.), if they are well designed and controlled.
5. References
1. Arantes, M. K., Kugelmeier, C. L., Cardozo-Filho, L., Monteiro, M. R., Oliveira, C. R., & Alves, H. J. (2015). Influence of the drying route on the depolymerization and properties of chitosan.
Polymer Engineering and Science, 55(9), 1969-1976. http:// dx.doi.org/10.1002/pen.24038.
2. Ma, Z., Wang, W., Wu, Y., He, Y., & Wu, T. (2014). Oxidative degradation of chitosan to the low molecular water-soluble chitosan over peroxotungstate as chemical scissors. PLoS One,
9(6), e100743. PMid:24971631. http://dx.doi.org/10.1371/ journal.pone.0100743.
3. Pornsunthorntawee, O., Katepetch, C., Vanichvattanadecha, C., Saito, N., & Rujiravanit, R. (2014). Depolymerization of chitosan-metal complexes via a solution plasma technique.
Carbohydrate Polymers, 102, 504-512. PMid:24507312. http:// dx.doi.org/10.1016/j.carbpol.2013.11.025.
4. Jung, J., & Zhao, Y. (2011). Characteristics of deacetylation and depolymerization of ß-chitin from jumbo squid (Dosidicus gigas) pens. Carbohydrate Research, 346(13), 1876-1884. PMid:21700271. http://dx.doi.org/10.1016/j.carres.2011.05.021. 5. Yue, W., Yao, P., & Wei, Y. (2009). Influence of
ultraviotel-irradiated oxygen on depolymerization of chitosan. Polymer Degradation & Stability, 94(5), 851-858. http://dx.doi. org/10.1016/j.polymdegradstab.2009.01.023.
6. Yue, W. (2014). Prevention of browning of depolymerized chitosan obtained by gamma irradiation. Carbohydrate Polymers,
101, 857-863. PMid:24299848. http://dx.doi.org/10.1016/j. carbpol.2013.10.011.
7. Dziril, M., Grib, H., Laribi-Habchi, H., Drouiche, N., Abdi, A., Lounici, H., Pauss, A., & Mameri, N. (2015). Chitin oligomers and monomers production by coupling g radiation and enzymatic hydrolysis. Journal of Industrial and Engineering Chemistry,
26, 396-401. http://dx.doi.org/10.1016/j.jiec.2014.12.015. 8. Einbu, A., & Varum, K. M. (2007). Depolymerization and
de-N-acetylation of chitin oligomers in hydrochloric acid.
Biomacromolecules, 8(1), 309-314. PMid:17206822. http:// dx.doi.org/10.1021/bm0608535.
9. Brostow, W., & Corneliussen, R. D. (1986). Kinetics of milling of polymers. Materials Chemistry and Physics, 14(1), 1-8. http://dx.doi.org/10.1016/0254-0584(86)90013-1.
10. Sánchez-Jiménez, P. E., Pérez-Maqueda, L. A., Perejón, A., & Criado, J. M. (2010). A new model for the kinetic analysis of thermal degradation of polymers driven random scission. Figure 6. Variation Mv of the chitosan samples as a function of
Polymer Degradation & Stability, 95(5), 733-739. http://dx.doi. org/10.1016/j.polymdegradstab.2010.02.017.
11. Bressy, C., Ngo, V. G., & Margaillan, A. (2013). A first insight into the thermal degradation mechanism of silylated methacrylic homopolymers synthesized via the RAFT process.
Polymer Degradation & Stability, 98(1), 115-121. http://dx.doi. org/10.1016/j.polymdegradstab.2012.10.023.
12. Loh, Z. H., Samanta, A. K., & Sia Heng, P. W. (2015). Overview of milling techniques for improving the solubility of poorly water-soluble drugs. Asian Journal of Pharmaceutical Sciences,
10(4), 255-274. http://dx.doi.org/10.1016/j.ajps.2014.12.006. 13. Cook, R., & Mercer, M. B. (1985). Dynamic overstresses in fibrous polymeric materials. Materials Chemistry and Physics,
12(6), 571-580. http://dx.doi.org/10.1016/0254-0584(85)90043-4.
14. Delezuk, J. A. M., Cardoso, M. B., Domard, A., & Campana-Filho, S. P. (2011). Ultrasound-assisted deacetylation of beta-chitin: influence of processing parameters. Polymer International,
60(6), 903-909. http://dx.doi.org/10.1002/pi.3037. 15. Delezuk, J. A. M. (2013). Chitosan production with controlled
characteristics using high intensity ultrasound irradiation
[Doctoral thesis]. University of São Paulo, São Carlos. 16. Kasaai, M. R. (2007). Calculation of Mark-Houwink-Sakurada
(MHS) equation viscometric constants for chitosan in any solvent-temperature system using experimental reported
viscosimetric constants data. Carbohydrate Polymers, 68(3), 477-488. http://dx.doi.org/10.1016/j.carbpol.2006.11.006. 17. Brunauer, S., Emmett, P. H., & Teller, E. (1938). Adsorption
of gases in multimolecular layers. Journal of the American Chemical Society, 60(2), 309-319. http://dx.doi.org/10.1021/ ja01269a023.
18. Boz, N., Degirmenbasi, N., & Kalyon, D. M. (2009). Conversion of biomass to fuel: transesterification of vegetable oil to biodiesel using KF loaded nano-g-Al2O3 as catalyst. Applied
Catalysis B: Environmental, 89(3-4), 590-596. http://dx.doi. org/10.1016/j.apcatb.2009.01.026.
19. Muzzarelli, A. A. (1985). Chitin. In H. F. Mark, N. M. Bikales, C. G. Overberger & G. Menges (Eds.). Encyclopedia of polymers science engineering. New York: John Wiley. 430 p. 20. Santos, J. E., Soares, J. P., Dockal, E. R., & Campana-Filho, S.
(2003). Caracterização de quitosanas comercias de diferentes origens. Polímeros: Ciência e Tecnologia, 13(4), 242-249. http://dx.doi.org/10.1590/S0104-14282003000400009. 21. Perrin-Sarazin, F., Sepehr, M., Bouaricha, S., & Denault, J.
(2009). Potential of ball milling to improve clay dispersion in nanocomposites. Polymer Engineering and Science, 49(4), 651-665. http://dx.doi.org/10.1002/pen.21295.