Influence of Bed Ash and Fly Ash Replacement in Mortars
S. L. Summoogum-Utchanah
1*, R. Rughooputh
2, R. Oochit
11
Chemical and Environmental Engineering Department, University of Mauritius, Reduit, Mauritius
2
Civil Engineering Department, University of Mauritius, Reduit, Mauritius
ABSTRACT
The study evaluates the influence of fly ash and bottom ash as partial cement substitutes in mortars by studying the particle size distribution, consistency, flow, fresh density, air content, compressive strength and flexural strength characteristics. The results revealed that fly ash and cement had relatively the same particle size distribution unlike bottom ash. In the fresh state, as the amount of pozzolans increased in the mixtures, the mortars showed an enhancement in workability, were susceptible to water loss by bleeding, and exhibited a decline in fresh density. The early strength gains of the fly ash samples were low but reached higher than the control after 28 days of curing. The flexural strength increased as the fly ash content rose to reach a maximum at 20 % replacement. However, the 2-day compressive strength of bottom ash samples was higher than the control but decreased after 28 days of curing while the flexural strength declined with addition of bottom ash except at 5 % substitution.
Keywords
- Fly ash, Bottom ash, Mortars, Compressive strength, Flexural strengthI.
INTRODUCTION
Mortar is a mixture of sand, cement or lime and water which is used in the binding of masonry blocks of stone, brick and blocks [1]. The knowledge about the fresh and hardened characteristics of mortar is essential to ensure a good stress distribution in masonry walls. Water to cement ratio and aggregate grading are among several variables that influence physical and mechanical behavior of mortars [2]. Mortar prepared from Ordinary Portland Cement has been a very widespread construction material. However, it has some disadvantages such as late hardening, low tensile strength, large drying shrinkage and low chemical resistance [3]. Many attempts are being made to eliminate these drawbacks, such as the partial replacement of cement by fly ash (FA) and bottom ash (BA) which are residues from the combustion of coal.
The physical properties and the chemicals namely arsenic, mercury, lead, and over a dozen of other heavy metals present in coal ash are responsible for their potential threats [4-6]. Likewise, fine particulate coal ash can damage terrestrial vegetation and aquatic sediments in nearby rivers or lakes [7-9]. The continuous reduction of natural resources and the environmental hazards posed by the disposal of coal ash is reaching an alarming proportion. Hence the use of coal ash as a secondary material will become a necessity rather than a desire. The use of FA and BA (pozzolanic material) in mortars will create a new dimension and if applied on a large scale, shall bring a revolution in the construction industry by economizing on the construction cost and decreasing the amount of coal ash disposed to landfills and
alleviating the environmental hazards caused by the ashes.
Consequently, the aim of this paper is to investigate the effect of FA and BA on the physical properties of mortars as well as to determine the appropriate mortar mix which can utilize efficiently the two waste materials under investigation.
II.
MATERIALS AND METHODS
2.1 Overview
The study deals with investigations of two sets of six mixes, one with untreated FA and the other with untreated BA; comparing them against a control mix of Grade 25 N/ mm2. Consequently, determining the effects of FA and BA on mortars, 5 %, 10 %, 15 %, 20 %, 25 % and 30 % cement replacement by weight (wt) were attempted.
Table 2.1 below shows the description of the mortar mixes used during this study.
2.2 Materials
2.2.1 Fly Ash and Bottom Ash
The untreated FA and BA used were obtained locally from sub-bituminous coal. Class C FA was used and the BA prior to testing.
2.2.2 Fine aggregate
Local fine basalt aggregates were used with grading of 0/ 2 mm.
2.2.3 Cement and water
Type 1 OPC was used as main binding material. Conversely, tap water was used during the experiment, free from any impurities such as oil,
acid, alkali, salt, organic matter or other hazardous substances.
2.2.4 Mortar Mix Proportions
The mix design was prepared bearing in mind the traditional mortar used by masons, having a cement to aggregate ratio of 1:3 by weight. The amount of cement for each mix was the main variable parameter in the mortar mix. Cement was replaced by FA and BA in increasing percentages from 5 % to 30 % by weight, fixing the amount of fine aggregates used. The sample used was prepared on a 10 kg basis for all the tests.
Table 2.1: Description of mortar mixes Label Mortar Description Control No replacement of FA or BA with
cement/aggregate wt ratio 1:3 FA05 5 % wt replacement of cement by
FA
FA10 10 % wt replacement of cement by FA
FA15 15 % wt replacement of cement by FA
FA20 20 % wt replacement of cement by FA
FA25 25 % wt replacement of cement by FA
FA30 30 % wt replacement of cement by FA
BA05 5 % wt replacement of cement by BA
BA10 10 % wt replacement of cement by BA
BA15 15 % wt replacement of cement by BA
BA20 20 % wt replacement of cement by BA
BA25 25 % wt replacement of cement by BA
BA30 30 % wt replacement of cement by BA
2.3 Methods
Tests were performed both on fresh and hardened mortars. Consistency, flow, fresh density and air content tests were done on the fresh mortar while flexural strength and compressive strength tests were done on hardened mortar prisms of dimensions 160 mm × 40 mm × 40 mm. Particle size distribution by sieve analysis (sieves apertures of 8.00 mm, 4.00 mm, 2.00 mm, 1.00 mm, 0.500 mm, 0.250 mm, 0.125 mm and 0.063 mm) was done on all the dry mixed samples. All the tests were performed as illustrated in Table 2.2, based on BS EN 1015: Methods of test for mortar for masonry series.
The fly ash, bottom ash and fine aggregates were all placed in the oven for drying before mixing of the samples. All the ingredients were weighed on a balance with an accuracy of 0.5 grams except the water was measured using a measuring cylinder. All the ingredients were first dry mixed to ensure a heterogeneous mixture, followed by wet mixing. The samples were then moulded as per the defined standard and after 24 hours, these were carefully unmoulded and placed in the curing chamber (water curing for 28 days). The prism samples were then tested on 2, 7 and 28 days, respectively for compressive strength and; 28 days for flexural strength.
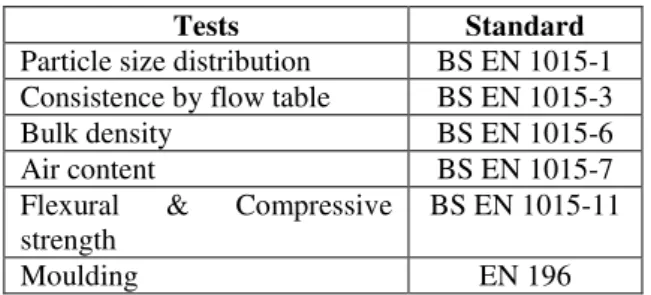
Table 2.2: Tests carried out on mortar
Tests Standard
Particle size distribution BS EN 1015-1 Consistence by flow table BS EN 1015-3 Bulk density BS EN 1015-6 Air content BS EN 1015-7 Flexural & Compressive
strength
BS EN 1015-11
Moulding EN 196
III.
RESULTS AND DISCUSSIONS
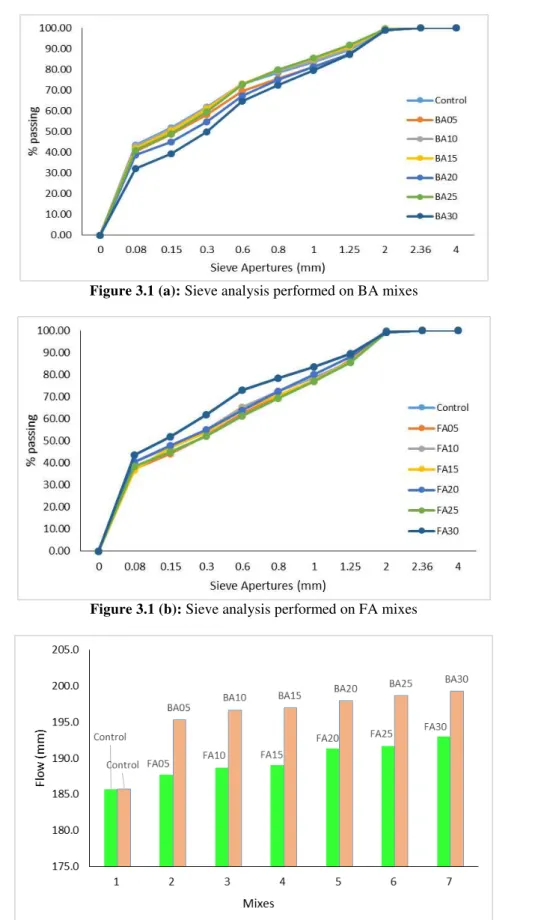
3.1 Particle Size Distribution
Figures 3.1(a) and 3.1(b) illustrate the percentage particle size distribution for the different mixes. As the amount of FA was increased in the mixes, the particles became coarser than the control; as fly ash is slightly coarser than cement. Similar observation was noted for BA replacement where BA was coarser in grading than the FA used.
3.2 Flow
Figure 3.2 compares the flow characteristics of mixes containing various percentages of fly ash and bottom ash with the control mix. The flow values of FA and BA varied between 187.7 mm to 193.0 mm and 195.3 mm to 199.3 mm respectively. This is equivalent to an increase of 1.08 % to 3.95 % and 5.21 % to 7.26 % correspondingly in the flow values compared to the control. The use of the ashes increases the net volume of cementitious materials compared to the traditional mortar. Hence, the paste volume is boosted, leading to a reduction in aggregate particle interference and enhancement in mortar workability. However, it can beobserved that the flow characteristics of bottom ash mixes are higher than that fly ash mixes as the former lose more water, resulting in higher flow for the same percentage replacement of cement.
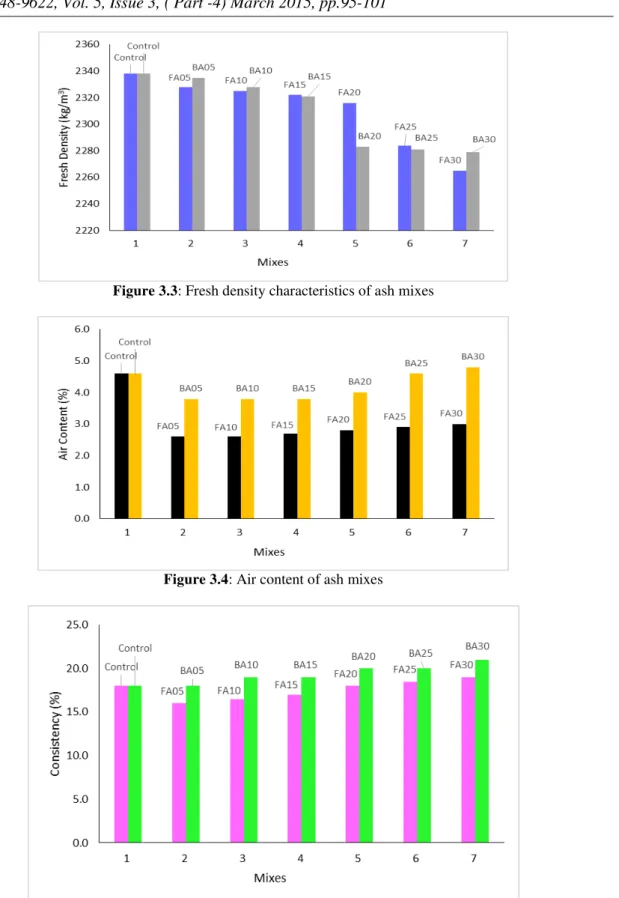
3.3 Fresh Density
in fresh density of paste from 2328 to 2265 kg/m3 and 2335 to 2279 kg/m3 respectively. The net decrease can be attributed to the very low specific gravity of fly ash and bottom ash and since the bottom ash is denser than the fly ash, the fresh density of fly ash mixes is lower.
3.4 Air Content
Figure 3.4 shows the air content values in the mortar mixes compared to the control mix. There is a decrease in the values of air content of the fly ash and bottom ash samples compared to the control. The values range between 2.6 % to 3.0 % for FA05 to FA30 and 3.8 % to 4.6 % for BA05 to BA25, while the air content for the control is 4.6 %. This is mainly due to the fact that FA and BA particles are very small and tend to fill the voids in the mortar paste which reduces the air space in the mix. However, it is seen that as the amount of bottom ash exceeds 25 %, the air content becomes higher than the control. It can thus be deduced that at some point the bottom ash stops filling the voids and the air content will not be affected by more addition.
3.5 Consistency
Figure 3.5 shows the effect of fly ash and bottom ash replacement on consistency of mortar paste. The consistency values lie between 16 % to 19 % and 18 % to 20 % in FA and BA replacement respectively. The control mix had a consistency of 18 %. It is also noted that the amount of water needed to get a workable paste at 5-30% replacement is lower than that for the control mix. This is because the fine particles of FA get absorbed on the oppositely charged surfaces of cement particles and prevent them from forming flocs. The cement particles are thus effectively dispersed and trap large amounts of water; implying that the system will have a reduced water requirement to achieve a given consistency. Moreover, the spherical shape and the smooth surface of FA particles help to reduce the inter particle friction and hence, ease mobility. Finally, the “particle packing effect” is also responsible for the reduced water demand [10]. On the other hand, the amount of water needed to get a workable paste for 10-30 % bottom ash replacement is higher than that for the control mix. As the percentage of BA was increased, the amount of cement needed to coat the BA particles decreased, therefore increasing friction between the bottom ash particles. Due to the high water absorption of bottom ash increases, the latter drew more water and cement paste for lubrication between aggregates.
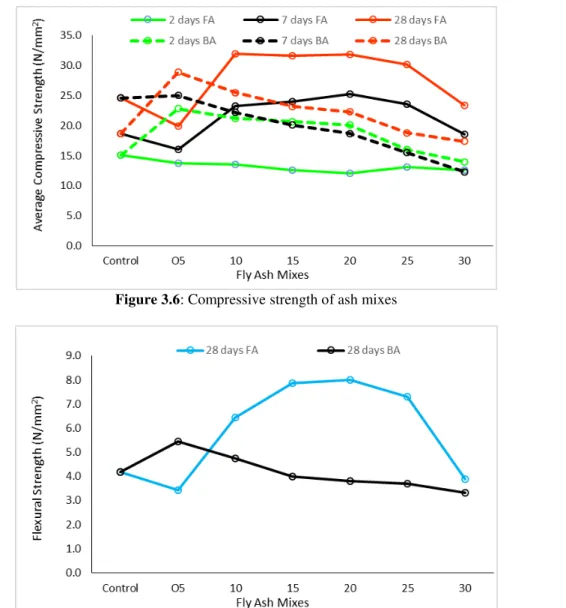
3.6 Compressive Strength
Figure 3.6 illustrates the average compressive strength of FA and BA mixes for 2, 7 and 28 days. Early strength gain, within the first 2 days, decreases as more fly ash is present which is probably due to the free lime reacting during the curing process. The 7 day compressive strength gradually rises with increase in fly ash replacement to reach a maximum strength at 20 % replacement. After 28 days of curing, fly ash replacement at 10-20 % displays a higher strength gain than the control due to the reaction of pozzolans in the hydration process. However, as the fly ash is enhanced to 25 % in the mix, a decrease in compressive strength is noted as an excess of lime inhibits the hydration process.
Figure 3.1 (a): Sieve analysis performed on BA mixes
Figure 3.1 (b): Sieve analysis performed on FA mixes
Figure 3.3: Fresh density characteristics of ash mixes
Figure 3.4: Air content of ash mixes
Figure 3.5: Consistency of ash mixes
3.7 Flexural Strength
Figure 3.6: Compressive strength of ash mixes
Figure 3.7: Flexural strength of ash mixes
IV.
CONCLUSION
This study is based on investigating the use of untreated fly ash and bottom ash in mortars by studying their properties such as particle size distribution, consistency, flow, fresh density, air content, compressive strength and flexural strength characteristics. In the fresh state, as the amount of pozzolans increased in the mixtures, the mortars showed an enhancement in workability, were susceptible to water loss by bleeding, and exhibited a decline in fresh density. The 10-20 % fly ash replacement showed satisfactory results for all the tests and was found to be ideal to be used in mortars. On the other hand, the 5 % bottom ash substitute showed overall satisfactory results and was optimum, according to this research.
R
EFERENCES[1] Construction, (n.d). In Longman Dictionary of Contemporary English. Available from:
http://www.ldoceonline.com/Construction-topic/mortar [Accessed on 2nd March 2015].
[2] J. Lanas, J.L. Alvarez-Galindo, Masonry repair lime-based mortars: factors affecting the mechanical behaviour, Cement and Concrete Research, 33(11), 2003, 1867-1876.
[3] S. A. Ahmed, S.J. Hawraa, S.M Inas, Improvement the properties of cement mortar by using styrene butadiene rubber polymer, Journal of Engineering and development, 16(3), 2012, 61-72.
[4] Coal ash: Toxic and leaking, 2014. In PSR.
Available from:
code-black/coal-ash-toxic-and-leaking.html [Accessed on 26th February 2015].
[5] N. Shintani, T. Saitou, H. Sasaki, T. Kita, Mineralogical and chemical properties of mortar incorporating coal ash produced by fluidized bed combustion, American Concrete Institute, 178, 1998, 431-448. [6] A. Terzic, Z. Radojevic, L. Milicic, L.
Pavlovic, Z. Acimovic, Leaching of the potentially toxic pollutants from composites based on waste raw material, Chemical
Industry and Chemical Engineering
Quaterly, 18(3), 2012, 373-383.
[7] A. Fairbrother, G. Bigham, J. Pietari, J. Tsuji, Coal ash: Hazard, waste or resource?
Environmental Perspectives, 1, 2010, 1-11. [8] F. Frost, L. Harter, S. Milham, R. Royce,
A.H. Smith, J. Hartley, P. Enterline, Lung cancer among women residing close to an arsenic emitting copper smelter, Arch. Environ. Health 42(3), 1987, 148−152.
[9] K. Tollestrup, F, F.J. Frost, L.C. Harter, and G.P. McMillan, Mortality among children residing near the American Smelting and Refining Company (ASARCO) copper smelter in Ruston, Washington. Arch. Environ. Health 58(11), 2003, 683−691.