ISSN 0101-2061 Food Science and Technology
DI:
D http://dx.doi.org/10.1590/1678-457X.02415
1 Introduction
The Maillard reaction was named after the French physicist and chemist Louis Camille Maillard who initially described it. It is often defined as the non-enzymatic browning reaction, and has been important in the preparation or presentation of many types of food (Miller et al., 2013). The Maillard reaction is a series of complex reactions occurring between the carbonyl compounds with amino compounds (Martins et al., 2000), which can generate volatile small molecules and brown macromolecules, and has significant impact on the food color and aroma (Cerny & Guntz-Dubini, 2013; Echavarría et al., 2012). Therefore, the study of Maillard reaction has the instructive significance to the control of the color and aroma of the final products in food industry.
The L-ascorbic acid (ASA) is another compound potentially containing the carbonyl component in the Maillard reaction that rose a widespread attention beside the reducing sugar (Yu & Deng, 2009). The ASA is abundant in nature, and is commonly used as additives (such as anti-oxidative) in food processing. Therefore the Maillard reaction of ASA is very important in food industry. The L-glutamic acid (Glu), as one of the 20 amino acids that compose proteins, exists in a wide variety of organisms in nature and at the same time is a commonly used food flavor enhancer. So the Glu related research plays a significant guiding role in industrial production and household cooking.
The Maillard reactions are affected by multiple factors (Baek et al., 2008). The change of the reaction conditions could alter the reaction path and progress so as to change the
product compositions and generate different colors and aromas. Therefore the study of these factors has instructive significance on the reaction products. Since the Maillard reaction products (MRPs) mainly include color products and aroma products, with diversed species but small quantities, it is not plausible to elaborately investigate each compound individually. Therefore in our work we used the absorbance at a specific wavelength to detect the formation of browning products and their precursors, applied gas chromatography to separate and quantify each aroma compounds, and systematically studied the compounds with specific aromas and structures. Dur research group previously studied the effect of pH on aroma compounds, and found that pH 8 was the most suitable pH value for the ASA / Glu Maillard reactions (Yu et al., 2012a). Therefore in this work we investigated the other reaction parameters effects on Maillard products at pH 8. In previous work we also adopted isotope labeling method to investigate the pyrazine generation mechanisms in the ASA / Glu system (Yu et al., 2013). Adams & Kimpe (2009) studied the formation of pyrazine compounds in ASA and Glu under dry, baking, non-solvent conditions and with the presence of K2CD3. But none of the previous reports has carried out
systematic research about reaction conditions. This manuscript based on our previous investigation and studied the effects of reactants molar ratio, reaction time and temperature on MRPs in the ASA / Glu system. We here also found the changing rules of the system colors and aromas, and provided theoretical basis for the practical industrial production.
The effects of reactants ratios, reaction temperatures and times on Maillard
reaction products of the L-ascorbic acid/L-glutamic acid system
Yong-Yan ZHDU1, Ya LI1, Ai-Nong YU1*
Received 07 Oct., 2015 Accepted 01 Apr., 2016
1 School of Chemistry & Environmental Engineering, Hubei University for Nationalities, Enshi, Hubei, China *Corresponding author: [email protected]
Abstract
The transformation law of the Maillard reaction products with three different reactants ratios - equimolar reactants, excess L-glutamic acid and excess L-ascorbic acid reaction respectively, five different temperatures, and different time conditions for the L-ascorbic acid / L-glutamic acid system were investigated. Results showed that, the increase of the reaction time and temperature led to the increase of the browning products, uncoloured intermediate products, as well as aroma compounds. Compared with the equimolar reaction system, the excess L-ascorbic acid reaction system produced more browning products and uncoloured intermediate products, while the aroma compounds production remained the same. In the excess L-glutamic acid system, the uncoloured intermediate products increased slightly, the browning products remained the same, while the aroma compounds increased.
Keywords: Maillard reaction; ascorbic acid; glutamic acid; aroma compound; browning product.
2 Materials and methods
2.1 Materials
ASA (analytical grade), NaDH (analytical grade), metaphosphoric acid (analytical grade), NaH2PD4 (analytical grade) and Na2HPD4 (analytical grade) were from Sinopharm Chemical Reagent Co., Ltd. (Shanghai, China). Glu, 3-chloro-2,5-dimethylpyrazine and C5-C22n-alkanes were from Sigma-Aldrich Chemical Co. (St. Louis, MD, USA). Water used in the experiments was double distilled water (ddi water).
2.2 Preparation of Maillard reaction solution
ASA and Glu were dissolved into 250 mL 0.2 mol/L pH=8 phosphate buffer solution with the ratios shown in Table 1, under the conditions of excess Glu, excess ASA, and equimolar reactants. The solution pH was then adjusted to 8.00 (25 °C) with NaDH. 15mL of the as prepared solution was then sealed in P160001 Synthware® pressure glass vials (Beijing Synthware Glass, Inc, China), and heated to react for 30 min-150 min with 30min as reaction time interval, and at 120 °C, 125 °C, 130 °C, 135 °C and 140 °C respectively. The reactions were immediately stopped by cooling under a stream of cold water. Each experimental condition was repeated three times.
2.3 Measurement of UV-absorbance and browning
The UV-absorbance and browning of Maillard reaction solution were measured according to the method of reference (Ajandouz et al., 2001). Appropriate dilution was made using ddi water and the absorbance was measured at 294 and 420 nm using an UV2550 spectrophotomerer (Shimadzu (China) Co., Ltd., China) for determining UV-absorbance and browning intensity, respectively. Measured absorbance was converted to the absorbance of the original reaction solution.
2.4 Qualitative analysis of aroma compounds
The samples were analyzed by headspace-solid phase microextraction (SPME)-gas chromatography (GC)–mass spectra (MS) according to the previously investigated conditions (Zhou et al., 2015). The assayed fiber was carboxen/polydimethylsiloxane (CAR/PDMS, 75 μm thickness; Supelco, Bellefonte, PA). The samples were equilibrated for 15 min at 50 °C before insertion of the SPME fiber into the vials. The extraction time was 30 min at 50 °C.
Analyses were performed using an Agilent 6890N gas chromatograph coupled to an Agilent 5975i mass selective detector (Agilent, Santa Clara, CA). Aroma compounds were separated using a HP-5 capillary column (30 m × 0.25 mm i.d × 0.25 μm). The SPME fiber was desorbed and maintained in the injection port at the oven temperature (250 °C) for the time (4.0 min)
suggested by the manufacturer. The injection port was in splitless mode. The temperature program was isothermal for 5 min at 40 °C, raised to 260 °C at a rate of 4 °C / min and then raised to 280 °C at a rate of 20 °C / min. C5-C22 n-alkanes were run under the same chromatographic conditions as the samples to calculate the linear retention indices (LRI) of detected compounds. The transfer line to the mass spectrometer was maintained at 280 °C. The mass spectra were obtained using a mass selective detector with 70 eV electronic impact, 1753 V multiplier voltage, 1 scan / s data collection rate over the m/z range of 30-400 u.m.a.
Aroma compounds were identified by comparing their mass spectra with those contained in the Nist05 and Wiley275 libraries and by comparison of their LRI with the references (Adams & Kimpe, 2009), as well as, whenever possible, Co-GC injection with authentic samples available in our laboratories.
2.5 Quantitation of aroma compounds
Quantitative characterizations of the samples were performed by means of gas chromatograph with flame ionization detector (FID). An Agilent 6890N gas chromatograph (Agilent Technologies, Palo Alto, CA), equipped with FID was used. Identical assayed fiber, extraction conditions, capillary column and chromatographic conditions described in headspace-SPME-GC-MS were used. Quantitation of pyrazines identified in the model system was carried out with 3-chloro-2,5-dimethylpyrazine (0.436 mg / mL in ethanol) as the internal standard. The quantity of each pyrazine was finally converted into 10–6 mol / L, and assuming
all response factors were 1.
2.6 Statistical analysis
Each experimental point were carried out in three replicates, and presented as the average value ± standard deviation. Each experimental point with relative standard deviation (RSD) falling within commonly accepted error range with the corresponding analysis method counts as effective data. All data analysis, calculation and plotting were processed with Drigin Pro 8.
3 Results and discussion
3.1 The effects of reaction conditions on absorbance at 294 nm
In Maillard reaction, reactants formed complex MRPs through three major stages, including early, intermediate and final stages. The UV absorbance at 294 nm was often used to indicate the intermediate MRPs while the final stage was monitored by the absorbance at 420 nm (Yu et al., 2012b). Usually it is considered that the absorbance at 294 nm wavelength reflects the amount change of the uncoloured intermediate products (UIPs) in Maillard reaction (Ajandouz et al., 2001; Benjakul et al., 2005a; Lerici et al., 1990; Yu et al., 2012b), and there’re literatures suggesting that these compounds could be the UIPs in the glycosylation process, such as aldehydes, small molecule ketones and so on. Ajandouz et al. (2001) believed that these compounds could be the precursors for the browning products in Maillard reaction or caramelization reaction, and therefore the absorbance at 294 nm could indicate the formation of the UIPs and thus the precursors
Table 1. Reactants ratio for three types of Maillard reaction solution.
Reactants Excess Glu Excess ASA Equimolar
reactants
ASA (mol) 0.005 0.06 0.005
of browning products. The change in the absorbance at 294 nm to some degree can relate with the change of browning products to reveal the relationship between each other, and predict the color change of the reaction solution.
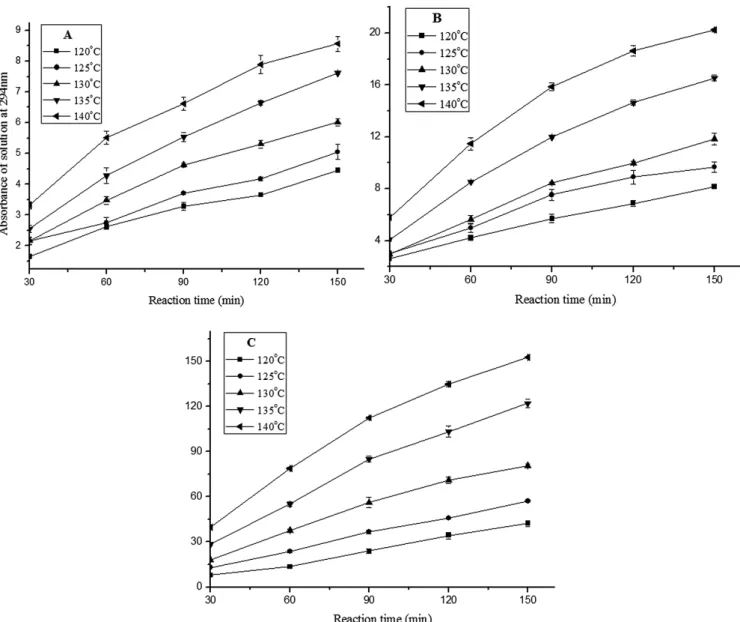
Figure 1A-C show the changes of the absorbance at 294 nm of reactants over time at different temperatures in equimolar system, excess Glu, and excess ASA systems. The RSD of each data point did not exceed 6.94%. As mentioned above, the absorbance at 294 nm could indicate the formation of the UIPs and thus the precursors of browning products. From Figure 1A-C it can be seen that at the same reaction temperature, along with the reaction time increase, the absorbance at 294 nm in each system gradually increased, indicating that the increase of reaction time facilitates the formation of the UIPs.
It was found by investigating the absorbance at 294 nm at the same reaction time in equimolar system in Figure 1A that,
by increasing the reaction temperature, the absorbance increased accordingly. Taking 150 min reaction as an example, the absorbance was 4.45 at 120 °C, and increased to 5.05 when heated up to 125 °C within the same reaction time. Continuing increase of the temperature resulted in the increase of the absorbance as well, which reached to 8.56 at the highest heating temperature of 140 °C eventually in the equimolar system. Investigation of the absorbance changes in Figure 1B, C revealed a similar trend as shown in Figure 1A, and therefore in conclusion the increase of the temperature facilitates the formation of the UIPs. This result was in agreement with Lerici et al. (1990) who found that heat treatment of a glucose–glycine mixture caused marked increase in absorbance at 294 nm.
It can be known by comparing the absorbance at 294 nm with the same reaction time and temperature under the three circumstances in Figure 1A-C, that the increase of Glu or ASA
Figure 1. Change of the absorbance at 294 nm of the reaction solution over time at different temperatures in (A) equimolar system; (B) excess
facilitated the formation of more UIPs. Taking the absorbance at 140 °C after heating for 150 min as an example, the absorbance was 8.56 in equimolar reaction system, 20.23 in excess Glu system, and 152.67 in excess ASA system. From this it is concluded that the increase of the Glu and the ASA can generate more UIPs. But the facilitating effect of Glu on the UIPs formation was very limited: when the initial concentration of Glu was 12 times of that of ASA at 140 °C after heating for 150 min, the formed amount of UIPs was only 2.4 times of that in the equimolar system; while when the initial concentration of ASA was 12 times of that of Glu, the formed amount of UIPs was 17.8 times of that in the equimolar system. The reason for this result might be that the detected UIPs at 294 nm were mostly aldehydes, small molecule and so on, and the increase of any of the reactants concentration could speed up the reaction to generate more UIPs, while the functional groups from ASA were prone to form aldehydes, ketones and so on, making the formation of prone increase.
3.2 The effects of the reaction conditions on the browning products
The color products produced from Maillard reaction system can be also called browning products. As reported in reference (Elizalde et al., 1992; Yu et al., 2012b), here we used the absorbance at 420 nm wavelength to measure the products formation. The increase in absorbance at 420 nm was used as an indicator for browning development in the final stage of the browning reaction (Ajandouz et al., 2001; Morales & Jimenez-Perez, 2001). Figure 2A-C show the change of absorbance at 420nm of reaction solution over time at different temperatures in equimolar system, excess Glu system, and excess ASA system. The RSD of each data point did not exceed 7.33%. It can be seen from Figure 2A-C that at the same reaction temperature, the absorbance at 420 nm in each system increased gradually along with the reaction time increase. The increase of the browning products became fast at 120 °C (heated for 60min) in equimolar system, while the absorbance increase was not
Figure 2. Change of the absorbance at 420 nm of the reaction solution over time at different temperatures in (A) equimolar system; (B) excess
obvious for 60 min-90 min, or 90 min-120 min. This could be due to that when the reaction temperature was relatively low, the initial reactant concentrations were relatively large so that the browning products had a certain increase; but after the reactants were consumed to a certain degree at relatively low temperatures it was hard to form browning products. This means that the browning products could only form above 120 °C for a certain reaction time in this reaction system. It was confirmed by the fact that the absorbance at 420 nm at 120 °C increased slowly at the presence of excess Glu and excess ASA in Figure 2B and Figure 2C. In general, the change of browning products has the characteristics to increase along with heating time, which indicates that the elongation of the reaction time facilitates the formation of browning products no matter in equimolar system, or excess Glu system, or ASA system. The browning products are very important sources of the color of foods. This has big significance on food processing.
By investigating the absorbance at 420 nm with the same reaction time in equimolar system, it can be found that the absorbance at 420 nm basically followed the rule that the absorbance increased with temperature increase. Taking the mid point of the reaction time 90min as an example, the absorbance was 0.24 at 120 °C, and became 0.44 when heated to 125 °C within the same heating time. Continuing increase of the temperature resulted in the increase of the absorbance, which reached maximum of 0.79 at 140 °C. Analysis of the slopes at different temperatures at the presence of excess Glu and ASA in Figure 2B, C revealed directly that it basically followed the rule that the absorbance increased with temperature increase. Therefore the increase of the temperature had positive effect on the formation of the browning products.
By investigating the absorbance at 420 nm with the same reaction time, we found that there was little difference between equimolar reaction with the excess Glu reaction system, while the absorbance of the excess ASA apparently preceded those in equimolar system and excess Glu system. Taking the reaction of 150 min at 140 °C as an example, the absorbance was 1.22 in the equimolar system, 1.24 in excess Glu system, and 25.00 in excess ASA system. It was also very obvious from the y axis in Figure 2A-C that, the absorbance of the excess ASA was an order higher than those in equimolar system and excess Glu system. We know from there that, the increase of the initial concentration of Glu had barely any effect on the formation of the browning products, and the increase of the ASA initial concentration could significantly increase the formation of the browning products. This indicated that the system generated browning products mainly from the ASA part, while the amino acid had little effect on the formation of the browning products. The increase of the color of the products in production could be realized by increasing the concentration of the ASA. Accordingly, if decreasing the products color is needed, it could be realized by controlling or decreasing the concentration of the ASA.
In conclusion, the browning products (Figure 2) of all samples increased with the concomitant increase in UIPs (Figure 1). The result was in agreement with the work done by Lertittikul et al. (2007) who also found similar results in porcine plasma protein–glucose model system. Generally, the
UIPs formed at intermediate stages contributed to the browning products formation in both Maillard and caramelisation reactions (Ajandouz et al., 2001; Benjakul et al., 2005a; Benjakul et al., 2005b).
3.3 Effects of the reaction conditions on the aroma compounds
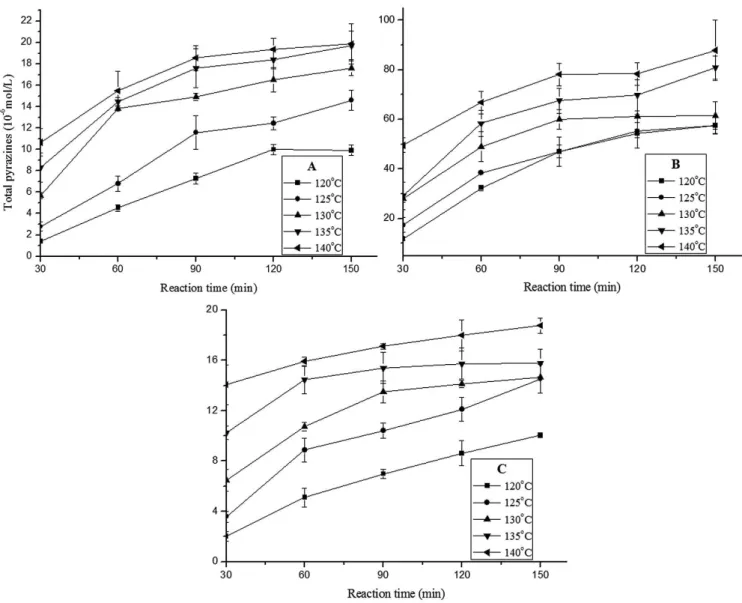
The headspace-SPME-GC-MS analysis of the volatile compounds of the reaction mixture solution showed that the main aroma substances in the system were pyrazine compounds, particularly alkyl pyrazine. This result is consistent with the literature (Yu et al., 2012a). Pyrazines are a class of compounds with the aroma of baking and nuts, and contributes significantly to food aroma. They are the main aroma substances detected in many cocoa bean- or soybean-based fermented foods, where they are considered as the important contributor to their aroma (Besson et al., 1997; Rappert & Müller, 2005). In coffee, a number of methyl-, dimethyl-, ethyl-, diethyl- and mixed ethyl-methyl pyrazines have been detected and are considered to be important for flavor and aroma (Maga & Sizer, 1973). Therefore in this article the total pyrazine compounds were used to represent the aroma substances. Combining with the previous research results and the experimental results in this work, the ASA/Glu system Maillard reactions mainly produce 2-methylpyrazine, 2,5-dimethylpyrazine, 2,3-dimethylpyrazine, 2-ethyl-5-methylpyrazine, 2,3,5-trimethylpyrazine, 3-ethyl-2,5-dimethylpyrazine, 2-ethyl-3,5-dimethylpyrazine, 5-ethyl-2,3-dimethylpyrazine, 2,5-diethylpyrazine, 2,3-diethyl-5-methylpyrazine and 3,5-ethyl-2-2,3-diethyl-5-methylpyrazine. Adding up the molar concentrations of these pyrazine compounds gave the total concentration of the pyrazine, and the study of the change rules of these aroma substances under different reaction conditions then provided the theoretical basis for the practical production.
Figure 3A-C show the change of the total pyrazine concentration over time in equimolar reaction system, excess Glu system, and excess ASA system respectively. The RSD of each data point did not exceed 19.60%. Investigation of the change of the total pyrazine concentration over time in Figure 3A-C revealed that, at the same heating temperature, the extension of reaction time basically led to the gradual increase of the total pyrazine concentration. Relatively high temperature also facilitated the formation of the pyrazine compounds.
baking and nuts smell, and excess ASA can form deep colors in the production of foods containing ASA and Glu.
Acknowledgements
The authors thank the project 31360408 supported by National Natural Science Foundation of China.
References
Adams, A., & Kimpe, N. (2009). Formation of pyrazines from ascorbic acid and amino acids under dry-roasting conditions. Food Chemistry, 115(4), 1417-1423. http://dx.doi.org/10.1016/j.foodchem.2009.01.071.
Ajandouz, E. H., Tchiakpe, L. S., Dre, F. D., Benajiba, A., & Puigserver, A. (2001). Effects of pH on caramelization and Maillard reaction kinetics in fructose–lysine model systems. Journal of Food Science, 66(7), 926-931. http://dx.doi.org/10.1111/j.1365-2621.2001.tb08213.x. ASA degraded compounds with the Glu. The formation of
the pyrazine compounds depended on the Glu concentration, and thus the increase of the Glu concentration facilitated the formation of the aroma substances.
4 Conclusion
The effects of reactants molar ratio, reaction time and temperature on MRPs in the ASA / Glu system were systematically investigated here. The increase of the reaction time and the reaction temperature led to the increase of the browning products, UIPs, as well as aroma compounds. Compared with the equimolar reaction system, the excess ASA reaction system produced more browning products and UIPs, while the aroma compounds roughly remained the same. In the excess Glu system, the UIPs increased slightly, with the browning products roughly remaining the same, while the aroma compounds increased. The results demonstrate that excess Glu is able to form strong
Figure 3. Change of the total pyrazine concentration over time at different temperatures in (A) equimolar system; (B) excess Glu system; and
Maga, J. A., & Sizer, C. F. (1973). Pyrazines in foods: a review. Journal of Agricultural and Food Chemistry, 21(1), 22-30. http://dx.doi. org/10.1021/jf60185a006.
Martins, S. I. F. S., Jongen, W. M. F., & van Boekel, M. A. J. S. V. (2000). A review of Maillard reaction in food and implications to kinetic modeling. Trends in Food Science & Technology, 11(9-10), 364-373. http://dx.doi.org/10.1016/S0924-2244(01)00022-X.
Miller, F. P., Vandome, A. F., & McBrewster, J. (2013). Maillard reaction
(pp. 1-10). Beau Bassin: Alphascript Publishing.
Morales, F. J., & Jimenez-Perez, S. (2001). Free radical scavenging capacity of Maillard reaction products as related to colour and fluorescence.
Food Chemistry, 72(1), 119-125. http://dx.doi.org/10.1016/S0308-8146(00)00239-9.
Rappert, S., & Müller, R. (2005). Ddor compounds in waste gas emissions from agricultural operations and food industries. Waste Management (New York, N.Y.), 25(9), 887-907. http://dx.doi.org/10.1016/j. wasman.2005.07.008. PMid:16129591.
Yu, A. N., & Deng, Q. H. (2009). Volatiles from the Maillard reaction of l-ascorbic acid and l-alanine at different pHs. Food Science and Biotechnology, 18(6), 1495-1499.
Yu, A. N., Tan, Z. W., & Shi, B.-A. (2012a). Influence of the pH on the formation of pyrazine compounds by the Maillard reaction of L-ascorbic acid with acidic, basic and neutral amino acids. Asia-Pacific Journal of Chemical Engineering, 7(3), 455-462. http://dx.doi. org/10.1002/apj.594.
Yu, A. N., Tan, Z. W., & Wang, F. S. (2013). Mechanistic studies on the formation of pyrazines by Maillard reaction between L-ascorbic acid and L-glutamic acid. LWT - Food Science and Technology (Campinas.), 50(1), 64-71.
Yu, X., Zhao, M., Hu, J., Zeng, S., & Bai, X. (2012b). Correspondence analysis of antioxidant activity and UV–Vis absorbance of Maillard reaction products as related to reactants. LWT - Food Science and Technology (Campinas.), 46(1), 1-9.
Zhou, Y. Y., Li, Y., & Yu, A. N. (2015). Dptimum extraction conditions for pyrazine compounds from Maillard reaction mixture by headspace solid-phase microextraction. Food Science, 36(6), 119-123. [in Chinese] Baek, S. H., Kwon, S. Y., Lee, H. G., & Baek, H. H. (2008). Maillard
browning reaction of D-psicose as affected by reaction factors. Food Science and Biotechnology, 17(6), 1349-1351.
Benjakul, S., Lertittikul, W., & Bauer, F. (2005b). Antioxidant activity of Maillard reaction products from a porcine plasma protein–sugar model system. Food Chemistry, 93(2), 189-196. http://dx.doi. org/10.1016/j.foodchem.2004.10.019.
Benjakul, S., Visessanguan, W., Phongkanpai, V., & Tanaka, M. (2005a). Antioxidative activity of caramelisation products and their preventive effect on lipid oxidation in fish mince. Food Chemistry, 90(1-2), 231-239. http://dx.doi.org/10.1016/j.foodchem.2004.03.045. Besson, I., Creuly, C., Gros, J. B., & Larroche, C. (1997). Pyrazine
production by Bacillus subtilis in solid-state fermentation on soybeans. Applied Microbiology and Biotechnology, 47(5), 489-495. http://dx.doi.org/10.1007/s002530050961.
Cerny, C., & Guntz-Dubini, R. (2013). Formation of cysteine-S-conjugates in the Maillard reaction of cysteine and xylose. Food Chemistry, 141(2), 1078-1086. http://dx.doi.org/10.1016/j.foodchem.2013.04.043. PMid:23790889.
Echavarría, A. P., Pagán, J., & Ibarz, A. (2012). Melanoidins formed by Maillard reaction in food and their biological activity. Food Engineering Reviews, 4(4), 203-223. http://dx.doi.org/10.1007/ s12393-012-9057-9.
Elizalde, B. E., Bressa, F., & Rosa, M. (1992). Antioxidative action of Maillard reaction volatiles: Influence of Maillard solution browning level. Journal of the American Oil Chemists’ Society, 69(4), 331-334. http://dx.doi.org/10.1007/BF02636061.
Lerici, C. R., Barbanti, D., Manzano, M., & Cherubin, S. (1990). Early indicators of chemical changes in foods due to enzymic or non enzymic browning reactions. 1: study on heat treated model systems.
Lebensmittel-Wissenschaft und Technologie, 23, 289-294.