http://www.uem.br/acta ISSN printed: 1806-2636 ISSN on-line: 1807-8672
Doi: 10.4025/actascianimsci.v37i2.25911
Glutamic acid supplementation on low protein diets for laying hens
Roseane Madeira Bezerra1*, Fernando Guilherme Perazzo Costa1, Patrícia Emília Naves Givisiez1, Cláudia de Castro Goulart2, Renato Andrade dos Santos3 and Matheus Ramalho de Lima1
1
Universidade Federal da Paraíba, Rodovia BR-079, Km 12, 58397-000, Areia, Paraíba, Brazil. 2
Universidade Estadual Vale do Acaraú, Sobral, Ceará, Brazil. 3Universidade Federal do Rio Grande do Norte, Macaíba, Rio Grande do Norte, Brazil. *Author for correspondence. E-mail: [email protected]
ABSTRACT. With the objective of evaluating the effect of reducing crude protein (CP) and L-glutamic acid supplementation, Dekalb Brown laying hens with 34 weeks of age. The birds were distributed in six treatments in a completely randomized design, eight replications of eight birds. The control diet contained 17% CP. The second and third treatments had CP reduced by 1.5 and 3.0 percentage points (pp) of CP in relation to the control diet, respectively. In the fourth treatment, was added the same amount of glutamate of the control diet (2.982%), and the last two treatments was added 1 and 2 pp of glutamate in relation to control diet (3.982 and 4.98%), respectively. The treatment with 15.17% CP + 0.341% L-glutamic acid (T4) promoted higher egg production, and the control diet showed greater egg weight than others treatments. There was no significant effect on the variables on quality of eggs. The T4 presented values of excreted nitrogen similar to the others treatments, with lower concentration of uric acid than the control diet and lower cost in the production. In conclusion, it is recommended the treatment with 15.17% CP + 0.341% L-glutamic acid for Brown laying hens with 34 weeks of age.
Keywords: egg production, nitrogen, performance, uric acid.
Ácido glutâmico suplementado em dietas de baixa proteína para poedeiras semipesadas
RESUMO. Com o objetivo de avaliar o efeito da redução da proteína bruta (PB) e suplementação de L-glutamato em poedeiras da linhagem Dekalb Brown com 34 semanas de idade, as aves foram distribuídas em seis tratamentos em um delineamento experimental inteiramente casualizado com oito repetições. A dieta controle continha 17% PB. Os segundo e terceiro tratamentos tinham redução de 1,5 e 3,0 pontos percentuais (pp) de PB em relação à dieta controle, respectivamente. No quarto tratamento, foi adicionada a mesma quantidade de glutamato da dieta controle (2,982%), e nos dois últimos tratamentos foram adicionados 1 e 2 pp de glutamato em relação à dieta controle (3,982 e 4,98%), respectivamente. O tratamento com 15,17% CP + 0,341% L-glutâmico (T4) promoveu maior produção de ovos, e a ração controle apresentou maior peso de ovos do que os outros tratamentos. Não houve efeito significativo sobre as variáveis relativas à qualidade dos ovos. O T4 apresentou valores de nitrogênio excretado semelhante aos demais tratamentos, com menor concentração de ácido úrico que a dieta controle e menor custo na produção. Em conclusão, recomenda-se o tratamento com 15,17% PB + 0,341% de ácido L-glutâmico para poedeiras semipesadas com 34 semanas de idade.
Palavras-chave: produção de ovos, nitrogênio, desempenho, ácido úrico.
Introduction
Amino acid requirements of commercial layers have been extensively researched, because currently it is a common practice to calculate diets based on amino acid recommendations, ideal protein standard, amino acid digestibility and costs of feeding (Rocha et al., 2009). Incorrect diet formulations may cause deficiencies and/or excess depending on the variability of amino acid digestibility. As a measure to avoid this problem, researchers developed the concept of ideal protein, which implies providing nutrients in a balanced manner, using the exact balance of amino acids, in
order to meet the requirements of all amino acids to maintenance and production (Furuya et al., 2005).
L-glutamic acid is considered an efficient source of non-specific nitrogen, important for the maintenance of the intestinal mucosa, for being source of energy for the mucosa turnover, via the ATP produced from the Krebs cycle; is source of nitrogen for the synthesis of other amino acids and
nitrogen compounds (Berres et al., 2010). It regulates the nitric oxide synthesis in
specific tissues like the brain and acts as precursor of glutathione, which is an important compound in the elimination of oxidants and modulation of immune response (Li et al., 2007).
The effect of glutamate on the maintenance and improvement of intestinal quality is well described. In the intestine, this amino acid functions as oxidative fuel that has important role as an enhancer of intestinal function, promoting high turnover rate of intestinal mucosa cells (Burrin & Stoll, 2009). However, despite the great importance of this amino acid, only few studies have been conducted to evaluate its efficiency as a non-specific nitrogen source in diets for laying hens.
Material and methods
The experiment was conducted in the Poultry Sector of the Department of Animal Science of the Center for Agrarian Sciences of Federal University of Paraiba, Brazil, Campus II, located in the municipality of Areia, during 140 days divided in five 28-day periods.
Four layers were housed per cage (24 x 37 x 41 cm) equipped with gutter-type feeders and nipple drinkers. The lighting program adopted consisted of 17 hours of light (artificial plus natural) plus seven hours of darkness, using a timer to control the artificial light. Feed and water were supplied for ad libitum consumption throughout the experimental period.
A total of 384 Dekalb Brown layers from 34 to 54 weeks of age were distributed in six treatments in a completely randomized design, eight replications of eight birds each.
The experimental diets for laying hens in the laying phase are listed in Table 1.
Table 1. Percentage and chemical composition of experimental diets.
Ingredients,% T1 T2 T3 T4 T5 T6
Corn grain 63.469 67.82 73.27 67.849 66.509 65.168
Soybean meal 22.584 18.900 13.723 18.531 18.739 18.946
Soybean oil 2.364 1.468 0.575 1.429 1.556 1.683
Dicalcium phosphate 1.550 1.575 1.605 1.579 1.583 1.586
Limestone 9.289 9.308 9.328 9.309 9.305 9.302
Common salt 0.373 0.377 0.382 0.378 0.378 0.379
DL-Methionine 0.201 0.234 0.273 0.238 0.240 0.243
L-Lysine - 0.066 0.219 0.078 0.074 0.071
L-Valine - 0.031 0.112 0.038 0.039 0.039
L-Isoleucine - 0.048 0.132 0.055 0.054 0.053
L-Tryptophan - 0.003 0.031 0.005 0.004 0.004
L-Threonine - - 0.059 - - -
L-Glutamic acid - - - 0.341 1.349 2.356
Choline 0.070 0.070 0.070 0.070 0.070 0.070
Mineral mix1 0.050 0.050 0.050 0.050 0.050 0.050
Vitamin mix2 0.050 0.050 0.050 0.050 0.050 0.050
Potassium carbonate - - 0.121 - - -
AV, % Calculated nutritional composition, %
ME, kcal kg-1 2800 2800 2800 2800 2800 2800 2800
CP, % 17.00 17.00 15.50 14.00 15.17 15.74 16.32
Calcium, % 4.200 4.200 4.200 4.200 4.200 4.200 4.200
Phosphorus available, % 0.375 0.375 0.375 0.375 0.375 0.375 0.375 Digestible met +cys, % 0.683 0.683 0.683 0.683 0.683 0.683 0.683 Digestible methionine, % 0.375 0.444 0.440 0.459 0.442 0.443 0.444 Digestible lysine, % 0.750 0.750 0.750 0.750 0.750 0.750 0.750 Digestible valine, % 0.675 0.675 0.684 0.675 0.675 0.675 0.675 Digestible isoleucine, % 0.623 0.623 0.603 0.603 0.603 0.603 0.603 Digestible threonine % 0.495 0.495 0.486 0.480 0.495 0.495 0.495 Digestible tryptophan, % 0.173 0.173 0.187 0.173 0.173 0.173 0.173 Digestible arginine, % 0.750 0.750 0.932 0.785 0.920 0.921 0.924 Digestible phenylalanine, % 0.488 0.771 0.674 0.573 0.692 0.692 0.692 Digestible histidine, % 0.218 0.421 0.387 0.338 0.356 0.364 0.382 Digestible leucine, % 0.915 1.349 1.244 1.124 1.232 1.221 1.223
Sodium, % 0.230 0.230 0.230 0.230 0.230 0.230 0.230
Chlorine, % 0.210 0.351 0.351 0.353 0.354 0.353 0.351
Potassium, % 0.590 0.590 0.590 0.590 0.590 0.590 0.590
Glutamate, % - 2.982 2.670 2.318 2.982 3.982 4.982
EB, mEq kg-1 - 152.020 152.020 151.460 151.180 151.460 152.020
The first treatment (T1) was considered the control diet and contained 17% CP, based on corn and soybean meal, supplemented with DL-methionine, and formulated so as to meet the nutritional requirements of brown-egg laying hens during the egg-laying phase with the levels of all essential amino acids reaching or slightly exceeding the recommendations of digestible amino acids for laying hens (Rostagno et al., 2005).
The second treatment (T2) was a diet with reduction of 1.5 percentage points of crude protein in relation to the Control Diet, supplemented with synthetic amino acids so as to meet the nutritional requirements of essential amino acids of birds. In the third treatment (T3), the crude protein of the diet was reduced by three percentage points in relation to control diet, and in the same manner, industrial amino acids were included to ensure that the minimum essential amino acid requirements were met.
With reduction of crude protein in the second and third treatments from 17 percentage points to 15.5 and 14%, respectively, the glutamate content, as well as the essential and non-essential amino acid levels also decreased. Thus, the subsequent treatments were supplemented with L-glutamic acid to serve as a non-specific nitrogen source of the diet.
Accordingly, in the fourth treatment (T4), was added the same amount of glutamate of the control diet (2.982%) and crude protein increased to 15.17%, supplemented with 0.341% L-glutamic acid. In the fifth (T5) and sixth (T6) treatments was added1 and 2 percentage points of glutamate in relation to control diet (3.982 and 4.98%), respectively, and the crude protein increased to 15.74 and 16.32%, respectively, supplementing, this way, with 1.35 and 2.36% L-glutamic acid.
The variables evaluated were feed intake (g bird-1
day-1), final weight (kg bird-1), egg production (%),
egg weight (g egg-1), egg mass (g egg-1), mass
conversion produced (g g-1), feed conversion per
dozen eggs (kg dozen), eggshell specific gravity (g cm-3), percentage of albumen, yolk and shell, haugh
unit, nitrogen consumed, excreted and retained in g bird-1 day-1, nitrogen retention efficiency (%), serum
uric acid level (mg dL-1), and economic evaluation.
Feed intake was calculated as the difference between the amount of feed supplied and experimental leftovers, weighed at the beginning and at the end of each 28 day-period. Final weight was determined by weighing all the replicates and dividing the value by the number of birds, at the end of the experiment. Egg production was recorded per
period on egg production spreadsheets daily at 15h, by dividing the total number of eggs per replicate by the number of birds.
The eggs of each replicate were weighed individually on the last three days of each 28 day-period for calculation of the average egg weight. Egg mass was calculated by the product of egg production and the average egg weight per replicate. Feed conversion per egg mass was calculated as the ratio between feed intake and egg mass produced.
At the end of each period, it was selected four eggs per replicate; two eggs were used for specific gravity and another two eggs were used to determine weight and percentage of yolk, albumen and shell. The percentage was calculated after manual separation of these components, and shells were oven dried at 105ºC for four hours. The percentage of each of the egg components was obtained by dividing the weight of the component by the weight of the egg, and then multiplying the result by 100.
At the end of each experimental period, two eggs per replicate were immersed in different saline solutions with appropriate adjustments to a volume of 25 L of water with densities that ranged from 1.060 to 1.100 with an interval of 0.0025 g cm-3. Eggs
were put in the buckets with the solutions, from the lowest to the highest density, and removed when they floated. The respective density values corresponding to the solutions of the containers were recorded. Haugh unit (HU) was determined by the formula: (HU) = 100 log (H + 7.57 – 1.7W0.37),
where H = height of the albumen (mm); and W = egg weight (g) (Silversides et al., 1993).. Albumen height was measured with a special micrometer. Shell thickness was measured with the aid of an analog micrometer accurate to 0.1 mm at three points along the midline of the egg, through which the arithmetic mean was calculated.
Nitrogen consumed, excreted and retained and nitrogen retention efficiency were determined by the method of total excreta collection using iron oxide as a marker. In the third period, feed intake was monitored by weighing the feed supplied, with addition of iron oxide, and leftovers at the end of the period assessed.
containers and taken to a forced-ventilation oven at 60 ± 5ºC. After drying, samples were weighed again, ground and kept in identified plastic containers until the analysis of dry matter and nitrogen in laboratory of Animal Nutrition (Animal Science Department/Agrarian Science Center/Federal University of Paraiba, Paraiba State, Brazil) (Silva & Queiroz, 2002).
The average daily of intake (NI) and excretion (NE) of nitrogen per experimental replicate were calculated by dividing the average daily input and output crude protein (CP), expressed in dry matter at 105ºC, by the factor 6.25. Average daily nitrogen retention (NR) was calculated as the difference between average daily input and output of N: NR=NI - NE. The percentage of nitrogen retention efficiency was calculated by the formula 100 - (NE x 100 NI-1) according to the
micro-Kjeldahl method.
At the end of the fifth period, birds were weighed for final weight, and two birds with the representative average weight of the replicate were selected for collection of approximately 10 mL of blood by cutting the jugular vein of the birds. The serum obtained after centrifugation of blood was stored at -20ºC for subsequent analysis of uric acid with a commercial kit Labtest S.A. (Lagoa Santa, Minas Gerais State, Brazil), and by reading on a spectrophotometer, according to the instructions of the manufacturer.
The animals in this study sacrificed by cutting the jugular vein were used for further study on morphological analysis of intestine, liver and reproductive tract.
The cost of feed (CF) in the period was calculated by dividing of feed intake (kg ton.-1) by
the cost per ton of ingredients. The dozen eggs (DE) was obtained by multiplying the percentage by 140 days of production, dividing by 100, and then by 12. The cost of feed per dozen eggs (CFDE) was obtained by dividing the cost of ingredients by DE. Gross revenue (GR) was calculated by multiplying the cost of an eggs dozen by the amount of dozen eggs produced by treatment. Gross margin (GM) was computed by reducing the GM by the feeding period ($ bird-1). The relative gross margin (RGM)
was calculated based on 100% for the first treatment, the RGM of the others treatments was calculated using the relationship between the CM of treatment x 100 divided by the previous treatment.
Statistical analyses were performed with the software Statistical Analysis System (SAS, 2004).
Data were subjected to analysis of variance and comparison of means by the tukey test at 5% probability.
Results and discussion
There were significant differences between treatments for egg production and egg weight. The treatment with 15.17% of CP + 0.341% L-glutamic acid promoted higher egg production than the control diet. However, the control diet had the highest values of egg weight than the other treatments (Table 2).
Table 2. Effect of treatments on final weight (FW), feed intake (FI), egg production (EP), egg weight (EW), egg mass (EM), and mass conversion produced (MCP) by laying hens.
Variables T1 T2 T3 T4 T5 T6 SEM CP (%) 17.00 15.50 14.00 15.17 15.74 16.32 IW (kg) 1.84 1.85 1.75 1.82 1.82 1.76 2.223 FW (kg) 1.66 1.74 1.69 1.70 1.76 1.72 8.131 FI (g bird-1 day-1) 110.8 111.1 110.8 110.5 110.2 109.0 2.642
EP (%) 88.4 b 92.1 ab 92.3 ab 94.3 a 91.2 ab 91.9 ab 3.841 EW (g) 67.3 a 64.9 ab 63.9 b 64.2 b 64.0 b 63.8 b 2.524 EM (g) 61.5 59.8 59.7 60.6 59.1 58.6 3.421 MCP (g/g) 1.80 1.85 1.85 1.82 1.86 1.86 3.271
SEM (%), Standard error of the mean; CP, Crude protein; IW, Initial weight. T1, 17% CP; T2, 15.5% CP; T3, 14% of CP; T4, 15.17% CP + 0.341% L-Glutamic acid; T5, 15.74% CP + 1.349% L-Glutamic acid; T6, 16.32% CP + 2.356% L-Glutamic acid. a,b Means followed by different letters in linesare statistically different by tukey’ test at 5% probability (p < 0.05).
Protein must be well balanced and of high quality so that the bird can maximize egg production in an economically feasible way. Egg weight is influenced by dietary protein as it is required to synthesize egg albumen, and a decrease in dietary protein may reduce the amount of albumen, leading to a smaller egg size
In this experiment, we observed that the control diet with the highest crude protein value (17%) resulted in higher egg weight in relation to the others treatments with glutamate. It was expected that supplementation with glutamate in diets with reduced CP would improve the egg weight, based on the greater amount of amino nitrogen available for the synthesis of non-essential amino acids (NEAA), sparing the essential amino acids (EAA) for protein synthesis in the animal organism.
Possibly, the reduction in egg weight has occurred due to the deficiency of some essential amino acids, probably cystine and methionine. At this stage of life, the requirement for feather cover may lead to a greater demand for cystine; in turn, methionine is required to form cystine, occurring the deficiency of two amino acids of great importance for egg weight.
promoted higher egg production than the control diet, showing that laying hens of 34-54 weeks of age presents better balance of amino acids in this treatment. Although the use of non-specific nitrogen sources to meet the synthesis of non-essential amino acids cannot be fully efficient for maximum protein utilization by the bird, because some non-essential amino acids are considered essential in some periods of the life cycle of the bird.
There was no significant effect for the variables internal and external quality of eggs assessed in this study (Table 3).
Table 3. Effect of treatments on specific gravity (SG), percentage of shell (PS), yolk (PY) and albumen (PA), and haugh units (HU) of eggs by laying hens.
Variables T1 T2 T3 T4 T5 T6
SEM CP (%) 17.00 15.50 14.00 15.17 15.74 16.32 SG (g cm-3) 1.085 1.086 1.086 1.085 1.086 1.086 0.151
PS (%) 9.50 9.52 9.95 10.12 9.81 9.69 5.232 PY (%) 25.2 26.0 26.6 26.5 26.5 26.7 4.812 PA (%) 64.6 62.7 64.1 63.9 63.9 63.3 2.601 HU 96.7 95.3 95.8 96.1 95.1 96.2 2.103
SEM (%), Standard error of the mean; CP, Crude protein. T1, 17% CP; T2, 15.5% CP; T3, 14% CP; T4, 15.17% CP + 0.341% L-Glutamic acid; T5, 15.74% CP + 1.349% L-Glutamic acid; T6, 16.32% CP + 2.356% L-Glutamic acid. No significant for analysis of variance.
There are no results in the literature with glutamic acid supplemented in diets with protein reduction involving commercial layers. In this experiment, the specific gravity, percentages of shell, yolk, and albumen
and haugh unit of eggs of laying hens showed good
values in all treatments with glutamic acid. However, the results of treatments supplemented with glutamate were similar to the Control diet.
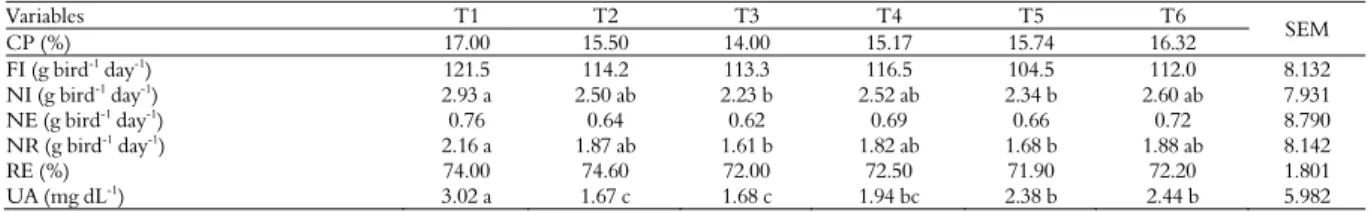
Average values for three days of feed intake for nitrogen intake, excreted nitrogen, nitrogen retention, retention efficiency of nitrogen and serum uric acid of laying hens (Table 4).
There was a significant difference between treatments for nitrogen consumed and retained, and serum uric acid of laying hens. The control diet had higher nitrogen intake and retention than the treatments with 14.00% CP (T3) and 15.74% CP + 1.349% L-glutamic acid (T5).
However, the control diet had the highest values of acid uric in the blood compared to the other treatments studied. In sequence, the results of acid
uric was higher for the control diet (T1), followed by the treatments with 16.32% CP + 2.356% of L-glutamic acid (T6) and 15.74% CP + 1.349% of L-glutamic acid (T5). The treatments with 15.5% CP (T2) and 14% CP (T3) showed the lowest results for uric acid, but not different from each other and from the treatments with 15.17% CP + 0.341% L-glutamic acid (T4).
Pavan et al. (2005) evaluated protein reduction (17, 15.5 and 14% CP) in brown-egg hens and observed that the ingestion of diets with 14% CP, reduced nitrogen excretion by 27% as compared with diets with 17% CP. In the same way, Ishibashi and Yonemochi (2003) studied amino acid requirement and protein reduction on egg production and nitrogen excretion and observed an evident drop in nitrogen excreted when dietary protein was reduced.
In this study, although without no significant effect on nitrogen excretion, it can be observed that, in relation to the control diet with 17% CP, all treatments with protein reduction (15.5, 14, 15.17, 16.32 and 15.74% CP) showed lower excretion of nitrogen (12, 14,7,10, 4%) to the environment, respectively.
Birds excrete nitrogen in small amounts of water by means of uric acid as the main product of nitrogen metabolism, it is 60-80% of nitrogen excreted in the urine, while in other species it is excreted urea. Uric acid is synthesized in the liver and kidneys, approximately 90% are excreted via tubular secretion, irrespective of tubular reabsorption of water.
Uric acid is the main catabolic product of proteins, protein nitrogen and purine in birds. Normal levels of uric acid in young birds may range from 1 to 2 mg dL-1, while laying birds have levels
from 2 to 7 mg dL-1. According to Kaneko et al.
(2008), in Brown Leghorn hens, the large differences in uric acid rates may be related to age, diet, hydration status of birds and species. Its concentration is elevated when the renal function is impaired, decreasing its elimination through the kidneys. There may be increased levels of uric acid, creatinine, and urea in plasma when the kidneys work at 30% capacity (Schmidt et al., 2007).
Table 4. Average values for three days of feed intake (FI) about nitrogen intake (NI), nitrogen excreted (NE), nitrogen retention (NR), retention efficiency (RE) and serum uric acid (UA) of laying hens.
Variables T1 T2 T3 T4 T5 T6
SEM
CP (%) 17.00 15.50 14.00 15.17 15.74 16.32
FI (g bird-1 day-1) 121.5 114.2 113.3 116.5 104.5 112.0 8.132
NI (g bird-1
day-1
) 2.93 a 2.50 ab 2.23 b 2.52 ab 2.34 b 2.60 ab 7.931
NE (g bird-1 day-1) 0.76 0.64 0.62 0.69 0.66 0.72 8.790
NR (g bird-1 day-1) 2.16 a 1.87 ab 1.61 b 1.82 ab 1.68 b 1.88 ab 8.142
RE (%) 74.00 74.60 72.00 72.50 71.90 72.20 1.801
UA (mg dL-1) 3.02 a 1.67 c 1.68 c 1.94 bc 2.38 b 2.44 b 5.982
In this study, it is observed that the control diet (17% CP) had the highest value of uric acid (3.02) compared to other treatments, but within the normal range for laying hens, indicating no kidney problems. However, treatments with 15.5,14, 14, 15% CP showed lower values than normal (1.67, 1.68, 1.94), respectively, due to the low protein in diet that were not sufficiently degraded to meet the requirement of laying hens in production.
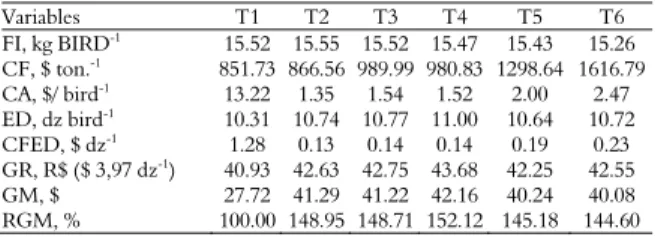
The results of the economic analysis are in accordance with the performance, where the best results were observed in the treatment 4, with 15.17% CP + 0.341% L-glutamic acid (Table 5).
Table 5. Effect of treatments on the economic analysis of laying hens.
Variables T1 T2 T3 T4 T5 T6
FI, kg BIRD-1 15.52 15.55 15.52 15.47 15.43 15.26
CF, $ ton.-1 851.73 866.56 989.99 980.83 1298.64 1616.79
CA, $/ bird-1
13.22 1.35 1.54 1.52 2.00 2.47 ED, dz bird-1 10.31 10.74 10.77 11.00 10.64 10.72
CFED, $ dz-1 1.28 0.13 0.14 0.14 0.19 0.23
GR, R$ ($ 3,97 dz-1) 40.93 42.63 42.75 43.68 42.25 42.55
GM, $ 27.72 41.29 41.22 42.16 40.24 40.08 RGM, % 100.00 148.95 148.71 152.12 145.18 144.60
T1, 17% CP; T2, 15.5% CP; T3, 14% CP; T4, 15.17% CP + 0.341% L-Glutamic acid; T5, 15.74% CP + 1.349% L-Glutamic acid; T6, 16.32% CP + 2.356% L-Glutamic acid. CF, Cost of feed; ED, Eggs Dozen; CFED, Cost of feed for eggs dozen; GR, Gross revenue; GM, Gross margin; RGM, Relative gross margin. Price of ingredients collected on Guaraves Alimentos Ltda at 7/2013. Price of dozen of eggs collected on avisite.com.br at 1/2014.
The treatment with 15.17% of CP and supplementation Dmethionine, lysine, L-valine, L-isoleucine, L-tryptophan and with 0.341% L-glutamic acid for Dekalb Brown hens with 34-54 weeks age proved to be more effective with the addition of essential amino acids and glutamic acid (non-essential amino acid), it was possible a reduction of 1.83 percentage points of crude protein and improved egg production, maintenance in weight, and internal and external quality eggs with lower cost in the production of laying hens with this treatment.
Conclusion
It is recommended the treatment with 15.17% CP + 0.341% L-glutamic acid, as it improved the performance and the economic analysis without changing the quality of egg and amount of nitrogen excreted to the environment.
References
Aftab, U., Ashraf, M. & Jiang, Z. (2006). Low protein diets for broilers. World's Poultry Science Journal, 62(04), 688-701.
Berres, J., Vieira, S. L., Dozier, W. A., Cortês, M. E. M., De Barros, R., Nogueira, E. T. & Kutschenko, M. (2010). Broiler responses to reduced-protein diets supplemented with valine, isoleucine, glycine, and
glutamic acid. The Journal of Applied Poultry Research, 19(1), 68-79.
Burrin, D. G. & Stoll, B. (2009). Metabolic fate and function of dietary glutamate in the gut. The American
journal of clinical nutrition, 90(3), 850S-856S.
Dean, D. W., Bidner, T. D. & Southern, L. L. (2006). Glycine supplementation to low protein, amino acid-supplemented diets supports optimal performance of broiler chicks. Poultry Science, 85(2), 288-296.
Furuya, W. M., Botaro, D., Macedo, R. M. G., Santos, V. G., Silva, L. C. R., Silva, T. C., ... Sales, P. J. P. (2005). Aplicação do conceito de proteína ideal para redução dos níveis de proteína em dietas para tilápia-do-nilo
(Oreochromis niloticus). Revista Brasileira de Zootecnia,
34(5), 1433-1441.
Ishibashi, T. & Yonemochi, C. (2003). Amino acid nutrition in egg production industry. Animal Science
Journal, 74(6), 457-469.
Kaneko, J. J., Harvey, J. W. & Bruss, M. L. (2008). Clinical
biochemistry of domestic animals (Vol. 1). New York:
Academic press.
Li, P., Yin, Y.-L., Li, D., Woo Kim, S. & Wu, G. (2007). Amino acids and immune function. British Journal of
Nutrition, 98(2), 237-252.
Pavan, A. C., Móri, C., Garcia, E. A., Scherer, M. R. & Pizzolante, C. C. (2005). Níveis de proteína bruta e de aminoácidos sulfurados totais sobre o desempenho, a qualidade dos ovos ea excreção de nitrogênio de poedeiras de ovos marrons. Revista Brasileira de
Zootecnia, 34(2), 568-574.
Rocha, T. C., Gomes, P. C. & Donzele, J. L. (2009). Níveis de lisina digestível em rações para poedeiras no período de 24 a 40 semanas de idade. Revista Brasileira
de Zootecnia, 38(9), 1726-1731.
Rostagno, H. S., Albino, L. F. T., Donzele, J. L., Gomes, P. C., Oliveira, R. d., Lopes, D. C., Ferreira, A. S., Barreto, S. & Euclides, R. F. (2005). Composição de alimentos e exigências nutricionais Tabelas brasileiras
para aves e suínos (Vol. 2).
SAS. (2004). SAS/STAT User guide, Version 9.1.2. Cary, NC, USA: SAS Institute Inc.
Schmidt, E., Locatelli-Dittrich, R., Santin, E. & Paulillo, A. C. (2007). Patologia clínica em aves de produção-Uma ferramenta para monitorar a sanidade avícola-Revisäo. Archives of Veterinary Science, 12(3), 9-20. Silva, D. J. & Queiroz, A. C. (2002). Análise de alimentos:
métodos químicos e biológicos (3a ed.). Viçosa, Minas
Gerais, Brasil: Universdiade Federal de Viçosa. Silversides, F. G., Twizeyimana, F. & Villeneuve, P.
(1993). Research note: a study relating to the validity of the Haugh unit correction for egg weight in fresh eggs. Poultry Science, 72(4), 760-764.
Received on October 29, 2014. Accepted on February 2, 2015.