Angelo Miguel da Silva Alves
Spatial Representation of
Public Displays Networks
Ang
elo Miguel da Silv
a Alv es Spatial R epr esent ation of Public Displa ys Ne tw or ks
Tese de Mestrado
Ciclo de Estudos Integrados Conducentes ao
Grau de Mestre em Engenharia de Comunicações
Trabalho efetuado sob a orientação do
Professor Doutor Rui José
Professor Doutor Adriano Moreira
Angelo Miguel da Silva Alves
Spatial Representation of
Public Displays Networks
Universidade do Minho
“Dictionary is the only place that success comes before work. Hard work is the price we must pay for success. I think you can accomplish anything if you’re willing to pay the price.”
Acknowledgments
Firstly, I would like to express my deepest gratitude to my family. Without their love and support, all of this would not have been possible. Also a special thank to the Proença/Rocha family for all the support over these years.
I would like to thank my supervisors, Professor Adriano Moreira and Rui José, for the help, patience and guidance, which was essential for the accomplishment of this work.
I would also like to thank all my friends that, in one way or another, contributed for this work to be accomplished. A special thanks to Nuno Mendes, Sergio Silva and Rui Ferraz for all the help in the programming, and to Carina Boavida for reviewing my thesis.
I would like to express my deepest gratitude to my division (DRA/FRD) in Portugal Telecom for all the understanding, comprehension and support during all these months.
Finally, I also would like to give a very special thanks to Magda Gomes for all the support, patience and for being by my side all these days.
Representação espacial de redes de
ecrãs públicos
Resumo
Este trabalho faz parte do projeto Europeu Pd-Net e tem como objectivo identificar e abordar os desafios tecnológicos e de investigação relacionados com a criação de redes, em larga escala, de ecrãs públicos e sensores associados.
O aparecimento das redes de larga escala de ecrãs públicos irá representar uma mudança significativa no modo como pensamos sobre a disseminação de informação em espaços públicos e criará uma nova área de investigação, as bases para um novo meio de comunicação e novas oportunidades de negócio. De igual modo, é esperada uma mudança nos espaços públicos para espaços inteligentes que podem ser ajustados para refletir as esperanças, aspirações e interesses dos ocupantes que utilizam o conteúdo e as aplicações criadas em qualquer parte da rede.
Um dos pontos-chave da rede de ecrãs públicos é a possibilidade de endereçar a rede como um todo e focar nas relações espaciais entre os ecrãs.
Spatial representation of public
displays networks
Abstract
This work is part of Pd-Net, a European project that aims to explore the scientific challenges and new technologies required to enable the emergence of large scale networks of pervasive public displays and associated sensors that are open to applications and content from many sources. The emergence of such pervasive display networks would represent a radical transformation in the way we think about information dissemination in public spaces and will create a new research area, provide the foundations for a new communication medium and new business opportunities. In the same way, it is expected a change from public spaces – from today’s environments in which information is pushed to passers-by in the form of adverts – to spaces that can utilise ambient intelligence to be tailored to reflect the hopes, aspirations and interests of its occupants using content and applications created anywhere in a global network.
One of the interesting features of pervasive displays networks is the possibility to address the network as a whole and to focus on the spatial relations between displays.
Contents
1. Introduction ... 15 1.1. Contributions ... 16 1.2. Motivating scenarios ... 17 1.3. Thesis outline ... 18 2. Location concepts ... 192.1. Location Sensing Techniques ... 20
2.1.1. Triangulation/trilateration ... 20
2.1.2. Proximity ... 21
2.1.3. Scene analysis ... 22
2.2. Geometric and symbolic coordinates ... 22
2.3. Absolute location systems ... 23
2.4. Relative location systems ... 23
2.5. Accuracy ... 24
2.6. Precision ... 24
2.7. Features of location models ... 24
2.7.1. Location queries ... 24
2.7.2. Nearest neighbour queries ... 25
2.7.3. Navigation ... 25 2.7.4. Range queries ... 25 2.7.5. Key properties ... 25 2.8. Chapter Summary ... 27 3. Related work ... 29 3.1. Location models ... 30
3.1.1. Geometric location models ... 30
3.1.2. Symbolic location models ... 31
3.2. Public displays ... 37
3.3. Chapter summary ... 39
4. Requirements ... 41
4.1. Usage patterns ... 42
4.1.1. Location based displays ... 44
4.1.2. Spatially coordinated displays ... 45
4.1.3. Navigation ... 45
4.1.4. Spatially aware displays ... 46
4.2. Spatial requirements ... 47
4.2.1. Absolute location ... 48
4.2.2. Relative location ... 50
4.2.3. Topological information for the display’s environment ... 51
4.2.4. Display orientation ... 52
4.2.5. Display surroundings ... 53
4.2.6. Display attributes and status ... 54
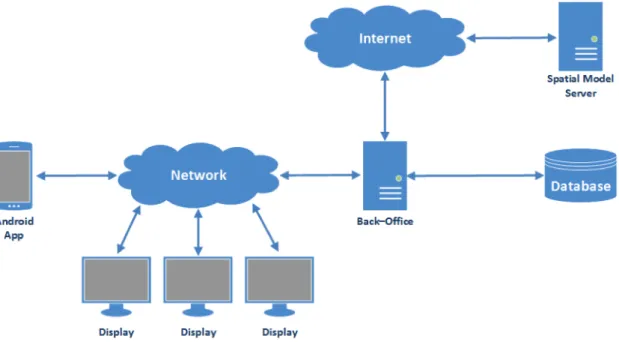
4.3. Chapter summary ... 55 5. System architecture ... 57 5.1. Assumptions ... 58 5.1.1. Network ... 58 5.1.2. Back Office ... 59 5.1.3. Database ... 61
5.1.4. Spatial model server ... 62
5.2. Solution modules ... 65 5.2.1. Authentication ... 66 5.2.2. Association ... 66 5.2.3. Orientation ... 67 5.2.4. Location ... 68 5.2.5. Space ... 68 5.2.6. Surroundings ... 69 5.3. Chapter summary ... 69 6. Application ... 71 6.1. Dependencies ... 72
6.1.2. Google Maps ... 73
6.1.3. Wi-Fi & mobile network location ... 74
6.1.4. Internet connection ... 74 6.2. Server connection ... 75 6.3. Permissions ... 76 6.4. Association/Authentication ... 77 6.5. Orientation ... 80 6.6. Location ... 82 6.7. Space ... 83 6.8. Relative Location ... 84 6.9. Chapter summary ... 86 7. Discussion ... 87 7.1. Display’s registration ... 88 7.2. Missing Child ... 99 7.3. Emergency evacuation ... 103 7.4. Chapter summary ... 107
8. Conclusion and outlook ... 109
8.1. Concluding remarks ... 110
8.2. Future research and challenges ... 111
List of Figures
2-1. Lateration ... 20
2-2. Angulation ... 21
3-1. Set-based model ... 31
3-2. Hierarchical lattice-based model ... 32
3-3. Graph-based model ... 33
3-4. Combined symbolic model ... 33
3-5. Levels of details ... 33
3-6. Subspaces model ... 35
3-7. Partial subspaces model ... 35
5-1. System architecture ... 58
5-2. QRCode and plain text Ids ... 59
5-3. Database ER model ... 61
5-4. Symbolic contextualizer browser ... 64
5-5. Symbolic contextualizer space editor ... 64
5-6. Application modules ... 65
5-7. Horizontally, vertically landscape and vertically portrait orientation ... 67
5-8. Relations and orientation ... 67
6-1. Google maps mobile SDK Key ... 72
6-2. Google maps mobile SDK Key added to the project. ... 73
6-3. Method that evaluates the Google Play Service status. ... 73
6-4. Method that evaluates the Google Maps status ... 74
6-5. Method that evaluates the Wi-Fi & mobile network location option ... 74
6-6. Method that evaluates the Internet connection status ... 75
6-8. Internet dependency information ... 75
6-9. getInstance method ... 76
6-10. Required permissions ... 77
6-11. Application requesting an IP address ... 78
6-12. Network domain information ... 78
6-13. User’s authentication ... 79
6-14. Input method’s list ... 79
6-15. New display ... 80
6-16. Known display ... 80
6-17. Orientation ... 81
6-18. Accelerometer 3-axis coordinate system ... 81
6-19. Display’s location ... 82
6-20. Level attribute ... 84
6-21. Vertical oriented ... 85
6-22. Horizontal oriented ... 85
7-1. Engineering school first floor plan ... 88
7-2. BO IP address ... 89 7-3. Domain information ... 89 7-4. User authentication ... 90 7-5. Input methods ... 90 7-6. Display’s Id ... 90 7-7. New display ... 90 7-8. Existing display ... 91 7-9. Main menu ... 91 7-10. Display’s orientation ... 92
7-12. Orientation defined ... 93 7-13. Orientation defined ... 93 7-14. Display’s location ... 93 7-15. Useful information ... 93 7-16. Location defined ... 94 7-17. Location defined ... 94
7-18. Search for Engineering ... 95
7-19. Search’s result ... 95
7-20. Space’s floors ... 96
7-21. First floor’s areas ... 96
7-22. Space defined ... 96
7-23. Space defined ... 96
7-24. Surrounding step ... 97
7-25. Emergency Exit key element ... 97
7-26. Surroundings defined ... 98
7-27. Surroundings defined ... 98
7-28. Information’s resume ... 98
7-29. Engineering school floor plan ... 99
7-30. Missing child first step ... 100
7-31. Missing child second step ... 101
7-32. Missing child third step ... 101
7-33. Missing child fourth step ... 101
7-34. Missing child fifth step ... 102
7-35. Missing child sixth step ... 102
7-36. Space floor plan ... 103
7-38. Evacuation second step ... 105
7-39. Blocked path ... 105
7-40. Evacuation third step ... 106
7-41. Blocked path ... 106
List of Tables
4-1. Scenarios and spatial requirements ... 31 7-1. Emergency exit directions relatively to the display’s location ... 85
Introduction
1. Introduction
The debate over large-scale networks of pervasive public displays is earning a considerable attention, but in fact it is still an area in its infancy. In comparison to static signage, pervasive displays have more advantages as they can be used with different purposes.
Typically static signage has only one purpose and in order to change or update the information that is being given, new signage has to be created and deployed. However, it takes some time to firstly, identify when a static signage needs to be updated or created and secondly, to place or replace it. During that time, incorrect, incomplete, ambiguous, or even no information is given. Furthermore, the way in which the static signage is placed has a strong impact in the information quality, as it is desirable that the information is given in a clear and unambiguous way. Another issue is related to temporary events, given that new and specific signage has to be created and placed to provide information or directions about the event. But when the event ends, all the created signage has to be removed. However, since it is time consuming and it represents significant costs, in most cases the signage is not removed and stays visible presenting wrong and unusable information. Despite of this, static signage is still widely used.
At the same time a public display entails dynamic solutions that allow presenting, varying and updating the available information without involving any infrastructure costs. When there is the need to modify or update the information being displayed this can be done almost immediately, and consequently the most up to date and accurate information is always provided. This capability represents an advantage over static signage and it can be even more important in emergency scenarios, where updated and precise instructions/information can be given to help people in a more effective way. Moreover, when a specific event takes place the displays can be used during that period to provide information and/or give guidance to the event. When the event ends the displays can be used to display other information. Public displays, unlike
static signage, can be used to serve multiple purposes e.g. personalized navigation, shopping assistance, advertising, context aware, emergency scenarios etc.
Nevertheless, to enable this dynamic solution a public network of displays has to be set up to provide a service infrastructure. The information showed on the display needs to be adjusted to new conditions and to the surrounding environment. The display’s location and orientation has to be known and so a suitable and generic spatial location model has to be developed. The emergence of such possibility will definitely represent a huge change in the way we all think and see the information propagation in public spaces. The European project (Pd-Net) intends to explore the scientific challenges and technologies that will be needed to enable pervasive display networks and associated sensors. This will represent several new opportunities at different levels of research.
1.1. Contributions
The main purpose of this thesis is to specify a suitable, simple and generic spatial model to associate the display medium within its spatial location. A spatial model will enable the displays on a public network to spontaneously support applications that require knowledge about the location and orientation of the display. It will be generic without limiting any application or system to get the information needed about the displays. It should allow the inclusion of any sensor technology already available or that will be available in the future. Therefore, the main goals of this thesis are the following:
• Identify the spatial requirements that are imposed not only to the spatial model but also to the characterization of the displays;
• Develop a spatial model that enables spatial relations between displays and their physical location (location within an indoor space);
• Develop a mobile application to perform the display’s registration, i.e. generate and collect the display’s spatial information;
• Develop a solution that enables applications to understand the geometric and spatial relations between displays in order to achieve their goals;
Introduction
1.2. Motivating scenarios
The following scenarios show how spatial representation of public displays networks can be used in real-world applications. The scenarios share the need for a spatial model that associates the display medium and its spatial placement, enabling the displays on a pervasive network to spontaneously support applications that require some knowledge about the specific placement and orientation of the display. The scenarios are the following:
• Locally Sourced Emergency Information - Missing Child Alerts
Sue realizes she has lost her daughter Millie in the local shopping centre. She immediately calls the local police who ask her to send them a recent photo from her mobile phone. Within seconds all of the displays in the shopping centre are showing a photograph of Millie together with a number to call. As the minutes pass the photographs spread over an ever-increasing area – reflecting how far away Millie might be. Five minutes after the first call Millie and her mum are reunited after being found by a fellow shopper who recognized her photo from the screen.
• Emergency Evacuation – Responding to a Terrorist Incident
Imagine the Emergency Services are handling a suspected terrorist incident involving an explosion in a major city. The local command centre selects the epicentre of the incident and initiates evacuation of the area. Immediately all of the public displays in the city – not just those owned by the council but all displays - fall under the control of the command centre. Displays seen as people travel toward the emergency warn them to turn away whereas displays seen while travelling away provide helpful navigation instructions to safe areas.
• Interactive Applications – Information in an Unfamiliar City
Brian has not been to Bulgaria before, but the flight was certainly cheap, and since he knows they joined the European Union he feels sure they must speak English. It was with some surprise then that Brian found he was almost entirely unable to read
the Bulgarian signs. Fortunately, since 2011 Sofia has joined many of its municipal displays to a global network. Brian walks up to one of these and immediately it recognises that he’s foreign, switches to English and offers him helpful advice about nearby hotels and attractions. He can see notes and reviews from other tourists. He sets the “Casa Ferrari B&B” as his destination and now gets additional guidance as he passes further displays reassuring him that he’s on the right track. Brian is beginning to feel more confident in this unusual but beautiful country.
1.3. Thesis outline
This thesis is divided in eight chapters.
Chapter 1 introduces the motivation, the main contributions and the motivating scenarios of this research project.
Chapter 2 presents the fundamental location concepts related and used throughout this work.
In the Chapter 3 a selected number of publications from the location modelling and public displays are described and related to our work.
The Chapter 4 presents the identified display’s usage patterns and the spatial requirements that are imposed to the display’s categorization.
In the Chapter 5 the system architecture, the assumptions made in this work and the modules of our proposed solution are presented.
The Chapter 6 presents how the application to collect the required display’s spatial information was implemented.
Chapter 7 reports the obtained results and evaluates them in light of the initially proposed objectives.
Finally the Chapter 8 concludes the document by revisiting the thesis statement, providing a list of published papers and suggesting future developments.
Location concepts
2. Location concepts
Before we review the related work we need to introduce some basic concepts that will be used throughout this work. The title of this thesis – Spatial representation of public displays network – highlights two key areas of interest: spatial location concepts and spatial model. This chapter starts with an overview over the three location-sensing techniques that are used to determine the location of a given object (section 2.1). Since the location of the display can be defined in the form of geometric or symbolic coordinates, the properties of both coordinates are presented (section 2.2). Then an overview over absolute/relative location systems (section 2.3), accuracy (section 2.4) and precision (section 2.5) is presented. The last section of this chapter presents the features of the location models, i.e. the queries that a location model should be able to reply.
2.1. Location Sensing Techniques
In order to identify the objects’ location, at least one location sensing technique has to be used. The three main location-sensing techniques are: triangulation/trilateration, proximity and scene analysis. These techniques can be used individually (the location of the object is estimated through just one technique) or combined (location-sensing techniques are combined to estimate the objects’ location).
2.1.1. Triangulation/trilateration
The triangulation sensing technique calculates the object’s location through the geometry properties of triangles. Depending on how the calculation is performed – if through distances or angles – the triangulation is divided into two sub-categories, lateration and angulation. In lateration the object is located by measuring its distance relatively to multiple reference points. If the location is calculated in two dimensions (2D), three non-collinear points are required to guarantee that there is only one point where the circumferences – formed in each point – intercept each other and then the object’s location is identified (see Figure 2-1). On the other hand, if the location is calculated in three dimensions (3D), four non-coplanar reference points are required.
Location concepts
In angulation, the object’s location is not determined by distances measurements but rather by angles. If the location is calculated in two dimensions (2D), two angles and the distance between the two points where the angles are formed are required. If the location is calculated in three dimensions (3D) then one length, one azimuth and two angles measurements are required to achieve a precise object’s location. Some implementations of angulation define a constant reference vector as 0º. In the Figure 2-2 it is possible to observe an implementation of 2D angulation with a constant reference vector.
2.1.2. Proximity
In proximity sensing techniques the objects’ location is determined through the proximity of the object to known locations. The proximity is sensed through some sort of physical phenomenon, typically with short range to sense the object in a more precise way. However, if multiple objects are sensed then an identification mechanism is required to identify each one. The three major proximity-sensing techniques are: physical contact, monitoring wireless access points and observing automatic ID systems.
Physical contact is one of the most basic proximity-sensing techniques, in which
the object is located through the physical contact between the object and the sensor. Since the sensors’ location is known, the object’s location is inferred when the physical contact occurs.
Monitoring wireless access points detects the object when it is within the range
of one or more access points. The location of the access points as well as the signal power at that location, are known. Thus, the object is located through the variation of
the signal’s power, as the distance between the object and the access points increases, the weaker the signal’s power becomes.
Observing automatic ID systems determines the objects’ location through
automatic identification systems - such as credit cards point-of-sale, computer logins histories, landline telephone records, etc. – that are able to scan the object. Since the location of these automatic identification systems is known, the objects’ location is inferred.
2.1.3. Scene analysis
In scene analysis, the characteristics of the scene being observed through a vantage observation point are used to identify the location of the object. The scene being observed is usually simplified to obtain features that are easier to represent and compare. Scene analysis is divided into two sub-categories: static scene analysis and differential scene analysis.
In static scene analysis, the scene being observed is compared with a predefined reference observation of that scene. This predefined observation is recorded in a database and any difference between the predefined and the current observation indicates the object’s location.
In differential scene analysis, successive scenes are observed and compared to identify any difference between them. The difference between the scenes indicates the location of the object and the objects movement.
2.2. Geometric and symbolic coordinates
In the previous section it was presented how the location of an object can be determined, in this section it will be presented how it can be defined. Two types of coordinates can be used to define the object’s location: geometric and symbolic.
In geometric coordinates the object’s location is defined as a set of coordinates relatively to a specific coordinate system. Geometric coordinates can be divided in global and local physical coordinates. Global coordinates are able to determine the location of an object worldwide as the Global Positioning System (GPS) uses a global reference system (WGS84) On the contrary, local coordinates entail a local solution
Location concepts
with limited range, such a room or building where the system is implemented. In this case the object’s location is only achieved within that space.
Geometric coordinates properties:
− Fine-grained location information;
− Allow distance calculation between two points;
− Allow to determine if different areas overlap, touch or contain each other; − Allow simple spatial reasoning.
In symbolic coordinates, the object’s location is defined as a set of abstracts symbols or ideas of where the object is. For instance, the symbolic information of an object can be defined as “University of Minho, School of Engineering, Laboratory 3”.
Symbolic coordinates properties:
− Coarse-grained location information;
− Distance calculation between two coordinates is not achieved directly;
− To determine if different areas overlap, touch or contain each other, further information is required.
2.3. Absolute location systems
In absolute location systems, a shared reference for all objects being located is used. This means that all objects in the same location will report the same or much approximated location information. The GPS is an example of an absolute location system, since two different GPS receivers achieve the same or much approximated location information if they are at the same location.
2.4. Relative location systems
In relative location systems, each object can have its own reference. For example, in an emergency scenario each hand-held computer of each rescue team
element is able to determine the location of the victims relatively to it. This means that each computer has its own relative location system.
2.5. Accuracy
Accuracy is the average difference between the object’s real location and the location achieved by the location system. If this difference is small, then the system is accurate (fine-grained). As the difference increases the system starts to lose accuracy (becoming coarse-grained). A system that provides a difference of 1 meter is more accurate than the one that provides a difference of 5 meters.
2.6. Precision
Precision represents how often a certain level of accuracy is expected. This means that, it is the percentage of times that a system is able to provide – overtime – the same or much approximated location information of an object in the same location. A system that provides 99% of the times the same location information to the same object’s location is more precise than a system that provides 70%.
2.7. Features of location models
Depending on the application type and requirements, a set of queries and tasks are imposed, which will lead to the location model that has to be used. Hence, these queries and tasks have to be defined and considered before assessing the functional requirements for the location models.
2.7.1. Location queries
Every location-based and context-aware system requires the location of objects, thus a location query is mandatory. Hence, all models have to be able to answer this query despite the fact that each model defines the objects’ location differently, by using different coordinate reference systems – global or local – and different coordinates – geometric or symbolic.
Location concepts
2.7.2. Nearest neighbour queries
Nearest neighbour queries search and retrieve the objects that are closest to a given location. In order to identify which is/are the nearest object(s), a distance function is required to compare the distances and identify the nearest objects. If it is true that calculating the distance between geometric coordinates is relatively simple – just perform some calculations – the same is not valid for symbolic coordinates (i.e. additionally information is required).
2.7.3. Navigation
Navigation systems require a location model to find /identify the paths between two locations. To calculate the path it is mandatory to know how the different locations are connected, thus a “connected to” relation has to be modelled. This relation enables the navigation query to calculate and determine the path between the two given locations. Different paths can be calculated depending on the requirements that are specified, it can be the fastest path, shortest path, most suitable path (e.g. handicap users) among others. Therefore, additional information like the distance between locations and the type of connection between locations are required.
2.7.4. Range queries
Range query return all objects that are within a certain range of a given location. If geometric coordinates are used, finding the objects that are within a specified range is straightforward, because it just needs to verify if the distance to the objects is less or equal than the specified range to the given location. In contrast, if symbolic coordinates are used, the topological “contains” relation has to be explicitly defined.
2.7.5. Key properties
Through the previous queries and tasks it is possible to achieve the following key properties for the locations model. Nonetheless, it is important to notice that not all of these properties have to be fulfilled at the same time, unless it is truly demanded by the system/application. Therefore, it is important to identify which are the properties needed by the system/application, and based on that, select the most suitable model. To
support the location, nearest neighbour and range queries, a location model should provide:
1. Object’s location defines the location of the objects in the form of symbolic or geometric coordinates, in accordance with the coordinate reference system used, which can be global or local.
2. Distance function models the distance between spatial objects. The distance can correspond to the length of the path that connects two locations (e.g. a corridor) thus, in these cases it corresponds to the distance a user has to travel.
3. Topological relations define the spatial containment and spatially connected relations. The spatial containment relation enables range queries, while the spatially connected relation enables and is used for navigation.
4. Orientation defines the vertical and/or horizontal dimensions, as well as, landscape and/or portrait orientation.
Even though the previous requirements are important and in some cases crucial to the systems/applications, they should not be achieved through high modelling effort. The modelling effort is defined via the accuracy, level of detail and scope elements.
Accuracy defines how accurate the model describes the world, how the model is created and updated and the dynamics of the objects being modelled. The dynamic of the objects indicates how frequently their information needs to be updated.
Level of detail describes the precision or granularity of the model, which can be fine-grained or coarse-grained.
Scope defines the area covered by the model, which can be local or global. The level of detail and the scope are related, since a model that provides a high level of detail usually has a local scope, otherwise the modelling effort is high or very high. On the other hand, when the scope is global the level of detail is usually low.
Location concepts
2.8. Chapter Summary
In this chapter we presented the basic terms and concepts that will be used throughout this work. We first introduced fundamentals location concepts to determine the objects’ location through triangulation, proximity or scene analysis. The two different types of coordinates, symbolic or geometric, were presented as well as the relative and absolute location systems. In this context we also presented the main difference between accuracy and precision of the location information.
Furthermore, we presented the features of location models that had to be taken into account when selecting the location model. The features presented were the location queries, nearest neighbour queries, navigation, range queries and key properties.
Related work
3. Related work
In this chapter we perform a review over the work related with this thesis’ topic. The two main topics of this work are: the public displays and their spatial representation. Therefore, this chapter is divided in two sections: Locations models (section 3.1) and Public displays (sections 3.2). In the first section we intend to identify the different types of location models along with their advantages and disadvantages in order to select the approach that is going to be followed in this work. Afterwards, a review over the literature that uses public displays was performed to perceive how the displays are used, the goals of such uses, which services use the displays and if such uses impose any spatial requirement.
3.1. Location models
Location models (also known as world models or space models) became a crucial topic in ubiquitous computing. They represent the state of the world, i.e. contain the information regarding places, people, objects and the relations between them. Based on the features defined in the previous section a location model should provide: the object’s location (regardless if it is defined in geometric/symbolic coordinates and in a local/global coordinate system), the distance between objects and the topological relations of containment, interception and connection. In the ubiquitous computing scope, the location models play an important role in tracking people/objects and identifying the most suitable devices to perform the interactions with the different context-aware applications.
Based on Becker and Dürr et al., (2005) and Domnitcheva et al., 2001, the locations models can be classified in: geometric, symbolic and hybrid location models. However, some authors make the distinction between topological (Brumitt and Shafer et
al., 2001) or semantic (Pradhan et al., 2000) world models and metric models.
3.1.1. Geometric location models
Geometric location models define the locations as geometric figures and contain points, lines and polygons that are characterized by metric and non-metric attributes. If multiple coordinate systems are used (e.g. a global coordinate system is combined with multiple local coordinate systems), the location and orientation information has to be defined in a way that enables the translation between the multiple systems. The
<<containment in>> relation and the distance between locations are inferred through
mathematical calculations. However, the <<connected to>> relation cannot be achieved through mathematical calculations, hence it has to be defined explicitly.
The EasyLiving project presented by Brumitt et al., (2000) implements a geometric location model for indoor spaces to provide a location-based context and it is focused in developing an architecture and technologies for intelligent environments. The project’s main goal is to identify and track the devices within a given space in order to make the interaction between the user and the devices easier. To perform the interaction, it is not required that the user knows the exact name of the device(s), instead
Related work
the user just needs to know the device’s type and location. To attain the necessary information a set of sensors is spread around the space.
3.1.2. Symbolic location models
Symbolic location models represent the location of the objects and things as abstract ideas or symbols. According to Becker and Dürr et al., (2005) the symbolic location models can be divided in: set-based, hierarchical, graph-based and a combination of graph and set-based.
The set-based model relies on a set L of symbolic coordinates. Locations containing several symbolic coordinates are defined by subsets of the set L. For example, the set L of the second floor represented in the Figure 3-1 can be defined as LFloor2 = [2.002, …, 2.075], additionally subsets of LFloor2 can be created as required, e.g.
LocationA = [2.002, 2.003]. The <<overlapping>> relation is determined through the interception between sets, i.e. if L!∩ L!= ∅ it means that the set LA and the set LB do
not overlap, whereas if L!∩ L!≠ ∅ it means they overlap. The <<containment>> relation is also determined through the interception between the sets, i.e. if L!∩ L!=
L! it means that L! contains L!. This model only supports a qualitative notion of distance that is achieved by modelling sets of “neighbouring” symbolic coordinates, quantitative notion of distance is not supported. Therefore, this model offers a limited support for queries related with spatial distances (such as the nearest neighbour and navigation queries).
Hierarchical model consist on a set L of symbolic coordinates ordered according to their <<spatial containment>> relation. If a location LB is spatially contained in LA
it means that LA is an ancestor of LB (LA > LB, i.e. LA contains LB). The
<<overlapping>> relation defines two subtypes of hierarchical model: the lattice-based
model (when the overlapping locations are to be modelled) and the tree-based model
(when the locations do not overlap). In the Figure 3-2 it is possible to observe a lattice-based model in which the interceptions are modelled as separate locations with more than one parent location. Once the <<containment>> relation is the basis of this model (i.e. the descendants of a given location define the locations that are in range of that location), range queries are naturally supported. The overlapping locations are defined trough the interception of sets and simple qualitative notion of distance is supported. However, it is not possible to model the connections between locations therefore, the
<<interconnection>> relation is not supported.
In the graph-based model G = (V, E), symbolic coordinates define the vertices V and the edge E defines – if exists – a direct connection between two locations. The Figure 3-3 presents a graph-based model. The distance between locations can be either achieved by weighing the edges or the vertices, or by counting the number of hops between the locations. Since the edges defines whenever a connection between locations exits, the <<connected to>> relation is fully supported. By combining the
<<connected to>> relation with the distance between locations this model is capable of
answering the nearest neighbour queries. One limitation of this model is the fact that is not possible to explicitly define bigger locations comprehending several small locations, e.g. define all the locations within a given floor.
Related work
If the graph and set-based models are combined an improved model is attained, particularly in the range queries (see Figure 3-4). The model uses the same set L of symbolic coordinates and defines locations within that set L as subsets like in the set-based model, whereas the graph-set-based model is used to define the <<connection>> relation between locations. The distance between locations is inferred through the weight of the edges or vertices, which enables the range queries. Since the edges define whenever two locations are directly connected, the <<connected>> relation is fully supported. By combining the distance and the <<connected>> relation information, the nearest neighbour query is supported. This model provides the necessary means to define fine-grained information – e.g. define every room in a certain building – or coarse-grained information – e.g. define the connection between different floors of a certain building or the connections between different buildings, as it is possible to observe in the Figure 3-5.
Satoh et al., (2008) presents a location-aware communication approach for smart home environments based on a symbolic location model. The model represents the
<<containment>> relation between physical objects, computing devices and places.
The unique feature of this model is that unlike others it not only shapes the physical objects, but also the location of computing devices and services. The virtual counterpart
Figure 3-4: Combined symbolic model [Becker C. et al.
(2005)]. Figure 3-5: Levels of details [Becker C. et al. (2005)]. Figure 3-3: Graph-based model source [Becker C. et al. (2005)].
component (VC) defines the physical objects, e.g. a car carrying one person is mapped in two VCs: one VC is the car and the other is the person. The proxy component (PC) executes the services located in a VC, maintains the model’s sub tree and bridges the model and computing devices. The service component (SC) defines the specific services that are available on certain physical entities or places. The framework presented is able to determine available services and execute them in accordance to the space in which the user is located. Objects that do not possess any computational resources or network interfaces are also supported and listed in the framework.
Kolodziej and Danado et al., (2004) proposed a hierarchical model that can be decomposed to the required level of detail. This model enables relative positions inside an existing hierarchy and discovery of adjacency spaces. However, due to the lack of absolute location and distance information to other spaces, the precision of the model is reduced.
Baras et al., (2001) presented a symbolic model in which the edges of the vertices (graph-based) are used to represent generic relations between objects. The relations can be complemented with a set of attributes to enrich the description and facilitates inference processes. Some of the relations implemented are: “Is_In” (defines containment and is attained through the model’s hierarchy), “Is_Accessible_From” (defines connectedness) and “Is_Next_To” (defines adjacency and enables the support for pedestrian/navigation applications).
3.1.3. Hybrid location models
Hybrid location models combine geometric and symbolic models, which provides two major advantages. The first one is the gain of accuracy and precision of every distance-related query. The second advantage is the use of arbitrary figures to define ranges for the nearest neighbour queries. This way, one of the biggest disadvantages of the symbolic models is overcome, i.e. the lack of support for distance-related queries. According to Becker and Dürr et al., (2005) two types of hybrid location models can be defined: the subspaces and the partial subspaces.
The basis of this subspaces model is a symbolic model in which additional geometric information of every location is modelled and stored (see Figure 3-6). This information can be either achieved through a global or local reference system. Embedding a coordinate system into another coordinate system forms the subspace.
Related work
Therefore, the position and orientation information has to be defined in a way that is possible to translate and compare the coordinates between the different coordinate systems. The graph part of the model defines the interconnection and the distance between locations, which enables the <<containment>> relation.
Contrarily to the subspaces, where it is assumed that geometric information is modelled to every location, in partial subspaces only some locations are geometrically extended (see Figure 3-7). For instance, the geometric information might be used to model the outdoor domain of the building while the indoor domain is modelled through symbolic models. This way the symbolic models can be integrated with the global geometric model. The geometric information enables the range and spatially containment queries, but the <<connected to>> relation cannot be determined through geometric information therefore; it has to be explicitly modelled.
Figure 3-6: Subspaces model [Becker C. et al. (2005)].
The RAUM is a hybrid location model presented by Beigl et al. (2002) that describes the location of everyday objects (called as artefacts) in the surrounding environment. The model combines symbolic names with geometric information and describes a location tree (each path of the tree defines the location of a specific object). The RAUM model is divided in two main parts: the LRM part defines how the location information is represented, stored and communicated, while the CM part defines how the information is used in the artefacts communication. Since the model is able to detect the current location and any change that occur to the objects, it is a dynamic model.
The CMU Aura system is a hybrid location model presented by Hsieh et al., (2004) which combines hierarchical symbolic names with geographic coordinates. This model defines five primitives on the ALI (Aura Location Identifier) that are able to compute the distance, containment, within, super and sub relations. A model to compute the distance and the time required to move between two locations is presented by the authors.
After being presented in 2002 the AURA system was improved and presented by Miller and Steenkiste et al., (2007) with the same hybrid location model but with new extensions. These extensions were: connectivity between locations, support for both outside and inside spaces and additional information concerning the spaces. The hierarchical model was augmented to support that each space in the hierarchy could use different coordinates systems to specify points or areas within that space. The locations are represented using ALIs, which can represent a physical space (e.g. a room), an exact point (e.g. a printer location), an arbitrary area (e.g. Wi-Fi coverage area) or a collection of spaces (e.g. a floor with multiples offices). The information regarding spaces has to be available for all the applications regardless their goals (e.g. infer the properties of the space(s), i.e. calculate distances, optimization, i.e. indicate the shortest path and effective communication with the users, i.e. indicate a path).
Hu and Lee et al. (2004) present a hybrid location model based in a relational model for constrained environments. The model contains heterogeneous entities that are defined as they are in the world (e.g. buildings, rooms, corridors, etc.) with arbitrary number of different attributes (e.g. temperature, ZIP code, room’s capacity, etc.). Although the number of attributes can be arbitrary there are two mandatory attributes: the Id (that uniquely identifies the entity) and the location (that defines the geographic location information of the entity). The location model is composed through two hierarchies: the location and the exit hierarchy. The exit hierarchy can be derived from
Related work
maps/floor plans to model the <<connection>> relation and the distances between places. The authors present their own new definitions of topological relations on path; lemmas, proofs and algorithms regarding the topological relations; and a complete example of modelling an indoor office area.
A hybrid location model that combines lattice and graph based representation is presented by Ye et al. (2007) for more complex environments (e.g. city plan, forest, etc.). According to the authors the model provides flexible, expressive and powerful spatial representation along with a new data structure in order to express comprehensive spatial relations. The lattice based describes the containment, disjointness and overlapping, while the graph based describes the adjacency and <<connection>> relation.
3.2. Public displays
The deployment and use of public displays is increasing in the major public spaces, such as: airports, hospitals, shopping malls, universities etc. The displays are used to perform multiple and different tasks, while some tasks require the display’s spatial information, the others do not require it.
Kray et al., (2008) presented an indoor navigation system that uses public displays to present dynamic signage. The navigation information is presented in the display in text or arrows form when the user is approaching the display. This system was implement in two floors of the InfoLab21 at the Lancaster University, where a 7” colour touchscreen display was placed in each office door. The displays were placed at specific locations within the InfoLab21 and with specific orientation (the display’s orientation has a strong impact in the navigation service).
Kray et al., (2005) presented a public navigation (Gaudi) system that uses adaptive displays as directional signs. The GAUDI system was a prototype of a pervasive way finding that is dynamic, adaptive and embedded in the building environment. Each Gaudi display presents information regarding the name of the event/destination, the direction the user has to follow and distance estimation between the display and the destination. The key advantages of GAUDI are: support for temporary events and capability that each display has to detect its new location and orientation. The two main parts that compose the Gaudi system are: the navigation
server (manages navigation information and publishes it in the displays) and the arbitrary number of autonomous displays.
Hamhoum et al., (2012) introduced a prototype dynamical system in a realist setting to support pilgrims in navigating one particular area. The goal was to investigate how public displays can be used to reduce the crowdedness during the Tawaf ritual, by helping the pilgrims remember how many times they have circled around the Ka’bah. Due to the religious nature of the scenario the author presented three key requirements: be usable by a large number of pilgrims, easy to learn and not interferer with the spiritual task. After an initial proposal, an enhance solution was presented where the display presents a single large circle that is subdivided into coloured wedges and a central smaller circle. The wedges correspond to a group of people in specific areas and have different colours facilitate recognition and differentiation.
Stahl et al., (2005) presented the REAL project that is focused in two particular tasks: navigation and shopping in an airport scenario through public displays. In the shopping task, the goal was to help the user achieve the best buying decision within a limited time. The navigation assists the user to reach the desirable destination (macro navigation) or focus the user attention to a given spot within the user perimeter (micro navigation).
Hamhoum et al., (2008) investigated augmented signage as a mean to provide personal navigation support for large crowds. The approach proposed in this work was based on a spatial partitioning and a mapping of destinations to visual codes. The two visual codes presented by the authors were: add coloured circles to items shown on signs, and a combine symbols and colours (e.g. red heart). A study with 18 participants was conducted to perceive which of the two solutions versus the traditional arrow symbol was the most suitable. The parameters to perform the test were: timing, usability, satisfaction, errors/disorientation, ease to use, learnability and workload. In the end the participants were asked to rank which of the three designs they prefer and the choice was: the colour one. Despite the good results attained, the authors pointed two limitations: the lack of realism and crowdedness of the test environment.
Ojala et al., (2012) deployed 12 multi-propose interactive displays in 2009 at six outdoor and six indoor spaces around Oulu, Finland. The work’s goal was to understand how the users interact and derive value from the interactive displays that provide real services based on real content during an extended period of time. The authors believe that a long-term test enhances the value of any system comparatively to a short-term test
Related work
with predefined task and users. The displays deployed can be used in passive broadcast or interactive mode. In passive mode the display’s screen is totally used by the UBI channel to present videos, animations and photos. The interactive mode is triggered when a user touches the screen and the display slips its content between the UBI channel and a customizable UBI portal. The portal contained 25 different services divided in 7 categories: news, services, city, third party, fun & games, multimedia and
new cool stuff.
3.3. Chapter summary
In this chapter we presented the different types of location models available in the literature. Based on this research we conclude that the type of coordinate used will influence the choice of the location model, i.e. geometric coordinates impose a geometric model, symbolic impose a symbolic model and the combination of both coordinates impose a hybrid location model. Regarding the displays, we identified the different uses of the displays in the literature along with the spatial requirements that such uses impose. For example, we identified that some uses need the location, orientation and the surrounding information of the display. Therefore, we identified the need of a spatial model to characterize the spatial information of the displays. In the following chapter we present in detail the spatial requirements and the display’s usage patterns.
Requirements
4. Requirements
In this chapter we gather and identify the different types of public displays’ usage patterns. Each usage pattern clearly identifies how the displays are used to perform a certain task, and how they relate with the others displays as well their surroundings. Firstly, we start to describe the process that was followed to identify the usage patterns and then each usage pattern is presented (section 4.1). Afterwards, based on these patterns we identify the spatial requirements that were imposed not only to the spatial model but also to the characterization of the displays (section 4.2). Each spatial requirement is then described and possible solutions to attain the required information are presented. Finally, based on the pros and cons of each of the proposed solution, the solution that is going to be used in this work is presented.
4.1. Usage patterns
During the literature review one aim was to identify and gather the scenarios in which the displays were used with some knowledge regarding their location, the location of the others displays and the status of their surroundings, i.e. spatial knowledge. Nevertheless, even though there were more scenarios, they were not considered in this work as the displays were used without any spatial knowledge. After gathering all the scenarios, we started to categorize the services that were using the displays in terms of: how each type of service exploited the displays; which spatial requirements were imposed; and how the displays related with the others displays/surroundings. Based on this knowledge the different scenarios were arranged in different groups. However, for this task to be completed, two intermediate steps were performed. In the first step, we grouped the scenarios in a more embracing way, i.e. the groups were merely formed based on how the displays were used by the services without establishing any relation between the groups/services. The result was a vast number of different groups. Still, after a careful look into the groups, it was perceived that among the different groups the displays were in fact used in the same or similar manner while imposing the same or very similar spatial requirements. These groups were merged into one group. Regarding the groups in which the displays usage was identified as a particular case of another group, they were added as a subtype of that group. The groups resulting from the first arrangement were the following:
1. Content oriented 5. Position aware 1.1 Content’s scheduling 6. Spatial interaction 2. Spatially coordinated displays 7. Navigation assistance
2.1 Coordinated behaviour 7.1 Shopping assistance 3. Location based display discovery 7.2 Support crowds 4. Context aware 7.3 Dynamic solution
Nonetheless, after this first arrangement it was perceived that a second arrangement would be needed because, despite the displays were used by different services we identified that they were used in the same way to attain the same goals while imposing the same spatial requirements. So, in the second step we decided that these groups
Requirements
would be merged into one group. One good example of this arrangement is the shopping
assistance group, because apart from the shopping assistance that helps the users in
their buying decisions (which does not imposes any spatial requirement) the displays were used to provide navigation assistance to reach the product’s location. Hence, the
shopping assistance group is just a particular case of the navigation and so it was
merged into the navigation group. The same standard was followed in the others groups that were merged. The final groups are (! are the final groups, and
"
are the groups that were merged):!
Location based displays " Content oriented " Content’s scheduling " Context aware!
Spatial coordinated displays" Spatially coordinated displays " Coordinated behaviour
!
Navigation" Shopping assistance " Support crowds " Dynamic solution
!
Spatial aware displays " Position aware " Spatial interactionThese were the final four groups that clearly identify the different types of displays’ usage patterns. Moreover, each usage pattern clearly identifies how the displays are used to perform a certain task (e.g. the navigation usage pattern clearly identifies the displays that are used to provide navigation assistance). In the following sections each usage patterns is presented and described in detail.
4.1.1. Location based displays
Location based displays, is the usage pattern that clearly identify the displays that are used to disseminate content based on the displays’ location. This content can be disseminated separately in time or space (José R. et al. (2006)) and it can be generated in arbitrary or specific way (Storz O. et al. (2008)). When the content is separated in time, it means that each display presents the content for a certain period of time that can be synchronized among the displays involved. On the other hand, when the content is separated in space, it means that the content is presented in the displays that are at certain locations. The content’s generation can be performed in an arbitrary way (i.e. the content is generated regardless who is passing near the display) or in a specific way (i.e. the content is specifically generated to match its target personal interests). In the latter case, based on the identity and/or location of the user (Madeira R. et al. (2010)) the system generates specific content that matches the user' interests. The process that controls how the content is presented – separated in time or space – and how it is generated – in a specific or an arbitrary way – can be performed through a central entity (typical broadcast model, one-to-many) or locally by the display (José R. et al. (2006)). The displays are able to personalize themselves based on their current location, how they are being used and based on the user’s location and identity (Ward A. et al. (2002)). If the system is able to identify the user, the displays can be used to present coded messages when the user is at certain locations or performing certain actions (Strohbach M. et al. (2009)). Sign oriented displays (José R. et al. (2006)) besides presenting traditional sign information are also used to present occasional location-based announcements. The content can be schedule to be presented location-based on the location of the displays and when the scheduling requirements are fulfilled. An example of this is a store that, at the end of the day, wants to sell its surplus at lower prices. To increase the number of people that knows about this price reduction, a scheduling application can be used to schedule the time at which this information is presented and to select the displays (based on their location) that will present this information. Additionally, the displays can provide navigational assistance to reach the store.
Requirements
4.1.2. Spatially coordinated displays
Spatially coordinated displays is the usage pattern that clearly identifies all the displays that are used to present the content in coordinated ways (Storz O. et al. (2008)). Contrarily to the previous usage pattern that only required the location of the displays, in this case the location of the displays relatively to the location of the other displays is required. The displays involved in the coordinated interaction can be used in a sequential or simultaneous way. If the displays are simultaneously used, it means that they are used at the same time to present the content, e.g. in an emergency scenario the displays are simultaneously used to present the emergency information at the same time. Contrarily, if the displays are sequentially used, it means that different displays are used at different times to present the content, e.g. during a navigation service, the displays are used in sequence as the navigation information is only presented in the display that is near the user. Based on the display’s location the system is able to interact and integrate the displays in a coordinate manner. Even though some displays are able to control their integration level to operate in isolation, if required (José R. et al. (2006)), it is assumed that the system is able to suppress their integration control level to integrate them in the coordinated interaction if required. Besides being used to present content in coordinated ways, the displays can also be used to collectively process the surrounding information and to act as a more user-friendly front-end service (Strohbach M. et al. (2009)).
4.1.3. Navigation
Navigation is the usage pattern that defines all the displays that are used to assist the users in their search for a suitable path to reach their destination (Kray C. et al. (2008)). The challenge is to provide an effective navigation at indoor spaces, such as airports (Stahl C. et al. (2005)), universities, hospitals and office buildings (Kray C. et al. (2005)). When the user types the destination, the service immediately starts to calculate the most suitable path. The path calculation is performed through way-findings algorithms that are supported by the location model (Kray C. et al. (2008)). During the path’s calculation any special requirement is taken into account, e.g. if a user cannot use stairs (e.g. handicap user), a path with elevator or ramp is provided. When the path is calculated, the information is presented in the display near the user or in the user’s Smartphone (Strohbach M. et al. (2009)). If the Smartphone is used, firstly it
needs to synchronize with the system (Strohbach M. et al. (2009)). Furthermore, if during the path the system or the user identifies any change or issue in the surroundings (e.g. locked door) an alternative path is automatically and dynamically calculated and provided. Besides requiring the display’s location and the location of the other displays as the previous usages patterns, this usage pattern requires the displays’ surroundings status. This status enables the display to perceive its surroundings and adapt the navigational information if required (e.g. if a path is blocked, an alternative one is provided).
Gaudi (Kray C. et al. (2005)) is an example of a navigation system, which purpose is to assist the visitors, students and staff in their navigation around the Lancaster University campus. Each Gaudi display, besides presenting directional information, provides information regarding the destination or event. Sign oriented displays (José R. et al. (2006)) present short pieces of information, such as directions to a given destination.
Shopping assistance is a particular case of navigation, because apart from assisting the users to achieve the best buying decision (Stahl C. et al. (2005)), the displays are used to provide navigation. If the user pretends to see a product, he can activate the navigation service to reach that product‘s location. The navigation stops when the user reaches it (Strohbach M. et al. (2009)), or when he reaches a checkout point or manually by the user.
Support crowds’ is another particular case of navigation, which the goal is to provide assistance and useful information to everyone in crowed situations. In these situations it is crucial to keep everyone calm, safe and ensure that everyone follows the same orders, with the aim of avoiding disorder. At Ka’ba (Hamhoum F. et al. (2012)) the displays are used to help the pilgrims to keep on track the number of rounds they have performed around Ka’ba. Each pilgrim has to perform seven complete rounds and with the help of the displays, the pilgrims know exactly how many rounds they have performed. Therefore, no unnecessary rounds are performed.
4.1.4. Spatially aware displays
Spatial aware displays is the usage pattern that defines the displays that are aware of what is happening in their surroundings, are able to identify when their location and orientation changes (Kray C. et al. (2005)), tune their content base on how
![Figure 2-1: Lateration [Hightower J. et al. (2001)].](https://thumb-eu.123doks.com/thumbv2/123dok_br/17770730.836931/27.892.253.638.725.996/figure-lateration-hightower-j-et-al.webp)
![Figure 2-2: Angulation [Hightower J. et al. (2001)].](https://thumb-eu.123doks.com/thumbv2/123dok_br/17770730.836931/28.892.288.607.377.605/figure-angulation-hightower-j-et-al.webp)
![Figure 3-2: Hierarchical lattice-based model [Becker C. et al. (2005)].](https://thumb-eu.123doks.com/thumbv2/123dok_br/17770730.836931/39.892.298.599.371.646/figure-hierarchical-lattice-based-model-becker-c-et.webp)