“Role of insulin and insulin-like peptides in bone
formation: Identification of bone-specific target genes
and regulatory mechanisms, and characterization of
the insulin-mimetic effect of vanadium”
Daniel António Martins Tiago
Doutoramento em Biologia
Especialidade em Biologia Molecular
“Role of insulin and insulin-like peptides in bone
formation: Identification of bone-specific target genes
and regulatory mechanisms, and characterization of
the insulin-mimetic effect of vanadium”
Daniel António Martins Tiago
Doutoramento em Biologia
Especialidade em Biologia Molecular
Tese orientada por:
Profª. Drª. Maria Leonor Cancela,
The content of this dissertation is of exclusive responsibility of the author
À Prof. Dra. Leonor Cancela por me ter dado a oportunidade de trabalhar durante o doutoramento na sua equipa de investigação e por todo apoio que me tem dado desde então.
Ao Dr. Vincent Laizé pela orientação que me concedeu durante o doutoramento e por todas as discussões que tanto contribuíram para o desenvolvimento deste projecto e para a minha maturação científica.
Ao Prof. Dr. Manuel Aureliano Alves pela orientação e apoio durante o doutoramento.
Aos meus colegas de laboratório Ricardo Leite, Ricardo Afonso, Marta Rafael, Cátia Marques, Carla Viegas, Natércia Conceição, Dina Simes, Vanesa Robles, Sara Mira, Brigite Simões, Anabela Brito, Paulo Gavaia, Rita Ascenso, Vânia Roberto, Marta Valente, Sofia Cavaco (sem nenhuma ordem especial) pelos bons momentos que passámos durante os últimos anos e pelas saudáveis discussões científicas que tivemos durante as reuniões e que muito contribuíram para este projecto.
Aos meus colegas de curso pelo apoio que me deram durante essa fase do meu percurso académico.
Aos meus pais pela amizade, carinho e pela minha formação (não só pessoal como científica). A eles agradeço o apoio que me foi dado a todos os níveis durante os últimos 28 anos.
apoiar nos bons e maus momentos, e por todas as discussões científicas que partilhámos.
À minha mulher, Margarida, pelo apoio incansável nos bons e maus momentos. Tendo sido o meu ponto de equilíbrio durante este longo caminho, sem ela não teria sido possível realizar este projecto.
A realização deste trabalho teve o financiamento da Fundação para a Ciência e Tecnologia através da atribuição da bolsa de doutoramento SFRH/BD/12773/2003.
Insulin and IGF-1 are small circulating peptides known to regulate bone mineral density and formation in vertebrates through the activation of intracellular PI-3K and MAPK signalling pathways. Vanadium/vanadate has recently been shown to regulate proliferation and differentiation of mammalian bone-derived cell lines also through the activation of both pathways. In this study, proliferative and mineralogenic effects of insulin, IGF-1 and vanadate have been investigated using fish bone-derived cell lines VSa13 (chondrocyte-like) and VSa16 (osteoblast-like). Short-term treatments of VSa13 cells with two different forms of vanadate in solution (meta- and decavanadate) reavealed that metavanadate (i) results in faster and higher accumulation of vanadate in the cell, and (ii) has a lower toxicity than decavanadate when administered in vitro to the cells. Chronic treatments with both solutions were found to partially mimic the effects of both factors, e.g. stimulated VSa13 cell proliferation, as IGF-1, and prevented ECM mineralization, as insulin. Treatments with wortmannin and PD98959 demonstrated the involvement of MAPK and PI-3K\Ras\ERK pathways in proliferative and mineralogenic effects, respectively. These data are consistent with recent observations in mammalian ATDC5 cells (chondrocytes) suggesting the conservation of mechanisms of action throughout evolution. Vanadate was also shown not only to interfere with regulatory pathways but also to inhibit alkaline phosphatase activity, a key enzyme in bone formation. In Vsa16 cells, similar effects have been observed on proliferation, using IGF-1 (i.e. stimulation), and ECM mineralization, using both IGF-1 and vanadate (i.e. inhibition), suggesting conservation of mechanisms across bone cell types. In parallel to this work, 3 spliced variants of seabream proIGF-1 (IGF-1a, 1b and 1c) were identified and associated to a different mode of action (local and systemic) in adult tissues and during development, as previously observed in mammals. Variants 1a
presented here indicate a conservation of mechanisms between fish and mammals, further demonstrating the suitability of fish systems to study vertebrate insulin-like effects in bone.
Keywords
Insulin-like activity; vanadate; intracellular signalling; in vitro mineralization; bone-derived cell lines; vertebrate bone formation; teleost fish Sparus aurata; Pro-insulin-like growth factor 1 (proIGF-1); E domain; alternative splicing.
Insulina e IGF-1 são pequenos péptidos circulantes conhecidos por regular a densidade mineral e formação óssea em vertebrados através da activação vias de sinalização celular PI-3K e MAPK. Por sua vez, demonstrou-se recentemente que o vanádio/vanadato regula a proliferação e diferenciação de linhas celulares derivadas do osso de mamíferos através mesmas vias. Neste estudo, os efeitos proliferativos e mineralogénicos da insulina, IGF-1 e vanadato foram investigados em linhas derivadas do osso de peixe: VSa13 (tipo condrócito) e VSa16 (tipo osteoblasto). Tratamentos agudos com metavanadato (espécies n-méricas 1 a 5) nas células VSa13 revelaram uma acumulação mais rápida e mais elevada de vanádio, bem como uma toxicidade mais baixa do que decavanadato (n = 1 ou 10). Tratamentos crónicos com ambas as soluções estimularam a proliferação das VSa13, tal como a IGF-1, e preveniram a mineralização, tal como a insulina. Tratamentos com wortmanina e PD98959 demonstraram o envolvimento das vias MAPK e PI-3K\Ras\ERK nos efeitos proliferativos e mineralogénicos, respectivamente. Os dados obtidos são consistentes com observações recentes nas células de mamífero ATDC5 (condrócitos) sugerindo uma conservação de mecanismos ao longo da evolução. Aparentemente o vanadato não só terá interferido com as vias de sinalização mas também com a actividade da fosfatase alcalina, uma enzima muito importante na formação óssea. Nas células VSa16 foram observados efeitos semelhantes na proliferação através de tratamentos com IGF-1 (estimulação), e na mineralização através de tratamentos com vanadato e IGF-1 (inibição), sugerindo uma conservação de mecanismos através dos tipos celulares de osso. Em paralelo, neste trabalho foram identificadas em seabream 3 variantes da proIGF-1 (IGF-1a, 1b e 1c) e associadas a diferentes modos de acção (local e sistémico) em tecidos de adultos e durante o desenvolvimento, tal como previamente demonstrado em mamíferos.
adaptação a diferentes salinidades. Em geral, os resultados aqui apresentados indicam uma conservação de mecanismos em vertebrados, demonstrando a importância dos sistemas derivados de peixes no estudo dos efeitos semelhantes à insulina no osso.
Palavras-chave
Actividade tipo insulina; vanadato; sinalização intracelular; mineralização in vitro; linhas celulares derivadas de osso; formação óssea em vertebrados; teleósteos (Sparus
ALP Alkaline phosphatase
ANOVA Analysis of variance
BSA Bovine serum albumin
DAH Days after hatching
DMEM Dulbecco’s modified Eagles medium
ECM Extracellular matrix
ERK Extracellular-regulated kinase
FGF Fibroblast growth factor
GH Growth hormone
GRB-2 Growth factor receptor-bound protein 2
HAF Hours after fertilization
IGF Insulin-like growth factor
IGF-1R IGF-1 receptor
IGF-2R IGF-2 receptor
IGFBP IGF binding protein
IR Insulin receptor
IRS Insulin receptor substrate
LS Laron syndrome
MAPK Mitogen-activated protein kinase
MEK MAPK/ERK kinase
MGP Matrix Gla protein
MTS 3-(4,5-dimethylthiazol-2-yl)-5-(3-carboxy-methoxyphenyl)-2-(4-sulfophenyl)-2H-tetrazolium
PBS Phosphate-buffered saline solution
PCR Polymerase chain reaction
PDGF Platelet-derived growth factor
PI-3K Phosphatidylinositol-3 kinase
PKB Protein kinase B
PKC Protein kinase C
ProIGF Insulin-like growth factor pro-peptide
PTK Protein tyrosine kinase
PTPase Protein tyrosine phosphatase
qPCR Quantitative real-time PCR
RACE Rapid amplification of cDNA ends
Ras Rat sarcoma viral oncogene
RPL27a Ribosomal protein L27a
Shc SH2-containing collagen-related proteins
SSC Standard saline citrate buffer
TKR Tyrosine kinase receptor
AGRADECIMENTOS... I ABSTRACT ... III RESUMO ...V ABBREVIATIONS ...VII
1. INTRODUCTION ...2
1.1. INSULIN-LIKE ACTIVITY IN MAMMALS...2
1.1.1. Insulin and insulin-like growth factors...2
1.1.2. Insulin and IGF biological effects...3
1.1.3. Insulin, IGF-1 and IGF-2 receptors and IGF binding proteins...6
1.1.4. Insulin and IGF intracellular signalling...8
1.1.5. Vanadium and its insulin-like activity...10
1.2. INSULIN-LIKE ACTIVITY IN VERTEBRATE BONE...13
1.2.1. Skeleton formation...14
1.2.2. Insulin and IGF in vitro effects in bone-derived systems...17
1.2.3. Insulin and IGF in vivo effects in bone...18
1.2.4. Vanadate and its effects in bone ...19
1.3. FISH AS A MODEL ORGANISM TO STUDY VERTEBRATE BONE FORMATION...21
1.3.1. Fish bone-derived cell lines: VSa13 and VSa16 cells...23
1.4. OBJECTIVE...24
2. METHODS...26
2.1. PREPARATION OF PEPTIDE, VANADATE,PD98059 AND WORTMANNIN SOLUTIONS...26
2.1.1. Characterization of vanadate solutions in cell culture medium ...26
2.2. FISH CULTURE...28
2.3. CELL CULTURE MAINTENANCE...28
2.4. RNA PREPARATIONS...29
2.4.1. RNA extraction from larvae and tissues ...29
2.4.2. RNA preparation from cultured cells...29
2.5. CONSTRUCTION OF GENOMIC AND COMPLEMENTARY DNA LIBRARIES...30
2.5.1. Construction of genomic DNA library...30
2.5.2. Construction of complementary DNA...30
2.6. DNA AMPLIFICATION AND CLONING...31
2.7. SEQUENCE RECONSTRUCTION...31
2.8. GENOMIC SOUTHERN ANALYSIS...32
2.9. QUANTITATIVE REAL-TIME PCR ...32
2.10. CELL VIABILITY ASSAY...33
2.11. ECM MINERALIZATION AND NODULE DETECTION...34
2.12. PROTEIN QUANTIFICATION...34
2.13. ALP ACTIVITY...34
2.14. TOTAL COLLAGEN CONTENT...35
2.15. VANADIUM ACCUMULATION IN CELL EXTRACTS...35
3. RESULTS...38
3.1. SHORT EXPOSURES OF VANADATE OLIGOMERS DIFFERENTLY AFFECT VSA13 CELLS...38
3.1.1. Spectral analysis of metavanadate and decavanadate oligomers in DMEM...38
3.1.2. Decavanadate stability in DMEM ...40
3.1.3. Short- and long-term cytotoxic effects of vanadate oligomers in VSa13 cells...41
3.1.4. Vanadium accumulates differently in VSa13 cells upon vanadate exposure ...44
3.2. VANADATE INSULIN-LIKE EFFECTS ON VSA13 CELLS...45
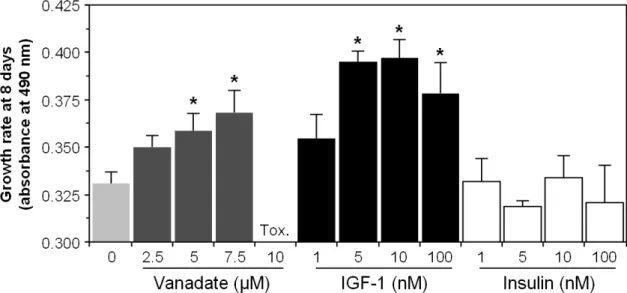
3.2.1. Vanadate and IGF-1 stimulate VSa13 cells proliferation ...45
3.2.2. PD98059 similarly blocks vanadate and IGF-1 stimulation of VSa13 cell proliferation...47
3.2.3. Vanadate and insulin impair VSa13 ECM mineralization...48
3.3.1. Proliferation of VSa16 cells is stimulated by IGF-1 but not by vanadate ...53
3.3.2. Vanadate and IGF-1 impair ECM mineralization in VSa16 cells ...54
3.4. ALTERNATIVE SPLICING OF SEABREAM IGF-1 TRANSCRIPT:DISTRIBUTION AND ROLE OF THE SPLICING VARIANTS...55
3.4.1. Cloning of seabream IGF-1 transcripts...55
3.4.2. IGF-1 gene occurrence and structure ...58
3.4.3. Expression of IGF-1 transcripts during development and in adult seabream...60
3.4.4. IGF-1 alternative splicing in vertebrates ...62
4. DISCUSSION...67
4.1. METAVANADATE AND DECAVANADATE DIFFERENTLY AFFECT VSA13 CELLS...67
4.1.1. Differential effect of monomeric and decameric vanadate species on VSa13 cells upon short exposures ...67
4.2. VANADATE INSULIN-LIKE EFFECTS ON VSA13 CELLS...69
4.2.1. Insulin-like effects on VSa13 cells proliferation and ECM mineralization ...69
4.2.2. MAPK pathway transduces vanadate stimulation of cell proliferation ...70
4.2.3. PI-3K\Ras\ERK pathway mediates insulin and vanadate impairment of VSa13 ECM mineralization ...71
4.2.3. Vanadate affects ECM mineralization through inhibition of ALP activity ...72
4.3. INSULIN-LIKE EFFECTS IN CHONDROCYTE-LIKE VERSUS OSTEOBLAST-LIKE CELLS...72
4.3.1. IGF-1 stimulates both chondrocyte and osteoblast proliferation in fish ...72
4.3.2. IGF-1 and vanadate inhibit ECM mineralization of both fish chondrocyte-like and osteoblast-like cell lines...73
4.4. PUTATIVE ROLES FOR ALTERNATIVELY SPLICED TRANSCRIPTS OF IGF-1 IN SEABREAM...74
4.4.1. Seabream IGF-1: one gene, several transcripts ...74
4.4.2. The proIGF-1 variants are tightly regulated during seabream development...76
4.4.3. Variants of proIGF-1 in adult seabream tissues: systemic versus autocrine/paracrine modes of action ...77
4.4.4. Mechanisms of IGF-1 alternative splicing in vertebrates are taxon-specific...78
5. CONCLUSIONS AND FUTURE PERSPECTIVES...80
REFERENCES ...83
APPENDICES ...94
APPENDIX I – MEDIUM AND SOLUTIONS COMPOSITIONS...94
APPENDIX II–PRIMERS...97
APPENDIX III – METHODS COMPLEMENTARY INFORMATION...98
APPENDIX IV– RESULTS AND DISCUSSION COMPLEMENTARY INFORMATION...99
1. Introduction
1.1. Insulin-like activity in mammals
In mammals, insulin and IGFs belong to a protein family composed of at least eight members, including relaxin and four insulin-like peptides [1]. Insulin is a small circulating peptide known for its metabolic effects and therapeutic properties in diabetes, through regulation of glucose levels in blood [2]. This peptide was first purified from bovine pancreas and injected in diabetic patients in 1922, but major advances in this therapy only arrived in 1978 when Genentech started to produce recombinant human insulin in E. coli. Insulin-like growth factors 1 and 2 (IGF-1 and IGF-2) are circulating peptides that share a high sequence similarity with insulin and that are known for its growth related and anti-apoptotic properties [3]. Like insulin but with more recent history, IGF-1 is currently being tested in clinical trials for the therapy of diabetes (type 1 and 2) and growth failure disorders. Companies are seeking United States of America Food and Drug Administration (FDA) approval for its commercialization.
1.1.1. Insulin and insulin-like growth factors
Insulin, IGF-1 and IGF-2 are synthesized as pre-pro-peptides. IGF-1 and IGF-2 pro-peptides (proIGFs) contain 5 domains (B, C, A, D and E) and are processed by the proteolytic removal of E domain [3]. Similarly, insulin pro-peptide (proinsulin) contains 3 domains (B, C and A) and is processed by the proteolytic removal of C domains [4]. ProIGFs and proinsulin are processed by SPC1 (furin) in the Golgi apparatus [5,6] forming mature peptides of approximately 70 and 51 residues (7.5 and 5.8 kDa), respectively. While B, C and A domains of proIGFs are structurally similar to those of
proinsulin in terms of amino acid composition, IGFs D domain has no equivalent domain in insulin (Figure 1.1) [3].
Figure 1.1 – Processing of IGF and insulin pro-peptides by intracellular peptidase and 2D structure of
mature peptide. Adapted from Berg et al, 2002, and http://dailymed.nlm.nih.gov/dailymed/fda/. [7]
1.1.2. Insulin and IGF biological effects
The physiological roles of insulin and IGFs are mainly associated in vertebrates to metabolism (glucose, amino acid and lipid), prenatal and postnatal growth, and regulation of tissue remodelling (bone) [2,3,8-10]. Insulin is mainly produced in β-cells of pancreatic islets of Langerhans under stimulation of circulating glucose and amino acids. After being released into bloodstream it readily decreases the circulating levels of glucose mainly through its action: (i) in liver, after stimulation of gluconeogenesis and glycogenolysis processes, and (ii) in muscle and adipose tissue, after stimulation of glucose uptake (mainly through glucose transporter-4, GLUT-4) and consumption [10]. Disorders associated to insulin deficiency or resistance, diabetes type I (incapacity to
produce insulin by pancreatic cells) and type II (both incapacity to produce insulin and tissue inability to respond to this hormone), are mainly characterized by the failure to regulate blood glucose levels [2,10]. Besides metabolic effects, insulin is also known to produce anabolic effects, such as lipid, protein and DNA synthesis, and to generally promote cell proliferation and differentiation during development [2]. Humans lacking active insulin receptors (IR), i.e. exhibiting Donohue syndrome, present severe growth retardations, adiposity, abnormal glycemia and β-cell failure to produce insulin [1].
IGF-1 and IGF-2 are both known to have important roles during development but also to act independently with a distinct spatio-temporal distribution [3]. IGF-1 is mainly produced in the liver under the stimulation of growth hormone (GH), which is secreted by the pituitary gland. In return, IGF-1 decreases GH secretion through its action in hypothalamus [3,9,11]. Although liver is responsible for most of circulating IGF-1 in vertebrates, approx. 260 ng/ml in mice [12], local production by specific tissues, through autocrine/paracrine processes, assumes an important role in organogenesis during postnatal growth [12]. IGF-2, which is highly expressed in various tissues (resulting in a 3-4 fold higher concentration in serum compared to IGF-1), has been shown to be particularly important during early embryogenesis but less determinant during postnatal growth [3,13]. Through its effects on either proliferation/differentiation of progenitor cells, metabolism or anabolism, several tissues/organs/systems have been shown to be regulated by IGFs: (i) central nervous system [14,15]; (ii) bone (this will be further discussed later in this chapter) [16-23]; (iii) skeletal muscle [24]; (iv) mammary gland; (v) adipose tissue [25,26]; (vi) pancreas (pancreatic β-cell proliferation and insulin release) [27-29]; and (vii) reproductive system [3]. Most of the tissues/organs/systems regulated by IGF-1 were shown to be affected in patients exhibiting Laron syndrome (LS), a disorder characterized by GH
resistance (due to GH receptor defects) and consequent reduced levels of circulating IGF-1. The main phenotype of patients with LS (Figure 1.2) [30] is: skeletal underdevelopment (patients also frequently develop osteoporosis at young age), sparse hair, obesity, muscle underdevelopment, hypoglycaemia and smaller/disproportioned bodies..
Figure 1.2 – Laron syndrome (LS) phenotype. A and B, lateral view of a 4-year-old male with LS: low
height, slight obesity, small chin, saddle nose and protruding forehead. C, 5-year-old male exhibiting LS with defective teeth formation. D, hands of a 4-year-old male with LS (left) and 2-year-old male (right).
E, lateral view of a 45-year-old male with LS exhibiting the same phenotype as in A-D and with sparse
hair and occipital alopecia. Adapted from Laron, 2002.
The only effective known treatment for LS is the supplementation with exogenous IGF-1, which results in: (i) higher glucose (in young age) and lower cholesterol levels in blood; (ii) increased liver and bone alkaline phosphatase (ALP) activity; and (iii) reduced adipose tissue and increased muscle strength.
Finally, IGF-1 has been also shown to be related to lifespan and aging but this issue is still highly controversial. Nevertheless, IGF-1 receptor (IGF-1R) +/- mice knockout studies have suggested an interesting increase in oxidative stress tolerance associated to a higher lifespan [31].
1.1.3. Insulin, IGF-1 and IGF-2 receptors and IGF binding proteins
Biological effects associated with insulin and IGFs are promoted through their binding to specific membrane receptors, IR, IGF-1R and IGF-2R (Figure I.3). While IR and IGF-1R are both tyrosine kinase receptors (TKR), IGF-2R is a cation-independent mannose-6-phosphate receptor (CI-MPR). CI-MPRs are transmembrane glycoproteins with long extracellular domains that are implicated in lysosomal degradation [32]. In that sense, there has been some controversy concerning IGF-2R specific role in mediating IGF-2 effects, but evidences seem to indicate that this receptor is probably responsible for clearing circulating IGF-2 [3]. IGF-2 effects are thought to be promoted through its binding to a IR splicing variant (IR-A) and IGF-1R [33,34]. However, IGF-1, which may also bind to IR with a high affinity [1], can also bind to IGF-2R with a very low affinity (~100 times less than IGF-2), thus being cleared from circulation [33]. IR and IGF-1R are composed by 4 subunits: two α (extracellular) and two β (transmembrane) subunits linked by disulfide bridges [35,36]. β subunits exhibit intrinsic PTK activity resulting in auto-phosphorylation of tyrosine residues upon binding of specific peptides to the α subunits. Three of these residues are located near the PTK catalytic site of β subunit and are responsible for a conformational change and consequent activation: catalytic region becomes accessible to peptide substrates and MgATP [35,37-39].
IGF binding proteins (IGFBPs), which are also part of the IGF system, form a family of at least six members, and exhibit a high affinity for IGFs (higher than receptors) in circulation, but display a very low or inexistent affinity for insulin [40]. The main functions of IGFBPs are to: (i) carry IGF to cells/tissues; (ii) extend IGF half-life; (iii) modulate IGF availability; and (iv) modulate IGF binding to receptors and
its activities [40]. Additionally, there have been some evidences indicating additional IGFBPs effects on cell function (e.g. cell migration) through its interaction with specific receptors and independently of its binding to IGFs [40]. Although IGFBPs were originally thought to limit IGFs effects, recent studies have shown that, on the contrary, they are able to potentiate IGFs effects. It has been proposed that IGFBPs bind IGFs with high affinity in serum in order to transport them to the target tissues. This affinity would hypothetically be decreased by IGFBP/IGF complex interaction with ECM or IGFBPs proteolysis by specific proteases [40].
Figure 1.3 – Scheme illustrating insulin (Ins), IGF-1 and IGF-2, their specific receptors
and binding proteins. α and β represent the subunits of insulin and IGF-1 receptors;
Circled P represents phosphorylation of β subunit; GP indicates glycoprotein of
1.1.4. Insulin and IGF intracellular signalling
Binding of insulin and IGF to α subunits of IR and IGF-1R initiates intracellular signalling events that result in biological effects [2,41]. Two main signalling pathways can be activated through this mechanism: phosphatidylinositol-3 kinase (PI-3K) and mitogen-activated protein kinases (MAPK) [10,41] (Figure 1.4). Briefly, either insulin receptor substrates (IRS) or Shc (SH2-containing collagen-related) proteins bind to receptor’s tyrosine kinases and become phosphorylated/activated (Figure 1.4). While activated Shc forms a complex with GRB-2 (growth factor receptor-bound protein 2) adapter and Sos (Son of sevenless), a guanidine nucleotide exchange protein, IRS forms a complex with GRB-2 and PI-3K. Consequently, either Shc/GRB-2/Sos complex consecutively activates Ras (rat sarcoma viral oncogene) and MAPK, or IRS/GRB-2/PI-3K complex activates protein kinase B or C (PKB or PKC) (Figure 1.4).
Figure 1.4 – Insulin (Ins) and insulin-like
growth factor 1 and 2 (IGF) intracellular signalling pathways. α and β represent the subunits of insulin and IGF-1 receptors; Circled
P represents phosphorylation of β subunit and
signalling peptides. Filled arrows indicate activation by protein/complex; dashed arrow indicates PI-3K\Ras\ERK pathway. IRS-1, GRB-2, PKB and PKC indicate activated intermediates in PI-3K pathway. Shc, Sos, GRB-2 (also intermediate in PI-3K), Ras, MEK
(MAPK/ERK kinase) and ERK (extracellular-regulated kinase) indicate
intermediate proteins in MAPK pathway. Adapted from Tiago et al. 2008.
Until recently, it was widely accepted that MAPK and PI-3K pathways were responsible for proliferation/differentiation effects and metabolic/anti-apoptotic effects, respectively. However, recent data have revealed that each of these pathways can generate both responses [10,41,42]. In that sense, proliferative effects induced by MAPK were shown to result from downstream activation of transcription factors while the same effects are mediated by PI-3K through PKC activation. In both cases, growth responses start with activation of AP-1 family of transcription factors (including c-fos and c-jun) [2]. Alternatively, GRB-2/IRS/PI-3K complex was shown to be capable of activating MAPK through Ras, thus generating a PI-3K\Ras\ERK pathway (Figure 1.4) [2,41]. MAPK pathway was shown to mediate anti-apoptotic effects (usually associated to PI-3K action) in experiments using cell lines in which IRS (essential intermediate of PI-3K pathway) were absent [43].
Although IR and IGF-1R generate similar intracellular signalling events, insulin and IGFs promote in most cases distinct effects [1]. In general, studies using IR, IGF-1R and IGF-2R knock-out mice suggested that only IR can mediate insulin signal while IGF-1R absence can be compensated by IGFs binding to IR (in particular IGF-2). Thus, important questions have arisen concerning what features in each receptor trigger the distinct effects. Evidences obtained from studies in which specific residues of IGF-1R were mutated suggested that differential phosphorylation of tyrosine residues in receptor β subunit may be responsible for differences in signal transduction. Apparently, C-terminal tyrosines are specifically associated to mitogenic effects, while juxtamembrane tyrosines regulate both PI-3K and MAPK signalling activation [10,41]. In fact, a major difference between IR and IGF-1R is precisely located in the C-terminal region, in which a quartet of serines is present in IGF-1R and shown to be essential for maximal activation of MAPK pathway [44,45]. Finally, tyrosine kinase activity of IR is
apparently down-regulated after phosphorylation of serine/threonine in the β subunits. Following this idea, it has been suggested that activation of serine kinases (e.g. PKC) through either IGF-1 or other hormones and cytokines actions, could constitute a negative feedback regulatory mechanism of insulin signalling, or be associated to insulin resistance disorder (type II diabetes) [46].
1.1.5. Vanadium and its insulin-like activity Vanadium, an essential element in organisms
Vanadium is a trace element that has been shown to be essential for biological activity in various organisms. In plants and algae, vanadium is directly involved in specific enzyme activities, acting as a cofactor in vanadium-nitrogenases and vanadate-dependent haloperoxidases [47-49]. In mammals, reduced doses of vanadium are associated with poorly developed animals, higher rates of spontaneous abortion or mortality and bone malformations [50]. Vanadium natural intake by human is approximately 10 µg V per day, mainly through vegetables, fruits, eggs, fish, beverages (beer and wine). Vanadium is absorbed in the upper gastrointestinal tract and it mainly accumulates in bones (ribs and carpal bones), kidney, spleen, ovary and uterus [50]. Biological effects of vanadium in vertebrates derive essentially from its capacity to interfere with several key enzymes, such as ATPases, phosphorylases, phosphatases (alkaline, acid and protein phosphatases) and ribonucleases [48]. This interference, in particular with phosphatases, has been attributed to vanadium oxidation states VV and VIV (vanadate and vanadyl, respectively), which exhibit some analogy with phosphate although to different extents (strong for vanadate and weak for vanadyl). Inhibition of phosphatases by vanadate was attributed to the formation of good transition state analogues during enzymatic catalysis [48,51] and a similar mechanism was proposed
for vanadyl although its geometry of coordination is somewhat different to that of phosphate [48].
An important feature of vanadate resides in its capacity to form different oligomeric species (monomeric to decameric species according to pH and concentration [52]; Figure 1.5), and to promote distinct effects depending on that oligomerization [53-57].
Figure 1.5 – Molecular structure of vanadate oligomers. V1, V2 and V10 indicate monomeric, dimeric
and decameric vanadate species, respectively; HV1 indicates protonated monomeric vanadate (HVO42-);
V4L and V4C indicate linear and circularized tetrameric vanadate species, respectively; V, O and H indicate vanadium, oxygen and hydrogen atoms, respectively. V1, V2 and V4 representations were adapted from Amado et al., 1993; V10 representation was adapted from Howarth and Jarrold, 1978.[52,58]
These distinct effects were demonstrated using in vitro and in vivo systems [53,59,60]. For example, decameric species were shown, in fish, to induce higher oxidative stress and haemoglobin oxidation, to stimulate antioxidant enzyme activities and to generate more tissue damages than other oligomeric species [54,61,62]. In contrast, monomeric species apparently accumulated at higher rates and doses in cardiac muscle, red blood cells and plasma [63]. Decameric species also revealed stronger
inhibition and affinity for ATPases, in particular myosin and sarcoplasmic reticulum Ca2+-ATPase [53,55,64,65].
Vanadium insulin-mimetic properties
The most important biological effect of vanadium is probably insulin mimicking. It was first demonstrated in the early 80’s, when vanadate and vanadyl treatments applied to isolated rat adipocytes [66,67] were shown to stimulate hexose transport, glucose oxidation and lipogenesis, as insulin [68]. Additional in vivo studies showed that vanadate oral administration to streptozocin-treated diabetic rats resulted in the reduction of blood glucose to normal levels [69,70], confirming its ability to mimic insulin. Vanadate was consequently proposed as a powerful therapeutic agent for diabetes mellitus (insulin-dependent). However, the therapeutic use of vanadate has been seriously hampered by its relatively high toxicity at administered doses [71,72]. Recent efforts have therefore focused on the discovery of chelating agents, which would reduce vanadyl and vanadate toxicity while preserving its insulin-like properties [73].
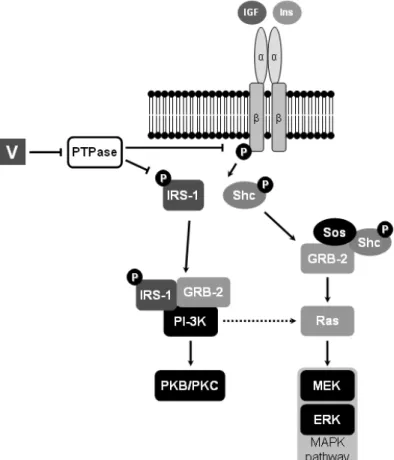
Insulin- and IGF-like properties of vanadium have been associated to specific inhibition of protein tyrosine phosphatases (PTPases) and consequent activation of receptor-associated PTK, including that of IR (Figure 1.6) [72,74-76]. Alternatively, non-receptor PTKs, e.g. IRS-1 or cytosolic PTK, are also putative targets in this mechanism [77].
Figure 1.6 – Insulin (Ins) and insulin-like growth factor 1 and 2 (IGF) intracellular signalling pathways,
and putative regulation by vanadium. α and β represent the subunits of insulin and IGF-1 receptors;
Circled P represents phosphorylation of β subunit and signalling peptides; V indicates vanadium. Filled arrows indicate activation by previous protein/complex; dashed arrow indicates
PI-3K\Ras\ERK pathway; intersected line (┬) indicates inhibition or inactivated. IRS-1, GRB-2, PKB and PKC indicate activated intermediates in PI-3K pathway. Shc, Sos, GRB-2 (also intermediate in PI-3K), Ras, MEK and ERK indicate intermediate proteins in MAPK pathway. Adapted from Tiago et al. 2008. [78]
1.2. Insulin-like activity in vertebrate bone
Vertebrate linear bone growth is a process tightly regulated by numerous and complex cellular signalling pathways, which are regulated by various growth factors and hormones [79-81], including insulin and IGFs [82,83]. In vivo and in vitro experiments have demonstrated an association of insulin and IGFs with osteogenesis [84-86], bone mineral density and bone formation rate [20,22,87-90]. These processes are highly dependent on the effects promoted during development by three major
1.2.1. Skeleton formation
Vertebrate skeleton is composed of cartilage and bone tissues, which are mainly formed by 3 major cell types: chondrocytes (cartilage specific), osteoblasts and osteoclasts (both bone specific) [91]. However, bone and cartilage cell types have different progenitor cells. Chondrocytes and osteoblasts derived from mesenchymal cell lineage and osteoclasts derived from monocyte cell lineage (Figure 1.7).
Figure 1.7 – Chondrocyte, osteoblast and osteoclast differentiation, its precursors and regulation. OPG
indicates osteoprotegerin, RANKL indicates receptor activator of NF-kB ligand, TNF-α indicates tumor necrosis factor alpha, Wnt indicates wingless-int-1 oncogene, DKK-1 indicates Dickkopf-1 (inhibitor of Wnt); arrows indicate activation and intersected line (┬) indicates inhibition. From Goldring and Goldring, 2007. [92]
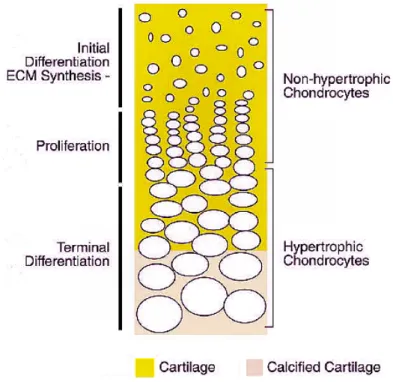
After being completely formed, the skeleton is mostly made of bone tissue. Nevertheless, specific processes during development involve formation of cartilage templates in intermediary steps. Such events occur during endochondral ossification in long bones, which involve: (i) mesenchymal stem cells condensation; (ii) differentiation of condensed stem cells into chondrocytes to form a cartilaginous template; (iii) chondrocyte proliferation; (iv) chondrocyte differentiation through a process named
hypertrophy; (v) ECM calcification by hypertrophic chondrocytes; (vi) chondrocyte apoptosis; (vii) vascularisation and degradation of calcified ECM by chondroclasts; (viii) condensation of osteoblast progenitor cells; (ix) osteoblast differentiation (Figure 1.8) [91]. During hypertrophy, chondrocyte cells produce type II collagen, which are randomly oriented fibers that confer tensile strength, and aggrecan, which is a proteoglycan that provides a solid base for the ECM [93]. Hypertrophic chondrocytes no longer produce type II collagen but instead they synthesize type X collagen.
Figure 1.8 – Representation of growth plate column in long bones. From top to the bottom are
represented are represented non-differentiated cells, then proliferating non-hypertrophic chondrocytes and finally hypertrophic chondrocytes with calcified ECM. Adapted from Karsenty et al., 2002
Endochondral ossification is controlled by several growth factors and transcription factors that regulate differentiation and proliferation of cells: Sox5, 6 and 9 (initial differentiation), Ihh (Indian hedgehog; proliferation and terminal differentiation), C-type natriuretic peptide (proliferation), fibroblast growth factor (FGF) receptor 3 (growth arrest), Wnt (wingless-int-1 oncogene; non-hypertrophic to hypertrophic
transition), Runx2 and parathyroid hormone related protein (terminal differentiation), and IGF-1 (proliferation and terminal differentiation) [91].
During flat bones formation, intramembranous ossification process takes place, involving condensation of mesenchymal stem cells and differentiation into osteoblasts. Differentiation of osteoblasts, whether in endochondral or intramembranous ossification, is also controlled by various growth and transcriptions factors, and in that sense Ihh and FGF-18 growth factors, and Cbfa1/Runx2 transcription factor seem to play key roles. Other factors, such as bone morphogenic proteins (BMPs), transforming growth factor-β and IGF, are also strongly implicated in proliferation and differentiation of osteoblasts, although their mode of action, either through direct or indirect pathways, remains uncompletely understood [91].
Differentiated osteoblasts are organized in bone as part of multicellular units named osteons, which synthesize a dense cross-linked type I collagen based matrix into which hydroxyapatite minerals (Ca10(PO4)6(OH)2) are deposited [94]. This process is assisted
by several proteins, including the tissue non-specific ALP (TNAP; which cleaves pyrophosphate, an inhibitor of ECM mineralization), osteopontin (also named bone sialoprotein; an extracellular structural protein) and osteocalcin (OC, also named bone Gla protein – BGP – a calcium-binding protein essential for correct mineral maturation) [93,94]. Nevertheless, recent results demonstrate that coexpression of TNAP and fibrillar collagen (e.g. type I collagen) is apparently sufficient for ECM mineralization to occur [94].
In general, bone growth, regeneration and homeostasis occurs through a process involving sequential osteoblast and osteoclast differentiation (and cell death) which, through their specific activities, will form or resorb the mineralized matrix, respectively [93]. In this process, osteoclast formation is induced by the release of receptor activator
nuclear factor κB (NF-κB) proteins by osteoblasts, which are in turn stimulated by
parathyroid hormone, vitamin D and several cytokines [93].
1.2.2. Insulin and IGF in vitro effects in bone-derived systems
IGFs are the most abundant growth factors in bone, where they have an autocrine/paracrine mode of action [81]. In addition, insulin and IGFs also assume important roles in bone through an endocrine mode of action [3]. In vitro, insulin and IGF (particularly IGF-1) have been shown to induce proliferation [95,96], differentiation (measured through ALP activity) [97-100], collagen synthesis (in combination with the inhibition of collagen degradation) [21,23,101-105] and anti-apoptotic effects [106] in osteoblast and osteoblast-like cell cultures (e.g. mouse primary osteoblasts and pre-osteoblastic cells MC3T3-E1, and human osteosarcoma cells MG63). Both MAPK and PI-3K pathways were shown to mediate mitogenic and anti-apoptotic effects (see also section 1.1.4) but ERK activation seems to be central in these effects. Evidences suggest that activation of MAPK pathway is essential for osteoblast differentiation through IGF-1 effects. Although data concerning insulin-like activity in chondrocytes or osteoclasts is somewhat limited, evidences point towards IGF-1 stimulation of: (i) proliferation [107,108], differentiation [109] and matrix synthesis in chondrocytes [19]; and (ii) differentiation of osteoclasts [97,110]. Studies developed in mouse ATDC5 chondrocyte cells have suggested that ERK activation triggers chondrocyte proliferation while inhibiting its differentiation [108]. Osteoclast formation and activity is apparently induced by both IGF-1 and IGF-2 in isolated rat osteoclast cultures but only in the presence of osteoblast cells (co-culture with primary osteoblast cultures or MG63 pre-osteoblast cells) [110].
1.2.3. Insulin and IGF in vivo effects in bone
Insulin and IGFs exhibit distinct effects in vivo on chondrocytes, osteoblasts and osteoclasts, as already stated in a previous section describing their in vitro effects. These
in vivo effects have been studied by reverse genetics through knockout and
overexpression (constitutive or restricted to osteoblasts) experiments in mice. Resulting phenotypes, summarized in Table I.1, clearly associate IGF-1, but not IGF-2, to bone formation rate and mineral density [3].
Table 1.1 – Mouse with mutations in IGF system and respective bone phenotype. Adapted from Dupont
and Holzenberger, 2003.
Model Phenotype Reference
IGF-1 overproduction in osteoblasts in
early development ↑ Bone formation ↑ mineral density [20]
IGF-1 constitutive knockout ↓ Mineral density, short bones [9]
IGF-2 constitutive knockout No delay in ossification [111]
IGF-1R conditional knockout in osteoblasts
↓ mineralization rate,
↓ mineral density [16]
IRS-1 constitutive knockout ↓ Bone formation [112]
Mice with altered IGF-1 and IGF-1R gene expression exhibit mineralization defects, demonstrating an important role for IGF-1 signalling during in vivo mineralization of the osteoblast ECM [16,20]. Experiments involving specific disruption of IRS-1 gene (see previous section) confirm a role of IGF signalling in osteoblast differentiation and additionally demonstrate important functions in osteoclastogenesis and bone turnover regulation [112]. Furthermore, IGF-1 effects during endochondral ossification have been linked to both stimulation of proliferation [113] and hypertrophy [19] of chondrocytes. Surprisingly, no significant bone-related phenotypes have been observed in IGF-2 knockout mice, suggesting a secondary role for this peptide in that
tissue [111]. In humans, low levels of IGF-1 in serum (resulting from a polymorphism in IGF-1 gene promoter) have been tentatively associated with a higher susceptibility to osteoarthritis and osteoporosis [114,115]. In a similar way, studies regarding insulin have mainly attempted to link type I diabetic condition in mice and human with particular bone-related phenotypes [82,87]. In streptozocin-treated mice (induced diabetes) intramembranous ossification was apparently accompanied by decreased gene expression of important transcription factors (e.g. Runx2). As a result, differentiation of osteoblasts was seriously hampered and a significant decrease in synthesis of bone matrix proteins such as OC and type I collagen [82] has been observed. In humans, diabetes is generally associated with an increased risk of fracture and osteoporosis. Histological studies have revealed lower levels of osteocalcin and decreased bone matrix formation rate [87].
1.2.4. Vanadate and its effects in bone
While adipose tissue has been the focus of most studies related to insulin-like properties of vanadium, bone has more recently emerged as a system of interest as a result of various observations: (i) vanadium has been shown to promote bone-related insulin-like effects [18,47,116,117], (ii) it accumulates in mammalian bones [118] and (iii) it affects bone formation if absent from diet [50,119]. In fact, bone is the main tissue for vanadium storage in mammals, e.g. approximately 2.4 µg V/g dry matter in goat carpal bones against only 1.6 µg V/g dry matter in kidney (the second highest concentration of vanadium in tissues) [50]. This accumulation has been proposed to be due to vanadium substitution of phosphate anions in the hydroxyapatite lattice and also to be related to a detoxification process [120,121]. However, severe malformations
1.9) suggested a mechanism involving specific interaction with growth factors signalling, in particular those known to control bone development: platelet-derived growth factor (PDGF), fibroblast growth factors (1 and 2), insulin, IGFs, transforming growth factors β (1, 2 and 3), and various BMPs [79,116]. In fact, vanadate action closely resembled insulin and IGF due to its specific effects on osteoblast differentiation, interference with TKR and specific regulation of insulin/IGF associated signalling [122].
Figure 1.9 – Newborn vanadium-deficient goat with severely deformed forelegs. In Anke et al., 2004.
Vanadium effects in bone-derived systems in vitro
Primary culture from rat and chicken calvaria were the first in vitro systems used to investigate vanadium insulin-like effects in bone [117,123], in particular the inhibition of ALP activity and the stimulation of type I collagen synthesis [122]. Two mammalian cell lines, MC3T3-E1 (developed from newborn mouse calvaria, composed of pre-osteoblasts and able to mineralize its ECM [124]) and UMR106 (developed from rat osteosarcoma, composed of differentiated osteoblasts and unable to mineralize its ECM) were later shown to be particularly useful in understanding cellular mechanisms of vanadium, insulin- and IGF-like effects. In early studies, vanadium salts (i.e. vanadate, vanadyl, hydroperoxo- and peroxovanadium) have been shown to (i) affect osteoblast cell differentiation (monitored through the measurement of ALP activity) [125]
and stimulate cell proliferation at low doses (i.e. below 25 µM), and (ii) severely impair growth at higher doses [126]. Later on, other vanadium complexes (i.e. vanadium oxalate, citrate, tartrate and nitrilotriacetate) were tested on MC3T3-E1 and UMR106 cells proliferative and mineralogenic ability, revealing effects similar to those observed for vanadate [127] but still associated with a high cytotoxicity. Promising results arose recently from a new generation of vanadium complexes (i.e. bis(maltolato)oxovanadium(IV), bis(maltolato) dioxovanadium(V), vanadyl/aspirin, vanadyl/trehalose and vanadyl/ascorbate). These complexes have revealed a lower cytotoxicity while exhibiting effects similar to those promoted by vanadium salts (in particular vanadate). They have also allowed a better characterization of cellular mechanisms associated with bone-related vanadium effects, e.g. (i) strong inhibition of PTPase, (ii) stimulation of phosphorylation of tyrosine residues and insulin/IGF signalling cascade intermediates [128,129]; and (iii) activation of MAPK and PI-3K signalling pathways (analyzed using pathways inhibitors) [130-133]. In summary, while stimulation of cell proliferation and type-I collagen synthesis were shown to be mediated by insulin-dependent mechanisms, inhibition of ALP activity was apparently insulin-independent [122]. Since ALP and collagen are critical intermediates in ECM mineralization (vide supra section 1.2.1), it is likely that vanadium biological effects in bone depend greatly on its effect on these proteins. Nevertheless, the involvement of signalling mechanisms in these effects is still poorly understood and will need to be further investigated.
1.3. Fish as a model organism to study vertebrate bone formation
development and various studies using Danio rerio (zebrafish) have demonstrated the suitability of fish models (see review by McGonnell and Fowkes [134]). Important features have recently demonstrated the suitability of fish to study vertebrate skeletogenesis, including: (i) the presence of fish orthologs for most mammalian genes, (ii) the strong resemblance of biochemical and physiological processes between fish and mammals and (iii) their important similarities in organ morphology and systems composition. In addition, fish systems present various technical advantages such as large progeny, external reproduction and fast growth.
Skeleton formation has been an important subject of study in fish. Interest in fish bone investigation has greatly increased after the detection of pathologies in zebrafish similar to those found in human systems: (i) chihuahua mutation in type 1 collagen gene can model human osteogenesis imperfecta and (ii) cranial neural crest formation in zebrafish can model human craniofacial birth defects [134,135]. Moreover, and from an economical point of view, the presence of a high rate of skeletal abnormalities in aquaculture fish species has also contributed to increase the interest in fish skeletogenesis. In that sense, skeletal development of aquaculture fish species has been extensively characterized in recent years [136]: important bone markers, such as matrix Gla protein (MGP), BMP-2, osteopontin, osteocalcin, etc, have been identified (gene and/or protein) and their role in fish tissue mineralization and bone formation has been investigated [137-141]. Conversely, important efforts have been made towards the development of biochemical, molecular and cellular biology tools from fish systems: the genomes of zebrafish, Japanese and green spotted pufferfish, Japanese medaka and stickleback have been sequenced and are available (e.g. at Ensembl sequence database – www.ensembl.org), microarrays containing thousands of genes have been constructed and cell lines have been developed. Remarkably, despite numerous fish cell lines being
available, none was derived from bone, and therefore suitable to study mechanism of tissue mineralization, until the recent development in our laboratory of two cell lines derived from the vertebra of the marine teleost fish Sparus aurata (gilthead seabream) [142].
1.3.1. Fish bone-derived cell lines: VSa13 and VSa16 cells
VSa13 and VSa16 (Figure 1.10) are bone-derived cell lines with chondrocytic and osteoblastic properties, respectively, and capable of mineralizing their ECM under appropriate conditions, although to different extents and rates [142].
Figure 1.10 – Phase contrast micrographs of VSa13 (left) and VSa16 cells (right). Cells were cultured in
Dulbecco’s modified Eagle medium supplemented with 10% fetal bovine serum, 2 mM glutamine and 1% antibiotics and antimycotics. Pictures were obtained using a Zeiss Axiovert 25 microscope and an Olympus C-3030 Zoom digital camera. Bar = 100 µm.
During ECM mineralization, both cell types deposit calcium/phosphate nodules with chemical composition similar to that of hydroxyapatite (demonstrated by X-Ray diffraction), and this process has been quantified / analyzed using staining techniques specific for phosphate (von Kossa) or for calcium (Alizarin red) [136,142]. Both cell lines express MGP and osteocalcin genes in a mutually exclusive manner (i.e. MGP is
osteocalcin is only expressed in VSa16 where it is upregulated during mineralization), further demonstrating their relation with distinct bone cell types (i.e. chondrocyte-like and osteoblast-like respectively) [143]. [143]. Finally, both cell lines produce alkaline phosphatase and fibrilar collagen in quantity suitable for in vitro studies of ECM mineralization.
1.4. Objective
The effects of insulin, IGF-1 and vanadate on bone metabolism/formation are still poorly understood and have been exclusively characterized using classical mammalian systems. There are only few data available concerning other vertebrates, and none for fish. We proposed to characterize insulin, IGF-1 and vanadate effects on VSa13 (chondrocyte-like) and VSa16 (osteoblast-like) cell proliferation and ECM mineralization, and investigate intracellular signalling mechanisms, as well as important bone-related targets (i.e. ALP activity and collagen synthesis), involved in proliferative and mineralogenic effects. Ultimately, a comprehensive knowledge of IGF system in seabream (and fish in general) is proposed through the cloning of IGF-1 transcript(s) and the characterization of gene expression pattern during development and in adult tissues.
2. Methods
2.1. Preparation of peptide, vanadate, PD98059 and wortmannin solutions
Mature peptides of bovine insulin (Sigma Aldrich) and Australian snapper (Sparidae: Pagrus auratus) IGF-1 (Novozymes GroPep) were solubilised in pH 2.0 water (i.e. 1% v/v glacial acetic acid solution) at 10 µM and in pH 6.0 water at 0.1 mg/ml, respectively.
Metavanadate stock solution (50 mM, pH 6.7) was prepared from ammonium metavanadate (NH4VO3; Riedel-de-Haen). Decavanadate stock solution was obtained
by adjusting the pH of the former solution to 4.0, as described elsewhere [55]. Acquired characteristic orange color in decavanadate solution upon acidification revealed the presence of decameric vanadate species (V10). Decavanadate stock solution was always adjusted to pH 7.0 immediately before using it. Both vanadate solutions were stored at 4°C. Although total vanadate concentration does not change, it should be noted that in case of decavanadate solutions the concentration in decameric vanadate species is effectively reduced 10-fold, meaning that stock decavanadate solutions contain 5 mM decameric vanadate species. However, vanadate concentrations are always given for monomeric vanadate (i.e. total vanadate).
PD98059 and wortmannin (Sigma Aldrich) stock solutions were prepared in DMSO at 6 and 10 mg/ml, respectively.
Milli-Q water (Millipore) was used to prepare solutions used in this work.
2.1.1. Characterization of vanadate solutions in cell culture medium
Composition of both vanadate solutions was analyzed by 51V Nuclear Magnetic
of vanadate solutions upon dilution into Dulbecco’s modified Eagle medium (DMEM #21969-035, Invitrogen; see Table AI.1in Appendix I) was analyzed in a Bruker AM-400 spectrometer at 105.2 MHz equipped with a 5-mm multinuclear inverse probe, using a 90º pulse Fourier transform technique. Spectra were acquired at room temperature using 0.5 ml of vanadate samples in the medium, containing at least 10 % D2O, under the following conditions: spectral width 45455 Hz, accumulation time
0.05 s and relaxation delay 0.01 s. 51V NMR chemical shifts are reported relative to an external reference of VOCl3 (0 ppm). The relative areas of the several free or/and bound
vanadate resonances were integrated and the line widths were obtained after subtracting the value (20 Hz) used in line broadening. The concentration of each vanadate oligomers Vx was calculated from the fractions of the total integrated areas observed in
the recorded spectra as described (Equation 1). Symbol A corresponds to the area measured for the x vanadate species with the n aggregation number (number of vanadium atoms), At the sum of measured areas and [Vt] corresponds to total vanadate
concentration [52].
[ ]
[ ]
n V A A V t t x x = × (1)The calculated concentrations of vanadate oligomers were reproducible within 2-4%. For quantitative measurements all spectra parameters were kept constant. Vanadate concentrations are always given for monomeric vanadate, i.e. total vanadium. Unlike metavanadate, decavanadate solutions are instable. The partial de-oligomerization of decameric vanadate species present at the decavanadate solutions upon dilution in DMEM was analyzed by ultraviolet/visible spectroscopy (Shimadzu UV-2401PC spectrophotometer) at 400 nm, as described elsewhere [63].
2.2. Fish culture
Eggs collected from natural spawning of seabream (from January to March, 2006) were placed at 16ºC in a closed recirculating system with 35 ppt salinity water. Light was controlled with fluorescent lamps, maintaining a 12:12 hour light-dark photoperiod. Hatching took place 48 to 56 hours after fertilization (HAF; hatched larvae approx. size 3 mm). Developing larvae were fed with rotifers from 96 HAF to 20 days after hatching (DAH; approx. size 7-8 mm) and with newly hatched Artemia nauplii from 20 to 50 DAH (approx. size 15 mm), as described in table AIII.1 of appendix III. Rotifers and A. nauplii were fed with microalgae Tetraselmis suecica and Isochrysis galbana. Selco (INVE) was introduced into larval diet between 35 and 45 DAH through the use of Selco-enriched A. nauplii. Dry food was introduced into larval diet between 45 and 70 DAH (approx. size 20 mm) through the use of Selco/dry food mixture (initially 50% and then 100% food). After 70 DAH, larvae were maintained on a dry food diet. Definitive morphology reached at approximately 90 DAH (approx. size 30 mm). Juvenile and adult fish were bred at 16-20ºC in 100 l seawater tanks with a 12:12 hour light-dark photoperiod, aeration of 100 ml/minute, and renewal flow of 1 tank/day and fed with artificial food (Sorgal).
2.3. Cell culture maintenance
Cultured VSa13 and VSa16 cells were maintained as described elsewhere [142]. Briefly, cells were cultured in DMEM (see Table AI.1 in Appendix I) supplemented with 1 % penicillin-streptomycin, 1 % fungizone, 2 mM L-glutamine and 10 % fetal bovine serum (Invitrogen), and incubated at 33 ºC in a 10 % CO2 humidified
atmosphere. Confluent cultures were divided (1:2) every 3-4 days using trypsin-EDTA solution (solution T; see appendix I table AI.2).
2.4. RNA preparations
2.4.1. RNA extraction from larvae and tissues
At appropriate times, pools of at least 10 eggs/larvae/juveniles or tissues from 1 female and 3 male adult fish (males approx. weight was 0.5 kg and female approx. weight was 2 kg; equal amount of male and female tissues were mixed) were sampled. Fish and tissue samples were washed twice in phosphate-buffered saline solution (PBS 1×; see Table AI.2 in Appendix I) before storage at -80ºC in at least 5 ml of Trizol (see Table AI.3 in Appendix I). Total RNA was extracted as described by Chomczynski and Sacchi [144]. Briefly, samples were ground to powder in liquid N2 (hard tissues)
and homogenised in Trizol using a syringe with a 20 G needle. Total RNA was first extracted from tissue homogenate with 0.2 volume of chloroform/isoamyl alcohol mixture (49:1, freshly prepared) then precipitated from aqueous phase (obtained after 15 min of centrifugation at 12000×g and 4ºC) with 1 volume of 100% isopropanol. After 1 h at -30ºC, total RNA was finally pelleted by centrifugation at 12000×g (15 min, 4ºC). RNA pellets were washed twice with ice-cold 75% ethanol and re-suspended in RNase-free MilliQ water. Total RNA concentration was determined by spectrophotometry at 260 nm using GeneQuant spectrophotometer (Pharmacia). Quality of all RNA samples was assessed on agarose-formaldehyde gels.
2.4.2. RNA preparation from cultured cells
Total RNA was extracted from cultured cells using a method adapted from
a 20 G needle (to shear genomic DNA). Total RNA was first extrated from cell homogenate with 0.1 volume of 2 M sodium acetate pH 4 (mixed by inversion), 1 volume of phenol pH 4 (mixed by inversion) and 0.2 volume of chloroform/isoamyl alcohol mixture (49:1, freshly prepared), then precipitated from aqueous phase (obtained after 15 min centrifugation at 10000×g and 4ºC) with 1 volume of 100% isopropanol. After 1 h at -30ºC, total RNA was finally pelleted by centrifugation (30 min at 10000×g, 4ºC). RNA pellets were solubilized in solution D and RNA was again precipitated, washed with ice-cold 75 % ethanol, air dried and finally sollubilized
in RNase-free MilliQ water. Total RNA concentration was determined by
spectrophotometry at 260 nm using GeneQuant spectrophotometer (Pharmacia). Quality of all RNA samples was assessed on agarose-formaldehyde gels.
2.5. Construction of genomic and complementary DNA libraries
2.5.1. Construction of genomic DNA library
Seabream genomic DNA was prepared from a pool of tissues using DNeasy Tissue kit (QIAGEN) according to manufacturer instructions, then digested with PvuII or ScaI endonucleases. Libraries were constructed using GenomeWalker Universal kit (Clontech BD Biosciences) according to manufacturer instructions.
2.5.2. Construction of complementary DNA
Full-length cDNA library were prepared using Marathon cDNA Amplification kit (Clontech BD Biosciences) according to manufacturer instructions. Poly(A+) RNA needed for library construction was purified using RNA QuickPrep Micro mRNA
Purification kit (Pharmacia) from total RNA extracted from seabream liver, kidney, brain and pituitary as described in section 2.4.
2.6. DNA amplification and cloning
Rapid amplification of cDNA ends (RACE) and amplification of full-length cDNAs were performed by polymerase chain reaction (PCR) using a 1:50 dilution of a Marathon cDNA library, Advantage Klen Taq Polymerase mix (Clontech BD Biosciences) and primers listed in Table AII.1 of Appendix II, according to manufacturer’s instructions. Amplification of genomic fragments was performed by PCR using GenomeWalker libraries, Advantage Klen Taq Polymerase mix and primers listed in Table AII.1 of Appendix II, according to manufacturer’s instructions. PCR products were size-separated by agarose gel electrophoresis, purified using the GFX PCR DNA and Gel Band Purification kit (Amersham Biosciences) and cloned into pCRII-TOPO vector (Invitrogen). Final fragment identification was achieved by DNA sequencing (Macrogen) and analyzed using BLAST facilities at NCBI (www.ncbi.nlm.nih.gov).
2.7. Sequence reconstruction
GenBank sequence database was searched in October 2006 using BLAST facilities at NCBI for sequences showing similarities to seabream IGF-1 transcripts. Species-specific sequences were first clustered, and elements of each cluster were assembled using ContigExpress module of Vector NTI Suite 10 (Invitrogen) to generate, after manual correction, accurate consensus sequences. Virtual transcripts and alternative splicing events were deduced from consensus sequences using stringent overlap criteria.
2.8. Genomic southern analysis
Aliquots (10 µg) of seabream genomic DNA, prepared using DNeasy Tissue kit were digested with 25 units of selected endonucleases (BglI, BglII, EcoRI, HindIII, PstI, and ScaI) and DNA fragments were size-separated on a 0.8 % (w/v) agarose gel for 10 h at 50 V. DNA was transferred onto a Hybond-XL nylon membrane (Amersham Biosciences) by capillarity blotting with standard saline citrate buffer 10× (SSC 10×; see composition in Table AI.6 of Appendix I). IGF-1 cDNA probe (199 bp corresponding to cDNA positions 357 to 555 bp) was radiolabeled with [α-32P]dCTP (3000 Ci/ml) using the Rediprime II kit (Amersham Biosciences) and purified from unincorporated nucleotides using MicroSpin G-50 columns (Amersham Biosciences). Hybridization of the blot was performed overnight at 42°C in ULTRAhyb solution (Ambion). Blots were washed 2×5 min in low stringency solution (SSC 2× and 0.1 % SDS) and 3×15 min in high stringency solution (SSC 0.1× and 0.1 % SDS) at 60°C, then autoradiographed.
2.9. Quantitative real-time PCR
Real-time PCR (qPCR) was performed using iCycler PCR system and software (Bio-Rad). Total RNA (1 µg) samples from seabream were treated with RQ1 RNase-free DNase (Promega) and reverse-transcribed using moloney murine leukemia virus reverse transcriptase (Invitrogen) and specific reverse primers listed in Table AII.2 of Appendix II. The following reverse transcription reaction conditions were used: 3 min at 60ºC, 5 min at 4ºC, 1 h at 37ºC and 5 min at 95ºC. PCR amplification of cDNA fragments was performed using the iQ SYBR Green I mix
(Bio-Rad), 10 ng of reverse-transcribed RNA and specific primers listed in Table AII.2 of Appendix II. The following PCR conditions were used: 4 min at 95ºC, 40-50 cycles (each cycle is 30 s at 95ºC, 15 s at 68ºC). Changes in gene expression were determined through normalization of each transcript threshold cycle with that of corresponding housekeeping gene (β-actin or ribosomal protein L27a (RPL27a), assumed to be invariant) [145]. This operation was performed using Bio-Rad RelQuant excel sheet.
2.10. Cell viability assay
Cytotoxic and proliferative effects on cells were assessed through cell viability analysis using the CellTiter 96 non-radioactive proliferation assay kit (Promega) according to manufacturer’s instructions (adapted from the protocol developed by Mosmann [146]. Briefly, tetrazolium reagent (3-(4,5-dimethylthiazol-2-yl)-5-(3-carboxy-methoxyphenyl)-2-(4-sulfophenyl)-2H-tetrazolium; inner salt, MTS) and the electron-coupling reagent, phenazine methosulfate, were mixed in solution in a 20:1 proportion. Once added to cell culture, MTS is reduced into formazan by a mitochondrial dehydrogenase found in metabolically active cells. Formazan formation, which is proportional to the number of living cells [147], was followed at 490 nm in 96-well tissue culture dishes using a Bio-Rad Benchmark microplate reader. Incubation with 20 µl of reagent mixture during 1 h was determined to be the optimal after being observed linearity between number of cells and formazan absorbance at 490 nm wavelength (see Figure AIV.1 in Appendix IV,). Effects were either analyzed in confluent cell cultures or low-density cell cultures (starting from 1.5×10³ cells/well).
2.11. ECM mineralization and nodule detection
Cells were seeded in 24-well plates at 2×10⁴ cells/well using culture conditions described in section 2.3. To induce ECM mineralization, cells were treated with 50 µg/ml L-ascorbic acid (vitamin C), 10 mM β-glycerophosphate and 4 mM CaCl2 during 4 weeks. At appropriate times, cells were washed 3 times with ice-cold
PBS, fixed with 10% formaldehyde (in PBS 1×) for 1 h at 4ºC, washed 3 times with MilliQ water, then incubated with 5% silver nitrate for 30 min under ultraviolet light. Relative levels of ECM mineralization were determined by densitometric analysis using Quantity One software (Bio-Rad).
2.12. Protein quantification
Protein concentration in cell extracts was determined using Bradford reagent (Sigma Aldrich) according to manufacturer’s protocol (adapted from Bradford [148]). Standards and samples were prepared according to Table AIII.2 of Appendix III using 2 mg/ml bovine serum albumin (BSA; Pierce) or 10 µl of each sample, then incubated approximately 10 min with reagent. Absorbance was measured at 595 nm in a Thermo Helios-γ spectrophotometer.
2.13. ALP activity
Cells were washed 3 times with PBS 1× and scrapped using 500 µl of 0.1% Triton X-100. Samples were centrifuged at 16000×g and supernatants collected and stored at -20 ºC until further analysis. Protein content was determined as described in section 12 of Methods. ALP activity was measured at 37ºC through spectrophotometric analysis of initial rates of hydrolysis of p-nitrophenyl phosphate (Sigma Aldrich) into p-nitrophenol
at 405 nm, using a Shimadzu UV-2401PC spectrophotometer. The following reaction mixture has been used: 800 µl of ALP reaction buffer (see Table AI.4 of Appendix I), 100 µl of p-nitrophenyl phosphate (5 mM in reaction buffer) and 100 µl of supernatant (used to set the reaction). ALP activity was normalized with protein content and presented as nmol of p-nitrophenol (considering ε = 18200 M-1 cm-1) formed per min
and per mg of total protein.
2.14. Total collagen content
Collagen fibbers of ECM were stained using Sirius red dye as described by Tullberg-Reinert and Jundt (1999) [149]. Briefly, cell cultures were washed 3 times with PBS 1× then fixed for 1 h using Bouin’s fluid (see Table AI.5of Appendix I). After fixation, cells were washed with running tap water during 15 min, air dried and incubated 1 h (gentle agitation) with Sirius red staining solution (see Table AI.5 of Appendix I). Unbound dye was removed by extensive wash using 0.01 N HCl. Coloration was observed under an Axiovert 25 inverted light microscope (Zeiss) and quantified in a Bio-Rad Benchmark microplate reader at 550 nm after dye re-suspension in 200 µl of 0.1 N NaOH solution.
2.15. Vanadium accumulation in cell extracts
Cells were incubated with vanadate solutions during 24 h. At appropriate times, cultures were washed 3 times with PBS 1×, supplemented with 1 ml of MilliQ water and placed at -80ºC for at least 12 h. Frozen cells, thawed at room temperature, were scrapped from plates and transferred into 2-ml microcentrifuge tubes. Plates were washed with 1 ml of MilliQ water then pooled with first extract (total volume sample
was 2 ml). Total protein content in samples was quantified as described in section 12 of Methods. Remaining sample was digested at 100ºC with 30 µl of 65 % HNO3 and final
solid residues dissolved in 5% HCl solution. Vanadium concentration was determined by atomic absorption spectrometry analysis using a GBC Avanta atomic absorption spectrometer equipped with a GBC GF 3000 graphite furnace system and a GBC PAL 3000 auto sampler working at a furnace program of 63 s with an argon gas flow of 3.0 l/min. The vanadium lamp was operated at 318.2 nm, with slit width of 0.2 nm, and the instrument was calibrated against a series of solutions containing 12.5, 25, 37.5 and 50 ppb of vanadium. Calibrating standards were obtained by successive dilutions of a standard solution of vanadium 1002 ± 2 mg/l (Merck). The detection and quantification limits of the instrument for these analysis conditions, determined according to ISO 8466-1, were 5 and 11 ppb, respectively.
3. Results
3.1. Short exposures of vanadate oligomers differently affect VSa13 cells
3.1.1. Spectral analysis of metavanadate and decavanadate oligomers in DMEM
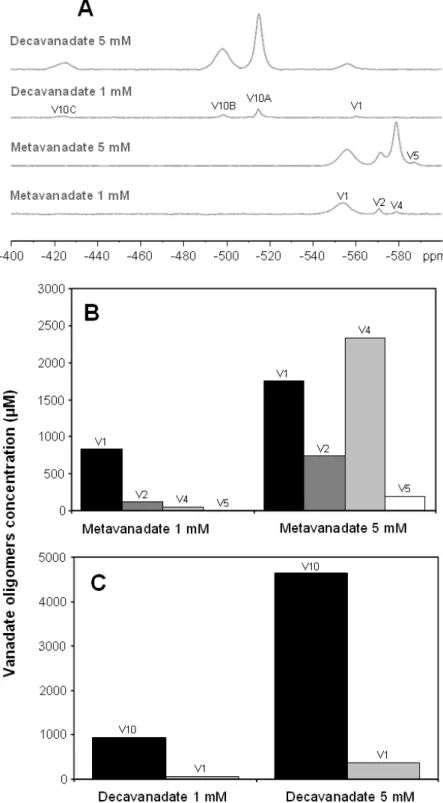
51V NMR spectroscopy of decavanadate-DMEM solutions (1 and 5 mM at pH 7.0),
revealed three signals attributed to three specific vanadium atoms in V10 structure: V10A at -515 ppm, V10B at -498 ppm and V10C at -425 ppm (Figure 3.1 A). Similarly, signals detected in metavanadate-DMEM solutions (1 and 5 mM at pH 7.0) were attributed to mono (V1), di (V2), tetra (V4) and pentameric (V5) vanadate species at -556 , -571 , -579 and -587 ppm, respectively (Figure 3.1 A). Monomeric NMR signal is clearly broadened, with a half line-width value (270 Hz) approx. 3.4-fold of normal value (80 Hz) [65], probably due to vanadate interactions with compounds present in DMEM such as glucose (25 mM) and pyruvate (1 mM), or even interactions with proteins from FBS, also present in culture medium [53,65]. Concerning each vanadate oligomers concentrations in metavanadate solutions in DMEM (1 and 5 mM), different profile has been observed (Figure 3.1 B). Interestingly, different profiles have been observed for each concentration of metavanadate in DMEM: while tetrameric species were predominant at 5 mM, monomeric vanadate was the most abundant at 1 mM (Figure 3.1 B). On the contrary, the profile of decavanadate solutions was similar since decameric species present in the solutions increased linearly with total vanadate concentration (Figure 3.1 C).

![Figure 1.5), and to promote distinct effects depending on that oligomerization [53-57]](https://thumb-eu.123doks.com/thumbv2/123dok_br/18896509.934685/24.892.253.650.314.687/figure-promote-distinct-effects-depending-oligomerization.webp)