presented byLucia Mendonça Previato
ABSTRACT
Stereological studies are more and more frequent in literature, particularly in the development/evolution, pathology, and neurosciences areas. The stereology challenge is to understand the structural inner three-dimensional arrangement based on the analysis of the structure slices only showing two-three-dimensional infor-mation. Cavalieri and Scherle’s methods to estimate volume, and Buffon’s needle problem, are commented in the stereological context. A group of actions is needed to appropriately quantify morphological structures (unbiased and reproducibly), e.g. sampling, isotropic and uniform randomly sections (Delesse’s principle), and updated stereological tools (disector, fractionator, nucleator, etc). Through the correct stereology use, a quantitative study with little effort could be performed: efficiency in stereology means a minimum slices sample counting (little work), low cost (slices preparation), but good accuracy. In the present text, a short review of the main stereological tools is done as a background basis to non-expert scientists.
Key words:morphometry, stereology, volume density, surface density, length density,disector,fractionator.
INTRODUCTION
Morphologists are traditionally interested in form and composition of structures in macro, meso, microscopic, and ultrastructural levels. Recently, morphologists have benefited by the use of genetic and molecular techniques to help the understand-ing of their problems thus improvunderstand-ing biological and biomedical researches. However, questions con-cerning quantitative alterations of tissues, cells or cellular organelles (which frequently appear in adaptation, evolution or pathology of an organism), as well as a better correlation between morphology and function, need a quantitative approach to be well understood (Weibel 1989, Mayhew 1992, Roberts et al. 2000, Andersen and Pakkenberg 2003). The de-velopment of a quantitative structural platform for
E-mail: mandarim@uerj.br
experimental biology, extending across a hierarchy of sizes ranging from molecules to organisms, has been punctuated by a series of major achievements over the last years (Bolender 1992).
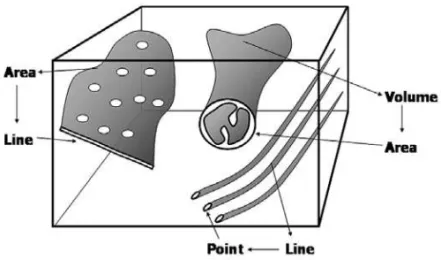
The stereology challenge is to understand the structural inner three-dimensional arrangement based on the analysis of the structure slices that show only two-dimensional information (Figure 1); for that stereological principles take into consideration geometry and probability statistics (Weibel 1979, Jensen 1998).
mi-Fig. 1 – Observation of three-dimensional structures in two-dimensional slices. Volumes (mitochondria) appears as area, areas (endoplasmic reticu-lum) appears as line, and lines (microtubules) appears as point.
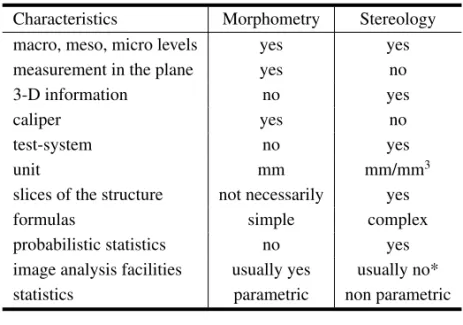
crometer screw for the measurement of thin objects under microscopic observation). On the contrary, stereology does not use a caliper (and does not per-form a direct measurement), but a test-system usu-ally composed by test-points, test-lines over a known frame (or test-area). Major differences between morphometry and stereology are summarized in Ta-ble I (Mandarim-de-Lacerda 1999).
Morphometry determines lengths, perimeters, areas, and benefits of image analysis software’s fa-cilities. Stereology estimates densities; the most interesting are the densities per volume: volume density (Vv), length density (Lv), surface density (Sv), and numerical density (Nv). Densities per area can also be estimated and informative: area density (AA) and numerical density per area (NAor QA) are
more frequently estimated (Pereira and Mandarim-de-Lacerda 2001b).
All indices are estimated by the application of specific formulas that will be better demonstrated in the sequence. However, the accuracy of calcu-lations is based on the statistics principles (sample size, randomization, and isotropy). The aim of the sampling design for stereology is to obtain the maxi-mal amount of quantitative structural information at a given total cost or effort. Principles of such opti-mal designs and methods for generating them will be
discussed. In general, the variation between differ-ent individuals (the biological variation) is the major determinant of overall efficiency, whereas the vari-ation between single microscopic features is unim-portant. However, spend time and/or money in order to increase the precision of the individual measure-ments is irrational in almost all studies emphasizing biological results. This could be summarized by the sentence ‘‘do more less well’’ (Gundersen and Os-terby 1981).
In the last 50 years, stereological studies have appeared in literature more and more frequently, the first studies being based on pioneers (Chalkley 1943, Abercrombie 1946, Chalkley et al. 1949, Weibel and Gomez 1962, Weibel et al. 1966). The so called ‘‘new stereology’’ was developed in the XXth century’s eighties, a collection of procedures turn-ing stereology easier and unbiased (Gundersen et al. 1983, Sterio 1984, Gundersen 1988) – in reality, the question of bias and stereology is still under discus-sion, but new techniques make stereology more con-sistent (Hedreen 1999, Baddeley 2001, von Bartheld 2002, Gardella et al. 2003). A simple explanation about accuracy and bias in quantitative studies can be verified in the schema of Figure 2.
unit mm mm/mm slices of the structure not necessarily yes
formulas simple complex
probabilistic statistics no yes image analysis facilities usually yes usually no* statistics parametric non parametric
stimulates stereologists to test possibilities, an ex-citing example is the ‘‘virtual isotropic spheres probes’’ technique, because the surface of a sphere is perfectly isotropic, all intersections of linear fea-tures with the surface have an equal probability (Cruz-Orive and Gual-Arnau 2002, Mouton et al. 2002).
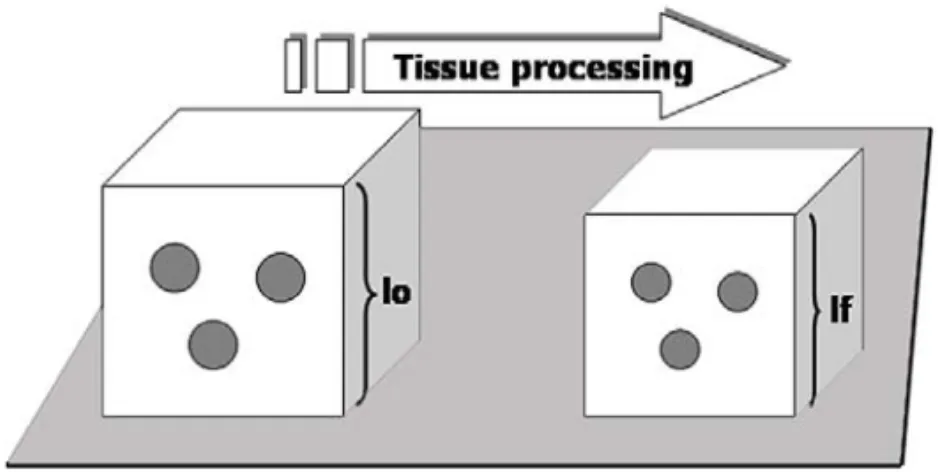
It must be considered that paraffin – or similar embedding media like Paraplast or Paraplast Plus – causes an intrinsic distortion of structures: the shrinkage caused by fixation, dehydration and paraf-fin infiltration (Figure 3), and compression caused by the knife action in microtomy direction (Fig-ure 4) (Weibel 1979). In paraffin embedded mate-rial shrinkage can be around 25% and compression around 10% relative to the fresh material (Manda-rim-de-Lacerda et al. 1985, Manda(Manda-rim-de-Lacerda and Penteado 1988). Despite this, it is possible to de-termine accurate quantities of morphological struc-tures in tissue or cell levels mathematically enlarging the results by multiplying the measurement by the shrinkage and the compression factors previously determined (Mandarim-de-Lacerda et al. 1987). However, the scope of the stereology is far to be a ‘‘magic’’ number, an ‘‘exact’’ quantity of cells. The ‘‘exact’’ in this case has a statistical point of view. Therefore, the study frequently tries to com-pare quantities among different groups, the material being prepared similarly. Through the comparison, if the shrinkage and the compression are the same in all groups, its correction might be not necessary (all mathematical correction is inaccurate; sometimes it leads to more bias, becoming more difficult to inter-pret in biological terms, than not corrected material).
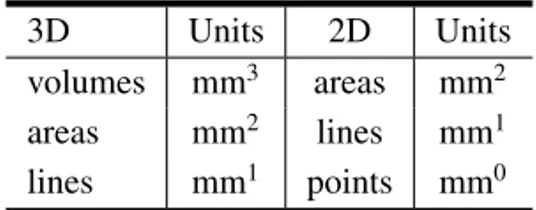
TABLE II
3D representation in 2D (see Figure 1).
3D Units 2D Units
volumes mm3 areas mm2
areas mm2 lines mm1 lines mm1 points mm0
It is easy to understand how morphometry and/or stereology can be useful in studies regard-ing the development (Mandarim-de-Lacerda 1991a, b, Almeida and Mandarim-de-Lacerda 2002), ag-ing process (Duffell et al. 2000, Aguila and Man-darim-de-Lacerda 2001, Pakkenberg et al. 2003), and pathological diagnosis (Elias et al. 1981, Col-lan 1985, Hamilton and Allen 1995, ColCol-lan 1997, Hof et al. 2003). Pathologists made an effort to establish new and accurate classifications to am-biguous pathologic diagnoses, mainly in carcinomas (any of the various types of malignant neoplasm derived from epithelial tissue in several sites), al-lowing a prognostic estimate (Hansen et al. 1998, Ladekarl 1998).
Stereological studies have scientific advantages over qualitative studies. Firstly, results are numeri-cal (not subjective), then reproducible and easier to be verified at any time by different laboratories. Sec-ondly, the comparison among different groups (ages, species, drug actions, manipulations, etc) are split out more easily; therefore, these methods are par-ticularly useful to test those situations. Thirdly, fas-tidious work commonly associated with quantitative studies practically disappeared with the strict sam-pling strategy and the computer-aided way to per-form modern stereology. Fourthly, well-established theoretical background makes the method largely acceptable. Fifthly, the need of short time train-ing for young scientists. And finally, the need of low-cost equipment (but a high-standing equipment like a confocal laser scanning microscope is wel-come) (Bolender 1981, 1982, Gundersen et al. 1999, Bjarkam et al. 2001, Kubinova and Janacek 2001, Kubinova et al. 2001, Pereira and Mandarim-de-Lacerda 2002, Charleston et al. 2003, Davey et al. 2003).
METHODOLOGICAL PREMISES
Fig. 3 – The shrunken tissue block (right side) occupies a smaller volume than the original fresh tissue volume (left side); lf and lo are some characteristic lengths in the shrunken and the original tissue block, respectively. The original volume (Vo) can be estimated from the shrunken volume (Vs): Vo = Vs . (lf/lo)3where If and lo are lengths in the shrunken and the original tissue block, respectively.
will see in the sequence. However, some questions in stereology are solved by, or benefits from parallel principles.
A. The Volume Estimation
Frequently we need to estimate the volume of an entire organ or parts of an organ. This measure-ment is essential to estimate absolute stereological quantities, as we will see ahead. Two main meth-ods are normally used to this estimate, the ‘‘water displacement’’ method and the procedure using the Cavalieri’s principle.
The volume determination by liquid displace-ment was solved by Archimedes (287-212 B.C.). King Hiero of Syracusa found the crown made by a goldsmith lighter than he estimated (by the gold quantity he gave the goldsmith to make the crown). Observing the water displacement when he went down into a public bathing pool, Archimedes re-alized he could solve the problem. At that moment he started running naked, crying Eureka! Eureka! which means, in ancient Greek, I found it! I found it! – This principle was adapted to the small or-gan’s volume estimate, the volume is determined according to the submersion method in which the isotonic saline displacement due to the organ volume is recorded by weighing (W) (Scherle 1970). As the specific gravity(σ )of isotonic saline is 1.0048 the volume (V) is obtained by: V=W/σ, or simple V≈W (Weibel 1979). Normally, weight is measured in grams that need transformation to a volume unit like cubic millimeters, for example (remember: 1g is equal to 103mm3).
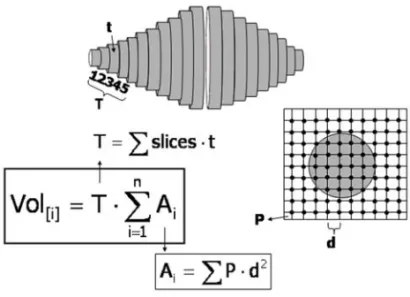
The Italian mathematician Bonaventura Cava-lieri (1598-1647) inspired by ancient Greeks demon-strated that the volume could be determined in a serially sectioned structure by the product of the slice areas and the slice thickness. From the view-point of applied stereology, Cavalieri showed that the volume of an arbitrary shaped object can be es-timated in an unbiased manner from the product of the distance between planes (T) and the sum of ar-eas on systematic-random sections through the
ob-ject(A)(Mouton 2002). Figure 5 illustrates the method, if the areas are determined by point count-ing, the volume will be estimated without any mea-surement, just point counting. The method is useful in organs that absorb water rather than displace it or in organs like lung that do not displace water (Michel and Cruz-Orive 1988). Particularly, it is useful in microscopic structures, like the otic ganglion in rat (Costa et al. 1991) or in structures enmeshed into a tissue like the heart conduction system (Mandarim-de-Lacerda and Penteado 1988).
B. Delesse’s Principle
‘‘...D’après ce qui precede, on a ramené l’évalua-tion des volumes des différents minéraux à l’éval-uation des surfaces qu’ils présentent dans les
sec-tions de la roche; mais il est facile de reconnaître qu’en supposant toujours la roche homogène, on ramènerait de même cette évaluation à celle des longueurs interceptées par les différents minéraux sur les lignes menées dans ces sections; quoique la détermination de ces longueurs puisse se faire assez
simplement au moyen d’une ligne divisée sur laque-lle on les lirait presque immédiatement’’ (Delesse 1847).
In a rock, composed of a number of minerals, the area occupied by any given mineral on a surface of a rock section is proportional to the volume of the mineral in the rock. The Delesse’s principle is based on homogenous structures (in stereological viewpoint in ‘‘isotropic and uniform random, IUR, sections’’). Only in this case we can accept that:
PP PT = LL LT = AA AT = VV VT
that means, in IUR sections, the ratio between the partial points (PP) counted on a section in relation to
the total possible points or test-points (PT) is
equiva-lent to the ratio between lengths (partial, LL, to total
length, LT), areas (partial, AA, to total area, AT) and
volumes (partial, VV, to total volume, VT).
Fig. 5 – Cavalieri’s principle and the organ volume estimation. The organ is serially cut with uniform thickness (t). For example, one every five sections (T=5t) is measured to determine area (for example by point counting method: in a square array test system the point area is calculated as the square of the distance between points, d).
just by point counting. The volume fraction or vol-ume density (VV) is a powerful robust stereological
estimate, i.e. VVcould be estimated even when the
IUR section cannot be proved at first.
C. Holmes Effect
The ideal specimen is an infinitely thin section. The area occupied by any given component may be over-estimated. To the eye placed above the section, the image of the component will appear to occupy a larger area on the surface of the section than it does in fact. In the case of particles with good contrast, it is usual to make some allowance for the Holmes effect if the mean diameter of the particle is less than 12 times the section thickness (Aherne and Dunnill 1982). Figure 6 shows spheres cut by a thin section and a thick section. Consequently, stereological es-timate must take into account the Holmes effect. A mathematical correction of the Holmes effect can be done, although no correction is preferable by us-ing thin sections. In practice, sections with no more than 3µm thick are useful to most of stereological procedures (an exception to the use of thin sections is thedisector’s method, where thick section over 20µm could be used).
Fig. 6 – The Holmes effect not only interferes with size esti-mation, but also with the determination of volume ratio since particles overlap (right side). In sufficiently thin sections (left side) this problem doesn’t exist.
D. The Buffon’s Needle Problem
Georges-Louis Leclerc ‘‘Count of Buffon’’ (born Sept. 7, 1707, Montbard, France died on April 16, 1788, in Paris). French naturalist, remembered for his comprehensive work on natural history, ‘‘His-toire Naturelle, Générale et Particulière’’ (begun in 1749). He was created a count in 1773.
joueurs parie que la baguette ne croisera aucune des parallèles du parquet, et que l’autre au contraire parie que la baguette croisera quelques-unes de ces parallèles; on demande le fort de ces deux joueurs. On peu joueur ce jeu sur un damier avec une aiguille à coudre ou une épingle san tête’’ (Buffon 1777).
The needle problem was ‘‘what is the chance a needle tossed in the air will intersect lines on a par-quet floor?’’ In the modern stereology the question should be ‘‘what is the probability that a randomly placed line will intersect a grid of parallel lines?’’ (Mouton 2002). Based on this, the border (b) and, consequently, the surface density (SV) of a structure
can be estimated (Figure 7):
b = π
2 ·d·I SV = 2·I
LT
whered is the distance between the lines of a test-system,Iis the number of intersections of the struc-ture boundary with the lines, and LT is the total
length of the lines. The SV is a sensible (not
ro-bust) estimate; the IUR sections premise needs to be respected at first (Cruz-Orive and Weibel 1990).
E. Producing IUR Sections
An organ has homogeneous (isotropic or not ori-entated) structure when we are not able to decide the orientation section observing its histological ap-pearance; otherwise, the organ has a heterogeneous (anisotropic or orientated) structure.
IUR sections are the morphological basis to use stereology. IUR sections always can be obtained to allow stereological studies. In organs with homo-geneous structure (liver, salivary glands, etc) IUR sections are easy to obtain, cutting the tissue and staining the slices is enough. Organs with a hetero-geneous structure need a special procedure to obtain IUR sections. To destruct the internal structural ori-entation of an organ two main methods have been proposed: theorientator(Mattfeldt et al. 1990) and the vertical sections (Baddeley et al. 1986).
The orientator is an evolution of the ortrips (Mattfeldt et al. 1985): it is theoretically shown that in anisotropic specimens the precision of Lv and Sv
Fig. 7 – Buffon’s needle problem and a practical determination of perimeter (b) based on the knowledge of the line distance (in a test-system) and the number of intersections of the structure boundary with the lines (I).
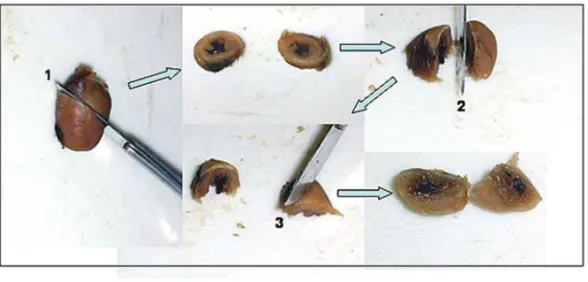
Fig. 8 – Generalization of the orientator method in rat heart preparation. First, the heart is cut at random (1) and after the two halves are put on this face and cut again at random (2), and again (3). This last face has no more information about the structural arrangement of the structure and can be considered isotropic and uniformly random.
and taking sections perpendicular to the plane of the table. Stereology’s standard methods assume IUR sections, and they are not applicable to this kind of biased sampling. However, using specially designed test systems (cycloid arcs test-system), an unbiased estimate of surface area can be obtained (Mandarim-de-Lacerda and Pereira 2001). No assumptions are
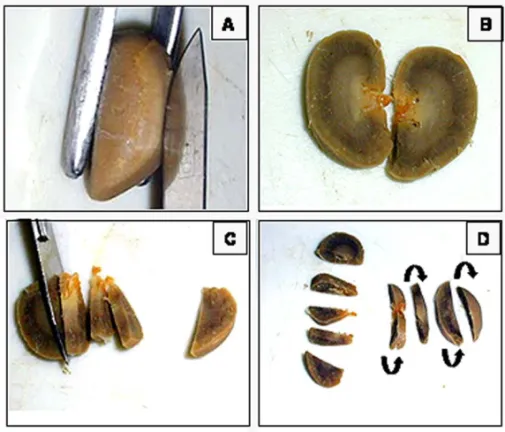
Fig. 9 – Generalization of the vertical section method in rat kidney. For the kidney, select an arbitrary horizontal reference plane (e.g. the laboratory bench). Once a reference plane has been selected for a particular object it is then considered as fixed. Generate an isotropic orientation in the horizontal plane (A and B). Section the kidney with uniform random position along this orientation (C and D). The object is given an isotropic rotation on the horizontal plane (D). A cycloid arcs test-system (Figure 11) must be used with these sections.
TEST-SYSTEMS AND DATA ACQUISITION
Stereological studies need test-lines, test-points and a known frame (test-area) to get information from the slices. All together, lines, points and frame com-pose a test-system. Usually, test-systems have a known line length (LT), total points (PT), and
test-area (AT). Stereology needs this information to
esti-mate volume density (VV:=PP/PT), length density
(LV:=2.QA), and surface density (SV:=2.I/LT) (we
use := because it is an estimate).
Any test-system needs to be superimposed to an image. It can be mounted into microscope’s eye-piece, or drawn in acetate and put over the glossy prints (this is normally the case with electron mi-crographs), or over monitor screen in a video-microscopic system. Anyhow, we need to count
lines and points hitting tissue structures, or number of objects into the frame, to get enough informa-tion to the stereological formulas (Gundersen et al. 1988b, Cruz-Orive and Weibel 1990, Mandarim-de-Lacerda 1999).
Figure 10 shows a classic test-system called a ‘‘multipurpose test-system’’, or M42. A short line length,d, is used to calibration; AT is 36.36d2, LT
is 21d and PT is 42 (Weibel et al. 1966). Another
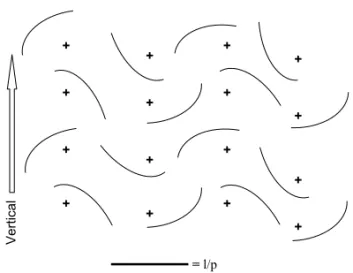
test-system composed by cycloid arcs is particularly useful with vertical sections and stratified samples (skin, mucosa, cortex, etc) (Figure 11) (Gundersen et al. 1988b). If SV do not need to be estimated
– remember that SV is not robust, need IUR
sec-tions and, therefore, a major effort (great cost) is normally necessary to estimate SV– a test-system
Fig. 10 – M42 test-system. This system has 21 short lines with known length (d) and two test-points in each extremity (PP, 42
test-points in total). The test-area is 36.36d2. The thicker lines are ‘‘forbidden’’ (see explanation in Figure 13).
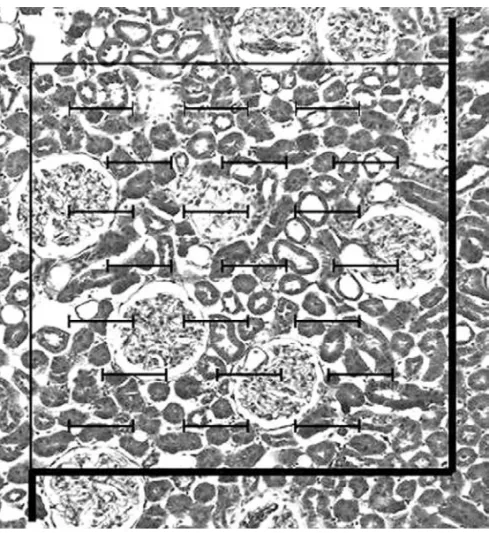
In Figure 14 example, a slice of the renal cor-tex observed under light microscopy is to be counted with the M42 test-system. With the picture magni-fication short line (d) corresponds to 25µm (con-sequently, AT=22,725µm2and LT=525µm). Five
glomeruli can be counted into the frame not hitting the forbidden line or its extensions (N=5), seven points hit glomeruli (Pp=7), and six lines intersect
Bowman’s capsule (I=6). In these conditions, Vv:=16.7%; QA (or NA):=(5/22,725)/µm2 or
220/mm2; S
V:=0.0229µm2/µm3 or 23mm2/mm3.
A routine for that calculation can be simplified with a software facility. Of course, this is the result of only one microscopic field. The stereological work
Fig. 11 – Cycloid arcs test-system. Crosses are test-points (n=16). The cycloid arc length is defined as the short line (l/p). The system must be aligned with the sections by the arrow (left side).
Fig. 12 – A test-system with 36 points. This system without lines allows fast counting and can be appropriated to majority of uses.
Fig. 13 – Test frame for profile counting: thicker line represents ‘‘forbidden line’’ (all structures hitting this line are not consid-ered). In the schema only white circles are counted (based on Gundersen 1977).
effort to obtain results. A better efficiency is ob-tained counting less, therefore spending less money (with material, technical preparation, etc), but main-taining the accuracy (remember the comment of the Introduction ‘‘do more less well’’) (Gundersen and Osterby 1981).
ESTIMATION OF OBJETS QUANTITY
The objects quantity estimation is a crucial issue in stereology. This is partially answered with the esti-mate of the objects number into a frame (QAor NA)
(Mussel et al. 2003), but it is not enough to study three-dimensional structures. Instead, over the past years a great effort was made to found a reproducible method to estimate the numerical density (Nv) of ob-jects, but, until 1984 all these methods had intrinsic bias (Weibel and Gomez 1962, Aherne 1967) – we recommend classic textbooks for a detailed discus-sion about these old methods (Weibel 1979, Aherne and Dunnill 1982, Elias and Hyde 1983). A truly deep change about the problem of the objects quan-tity estimation in three-dimensional space occurred with the work published by the nicknamed Sterio
and the idea of the‘‘disector’’method (note that the word‘‘disector’’has only onesaccording to its first description) (Sterio 1984).
Most authors consider thedisectormethod un-biased (Bendtsen and Nyengaard 1989, Fiala and Harris 2001, Charleston et al. 2003), but not unan-imously (Hedreen 1999, Baddeley 2001, von Bar-theld 2002). When thedisectormethod completed 10 years of use an interesting review demonstrates how the method extended in literature with great impact on the counting and sizing of biological par-ticles (Mayhew and Gundersen 1996).
Figure 15 shows the basic principles of the di-sectormethod in which Nv is obtained in sets of two parallel sections with a known separation (thick-ness). To avoid overestimation of counts one plane (look up plane or look down plane) is considered for-bidden and counts must be made only on one plane (because this count is named Q–). For example, if
the look down plane is considered forbidden no ob-jects hit by this plane are counted, but hit by the look up plane. Counts are made into a frame of known area AT(considering the forbidden line and its
ex-tensions like described before). So, a test-volume is constructed (ATmultiplied by thickness), count into
this test-volume is considered unbiased (Gunder-sen et al. 1988a, Mandarim-de-Lacerda and Costa 1993, Mandarim-de-Lacerda et al. 1995, Burity et al. 1996, Aguila and Mandarim-de-Lacerda 1999, Mandarim-de-Lacerda and Pereira 2000, Pessanha and Mandarim-de-Lacerda 2000, Melo et al. 2002). The optical disector consists of counts made in thick sections observed with a light microscope adapted with axis-z mobile stage (to exactly deter-mine the distance between up and down planes of thedisector, or thickness t). The physical disector consists of counts made on photomicrographs (Fig-ure 16) (Pereira and Mandarim-de-Lacerda 2001a) or electron micrographs of up and down planes. The numerical density of objects (NV) can be
es-timated as:
NV[object] = Q
−
Fig. 14 – Photomicrograph of the renal cortex with the M42 test-system superimposed (see text).
The absolute number of objects (N) can be es-timated if the organ (tissue) volume is known (V, Scherle’s method of water displacement or Cava-lieri’s method already described): N = NV·V.
The fractionatoris another unbiased method used to quantify the object number. It uses the manual technique of blood cells counting principle, blood is diluted many times and, at the end, blood cells are counted in this diluted sample. The counted number must be multiplied by the dilutions, allow-ing the number of cells estimate in the intact blood. With the fractionator technique the same process occurs. The organ is completely sliced, a known fraction of slices is taken (for example, oneevery threeslices) and cut away in strips, a known frac-tion of strips (for example,oneeveryfourstrips) is taken and cut away in fragments, a known fraction of the fragments (for example,oneeveryfive frag-ments) is embedded and serially sectioned. Finally,
a known fraction of the sections is analyzed (for ex-ample,oneeverythreesections) and all objects are counted in these chosen section. This counted num-ber (N[counted]) must be multiplied by fractions to
re-compose the absolute number of objects (N[objects])
in the organ (Pakkenberg and Gundersen 1988, West et al. 1991, Nyengaard and Bendtsen 1992).
In the example above
N[objects] = N[counted]·3·4·5·3.
LAST BUT NOT FINAL WORDS
(volume-Fig. 15 – Schematic representation of the ‘‘disector’’ method. Disector is the union of a reference plane with an unbiased counting frame of area AT and a look-up plane at distance t apart. Four particles are in relation to the disector’s volume (calculated as AT x t). In the disector’s volume we consider the forbidden line (relative to AT, see Figure 13) and a forbidden plane. All particles hitting forbidden line or forbidden plane are not considered. In the example, we suggest the look-down plane as forbidden plane. In right side up and down we see the schema of the slices with the particles profiles. Up slice shows particles 1, 3 and 5. Down slice shows particles 3 and 4. In the up slice particle 5 hit forbidden line. Therefore, only particle 1 in up slice must be counted.
weighted nuclear volume, bone star volume, nucle-ator, etc) to follow this text characteristics, but it does not imply they are less important for the mor-phological quantification. For more details, read-ers are driven to complete and updated textbooks (Howard and Reed 1998, Russ and Dehoff 2000, Mouton 2002). Statistical analysis of stereological data is an important complement to the present text (Jensen 1998).
ACKNOWLEDGMENTS
The author wish to thank his colleagues of the Post-Graduate Program of Morphology, Institute of Bi-ology, State University of Rio de Janeiro (UERJ), for their continuous encouragement and discussion about different situations of quantitative morphol-ogy, and also wish to thank graduate and
undergrad-uate students that often stimulate the author with their interesting (sometimes embarrassing) ques-tions about stereology. Author’s laboratory is spon-sored by grants from CNPq and FAPERJ.
RESUMO
Estudos estereológicos são cada vez mais freqüentes
na literatura, particularmente nos campos do
desenvolvi-mento/evolução, patologia e neurociências. O desafio da
estereologia é interpretar o arranjo estrutural
tridimen-sional interno com base na análise de cortes da
estru-tura que mostram apenas uma informação bidimensional.
São comentados nesta revisão, no contexto da
estereolo-gia, os métodos de avaliação de volume de Cavalieri e de
Scherle, assim como o problema das agulhas de Buffon.
Um conjunto de ações é necessário para quantificar
Fig. 16 – Example of a physical disector made with myocardium. The look-up plane is represented by A and the look-down plane is represented by B. Arrows show cardiomy-ocyte nuclei shadows in the opposite plane of the disector. If we consider the look-down plane forbidden three sharp nuclei are counted in A because these nuclei don’t hit the look-down plane (based on Pereira and Mandarim-de-Lacerda 2001a).
reprodutível), i.e. amostragem correta, cortes aleatórios
e uniformemente isotrópicos (princípio de Delesse),
fer-ramentas estereológicas atualizadas (disector,
fractiona-tor, nucleafractiona-tor, etc). Usando corretamente a estereologia
pode-se realizar estudos quantitativos com pouco esforço:
eficiência em estereologia significa contar uma amostra
de cortes mínima (pouco trabalho), gastando pouco (para
preparar os cortes para análise), mas com boa acurácia.
Neste texto é feita uma revisão das principais ferramentas
estereológicas com a finalidade de fornecer uma base de
informação para cientistas não especializados no método.
Palavras-chave: morfometria, estereologia, densidade
de volume, densidade de superfície, densidade de
com-primento,disector,fractionator.
REFERENCES
Abercrombie M.1946. Estimation of nuclear population from microtomic sections. Anat Rec 94: 239-247.
Aguila MB and Mandarim-de-Lacerda CA.1999. Numerical density of cardiac myocytes in aged rats fed a cholesterol-rich diet and a canola oil diet (n-3 fatty acid rich). Virchows Arch 434: 451-453.
Aguila MB and Mandarim-de-Lacerda CA.2001. Blood pressure, ventricular volume and number of
cardiomyocyte nuclei in rats fed for 12 months on diets differing in fat composition. Mech Ageing Dev 122: 77-88.
Aherne WA.1967. Methods of counting discrete tissue components in microscopical sections. J R Microsc Soc 87: 493-501.
Aherne WA and Dunnill MS.1982. Morphometry. London: Edward Arnold, 205 p.
Almeida JR and Mandarim-de-Lacerda CA.2002. Quantitative study of the comma-shaped body, S-shaped body and vascularized glomerulus in the sec-ond and third human gestational trimesters. Early Hum Develop 69: 1-13.
Andersen BB and Pakkenberg B.2003. Stereolog-ical quantitation in cerebella from people with schizophrenia. Br J Psychiatry 182: 354-361.
Baddeley AJ.2001. Is stereology ‘unbiased’? Trends Neurosci 24: 375-376; author reply 378-380.
Baddeley AJ, Gundersen HJ and Cruz-Orive LM. 1986. Estimation of surface area from vertical sec-tions. J Microsc 142 (Pt 3): 259-276.
Bjarkam CR, Pedersen M and Sorensen JC.2001. New strategies for embedding, orientation and sec-tioning of small brain specimens enable direct corre-lation to MR-images, brain atlases, or use of unbiased stereology. J Neurosci Methods 108: 153-159.
Bolender RP.1981. Stereology: applications to phar-macology. Annu Rev Pharmacol Toxicol 21: 549-573.
Bolender RP. 1982. Stereology and its uses in cell biology. Ann N Y Acad Sci 383: 1-16.
Bolender RP. 1992. Biological stereology: history, present state, future directions. Microsc Res Tech 21: 255-261.
Buffon G-L.1777. Essai d’arithmétique morale. Sup-plement à l’historie naturelle. Paris: Imprimerie Royale, 321 p.
Burity CHF, Mandarim-de-Lacerda CA and Pissi-natti A. 1996. Stereology of the myocardium in two species ofCallithrix(Callitrichidae, primates). Anat Anz 178: 437-441.
Chalkley HW.1943. Methods for quantitative mor-phological analysis of tissue. J Natl Cancer Inst 4: 47-53.
Chalkley HW, Cornfield J and Park HC.1949. A method for estimating volume-surface ratios. Sci-ence 110: 295-301.
Charleston LB, Thyer AC, Klein NA, Soules MR and Charleston JS.2003. An improved method for the production of slides from oversized samples of glycol methacrylate-embedded tissues: Application for optical disector based stereology. J Histotechnol 26: 49-52.
Collan Y.1985. Stereology and morphometry in histo-pathology. Principles of application. Anal Quant Cytol Histol 7: 237-241.
Collan Y.1997. Stereology in diagnostic pathology. Pathologica 89: 462-466.
Costa WS, Mandarim-de-Lacerda CA and Bauer JA.1991. Stereological analysis of the otic ganglia in adult rat: light microscopic study. Anat Anz 172: 203-207.
Cruz-Orive LM and Gual-Arnau X.2002. Precision of circular systematic sampling. J Microsc 207: 225-242.
Cruz-Orive LM and Weibel ER.1990. Recent stereo-logical methods for cell biology: a brief survey. Am J Physiol 258: L148-156.
Davey MG, Hedrick HL, Bouchard S, Adzick NS, Flake AW and Doolin EJ. 2003. Computer-assisted stereology: Point fraction of lung paren-chyma and alveolar surface density in fetal and new-born sheep. Scanning 25: 37-44.
Delesse MA.1847. Procédé mécanique pour déterminer la composition des roches. C R Acad Sci Paris 25: 544-545.
Duffell SJ, Soames AR and Gunby S.2000. Morpho-metric analysis of the developing rat brain. Toxicol Pathol 28: 157-163.
Elias H and Hyde DM. 1983. A guide to practical stereology. New York: Karger, 305p.
Elias H, Hyde DM, Mullens RS and Lambert FC. 1981. Colonic adenomas: stereology and growth mechanisms. Dis Colon Rectum 24: 331-342.
Fiala JC and Harris KM.2001. Extending unbiased stereology of brain ultrastructure to three-dimen-sional volumes. J Am Med Inform Assoc 8: 1-16.
Gardella D, Hatton WJ, Rind HB, Glenn GD and Von Bartheld CS.2003. Differential tissue shrink-age and compression in the z-axis: implications for optical disector counting in vibratome-, plastic- and cryosections. J Neurosci Methods 124: 45-59.
Gundersen HJ.1977. Notes on the estimation of the nu-merical density of arbitrary profiles: the edge effect. J Microsc 111: 219-227.
Gundersen HJ.1988. The nucleator. J Microsc 151 (Pt 1): 3-21.
Gundersen HJ and Osterby R.1981. Optimizing sam-pling efficiency of stereological studies in biology: or ‘do more less well!’ J Microsc 121: 65-73.
Gundersen HJ, Andersen BS and Floe H.1983. Es-timation of section thickness unbiased by cutting-deformation. J Microsc 131 (Pt 1): RP3-4.
FB.1998. Angiogenesis in breast cancer: a com-parative study of the observer variability of methods for determining microvessel density. Lab Invest 78: 1563-1573.
Hedreen JC.1999. Unbiased stereology? Trends Neu-rosci 22: 346-347.
Hof PR, Bussiere T, Gold G, Kovari E, Giannakopou-los P, Bouras C, Perl DP and Morrison JH.2003. Stereologic evidence for persistence of viable neu-rons in layer II of the entorhinal cortex and the CA1 field in Alzheimer disease. J Neuropathol Exp Neurol 62: 55-67.
Howard CV and Reed MG.1998. Unbiased stereology: three-dimensional measurement in microscopy. New York Berlin Heidelberg: Springer-Verlag, 246 p.
Jensen EBV.1998. Local stereology. Singapore New Jersey London Hong Kong: World Scienctific, 247p.
Kubinova L and Janacek J.2001. Confocal microscopy and stereology: estimating volume, number, surface area and length by virtual test probes applied to three-dimensional images. Microsc Res Tech 53: 425-435.
Kubinova L, Janacek J, Ribaric S, Cebasek V and Erzen I.2001. Three-dimensional study of the cap-illary supply of skeletal muscle fibres using confocal microscopy. J Muscle Res Cell Motil 22: 217-227.
Ladekarl M.1998. Objective malignancy grading: a review emphasizing unbiased stereology applied to breast tumors. APMIS Suppl 79: 1-34.
Mandarim-de-Lacerda CA.1991a. Cardiac growth in staged human embryos-stages from 15 to 23, post-somitic period. Anat Anz 173: 60-64.
Mandarim-de-Lacerda CA.1991b. Growth allometry of the myocardium in human embryos (from stages 15 to 23). Acta Anat (Basel) 141: 251-256.
Anz 167: 57-61.
Mandarim-de-Lacerda CA and Pereira LM.2000. Numerical density of cardiomyocytes in chronic nitric oxide synthesis inhibition. Pathobiology 68: 36-42.
Mandarim-de-Lacerda CA and Pereira LM.2001. Renal cortical remodelling by NO-synthesis block-ers in rats is prevented by angiotensin-converting en-zyme inhibitor and calcium channel blocker. J Cell Mol Med 5: 276-283.
Mandarim-de-Lacerda CA, Le Floch-Prigent P and Hureau J.1985. Study of atrial conduction tissue in the 17 mm V-C human embryo. Morphological con-tribution to the pathogenesis of sinoauricular node dysfunction. Arch Mal Coeur Vaiss 78: 1504-1509.
Mandarim-de-Lacerda CA, Passos MA and Sampaio FJB.1987. Quantitative study of the heart in 2 human twin embryos at 14 mm C-R (stage 18). Acta Anat (Basel) 130: 224-227.
Mandarim-de-Lacerda CA, Santos MB and Pes-sanha MG. 1995. Quantitative study of the my-ocardium in human embryos. Anat Anz 177: 179-184.
Mattfeldt T, Mobius HJ and Mall G.1985. Orthog-onal triplet probes: an efficient method for unbiased estimation of length and surface of objects with un-known orientation in space. J Microsc 139 (Pt 3): 279-289.
Mattfeldt T, Mall G, Gharehbaghi H and Moller P.1990. Estimation of surface area and length with the orientator. J Microsc 159 (Pt 3): 301-317.
Mayhew TM and Gundersen HJ.1996. If you assume, you can make an ass out of u and me: a decade of the disector for stereological counting of particles in 3D space. J Anat 188 (Pt 1): 1-15.
Melo SR, Souza RR and Mandarim-de-Lacerda CA. 2002. Stereologic study of the sinoatrial node of rats – age related changes. Biogerontology 3: 383-390.
Michel RP and Cruz-Orive LM.1988. Application of the Cavalieri principle and vertical sections method to lung: estimation of volume and pleural surface area. J Microsc 150 (Pt 2): 117-136.
Mouton PR.2002. Principles and practices of unbiased stereology. An introduction for bioscientist. Balti-more: John Hopkins University Press, 214 p.
Mouton PR, Gokhale AM, Ward NL and West MJ. 2002. Stereological length estimation using spherical probes. J Microsc 206: 54-64.
Mussel RL, De Sa Silva E, Costa AM and Mandarim-de-Lacerda CA.2003. Mast cells in tissue response to dentistry materials: an adhesive resin, a calcium hydroxide and a glass ionomer cement. J Cell Mol Med 7: 171-178.
Nyengaard JR and Bendtsen TF.1992. Glomerular number and size in relation to age, kidney weight, and body surface in normal man. Anat Rec 232: 194-201.
Pakkenberg B and Gundersen HJ.1988. Total num-ber of neurons and glial cells in human brain nuclei estimated by the disector and the fractionator. J Mi-crosc 150 (Pt 1): 1-20.
Pakkenberg B, Pelvig D, Marner L, Bundgaard MJ, Gundersen HJ, Nyengaard JR and Regeur L. 2003. Aging and the human neocortex. Exp Gerontol 38: 95-99.
Pereira LM and Mandarim-de-Lacerda CA.2001a. The effect of enalapril and verapamil on the left ven-tricular hypertrophy and the left venven-tricular cardio-myocyte numerical density in rats submitted to nitric oxide inhibition. Int J Exp Pathol 82: 115-122.
Pereira LM and Mandarim-de-Lacerda CA.2001b. Glomerular profile numerical density per area and mean glomerular volume in rats submitted to nitric oxide synthase blockade. Histol Histopathol 16: 15-20.
Pereira LM and Mandarim-de-Lacerda CA.2002. Myocardial changes after spironolactone in sponta-neous hypertensive rats. A laser scanning confocal microscopy study. J Cell Mol Med 6: 49-57.
Pessanha MG and Mandarim-de-Lacerda CA.2000. Influence of the chronic nitric oxide synthesis inhibi-tion on cardiomyocytes number. Virchows Arch 437: 667-674.
Roberts N, Puddephat MJ and Mcnulty V.2000. The benefit of stereology for quantitative radiology. Br J Radiol 73: 679-697.
Russ JC and Dehoff RT.2000. Practical stereology. 2nd ed. New York: Kluwer Academic/Plenum Pub-lishers, 381 p.
Scherle W.1970. A simple method for volumetry of organs in quantitative stereology. Mikroskopie 26: 57-60.
Sterio DC.1984. The unbiased estimation of number and sizes of arbitrary particles using the disector. J Microsc 134 (Pt 2): 127-136.
Von Bartheld C.2002. Counting particles in tissue sections: choices of methods and importance of cal-ibration to minimize biases. Histol Histopathol 17: 639-648.
Weibel ER. 1979. Stereological Methods. Practical methods for biological morphometry. London: Aca-demic Press, 415 p.
Weibel ER.1989. Measuring through the microscope: development and evolution of stereological methods. J Microsc 155 (Pt 3): 393-403.
Weibel ER and Gomez DM. 1962. A principle for counting tissue structures on random sections. J Appl Physiol 17: 343-348.
Weibel ER, Kistler GS and Scherle WF.1966. Prac-tical stereological methods for morphometric cytol-ogy. J Cell Biol 30: 23-38.