HERITABILITY ESTIMATION IN EARLY GENERATIONS
OF TWO-WAY CROSSES IN SOYBEAN(
1)
MARCELO MARCHI COSTA (2*); ANTONIO ORLANDO DI MAURO (3); SANDRA HELENA UNÊDA-TREVISOLI (4); NAIR HELENA CASTRO ARRIEL (5); IVANA MARINO BÁRBARO (6);
GUSTAVO DIAS DA SILVEIRA (2); FRANCO ROMERO SILVA MUNIZ (2)
ABSTRACT
The estimation of genetic parameters, especially in early generations, is very useful for directing the selection process in breeding programs. The present research was undertaken to estimate heritabilities in the broad sense, narrow sense and using parent-offspring regression in F3 soybean populations from six two-way crosses, originated from the Soybean Breeding Program of Faculdade de Ciências Agrárias e Veterinárias (UNESP), Jaboticabal campus. It was used the family design with common checks located ten plots apart. It was observed highly significant differences among families. The experimental coefficient of variation (CVe), the CVg/CVe ratio and the heritability showed wide variation among traits, being the highest values found for number of pods, number of seeds and grain yield, making evident the existence of variance to be exploited by breeding. The estimation of the heritability coefficients in the broad sense, narrow sense and by regression were close in most of the situations, showing that the largest part of genetic variance is of additive nature, in which simple selection methods can lead to satisfactory genetic gains.
Key words:Glycine max, heritability coefficient, parent-offspring regression, quantitative traits.
RESUMO
ESTIMATIVAS DE HERDABILIDADE EM GERAÇÕES PRECOCES DE CRUZAMENTOS BIPARENTAIS DE SOJA
A estimativa de parâmetros genéticos, especialmente em gerações precoces, é muito útil para direcionar o processo de seleção em programas de melhoramento. Assim, este estudo objetivou estimar as herdabilidades nos sentidos amplo e restrito, bem como, pela regressão pai-filho em populações F3 de soja oriundas de seis cruzamentos biparentais pertencentes ao Programa de Melhoramento de Soja da Faculdade de Ciências Agrárias e Veterinárias (UNESP) – campus de Jaboticabal. O delineamento utilizado foi o de famílias com testemunhas intercaladas a cada dez parcelas. Foram observadas diferenças altamente significativas entre as famílias. O coeficiente de variação experimental (CVe), a relação CVg/CVe e a herdabilidade foram de ampla variação entre os caracteres avaliados, sendo os maiores valores obtidos para número de vagens, número de sementes e produtividade de grãos, evidenciando a existência de variabilidade a ser explorada pelo melhoramento. As estimativas dos coeficientes de herdabilidade no sentido amplo, restrito e pela regressão foram próximas, na maioria das situações, indicando ser a maior parte da variância genética de natureza aditiva cujos métodos simples de seleção podem levar a ganhos satisfatórios.
Palavras-chave:Glycine max, coeficiente de herdabilidade, regressão pai-filho, caracteres quantitativos.
(1) Receipt for publication in June, 2006 and accept in July 5, 2007.
(2) Doutorando do Programa de Pós-graduação em Agronomia (Genética e Melhoramento de Plantas), Faculdade de Ciências Agrárias e Veterinárias (UNESP), Jaboticabal (SP).E-mail: [email protected]. Bolsista FAPESP. (Autor correspondente); [email protected]; [email protected] (Bolsista CNPq).
(3) Departamento de Produção Vegetal, Faculdade de Ciências Agrárias e Veterinárias (UNESP), Via de Acesso Prof. Paulo Donato
Castellane, s/n, 14884-900 Jaboticabal (SP). E-mail: [email protected]
(4) APTA Regional Centro-Leste, Caixa Postal 271, 14001-970 Ribeirão Preto (SP). E-mail: [email protected]
1. INTRODUCTION
The main purpose of breeding programs is to identify superior genotypes in a numerous and heterogeneous population. Usually, the difficulties to obtain desirable genotypes are due to the large number of genotypes, difficulty of detecting the phenotypic differences for polygenic traits and the action of environmental factors in phenotype expression (MONTALVÁN and BARBIN, 1999).
According to CRUZ and CARNEIRO (2003), the
success of plant breeding for any trait requires, as a rule, that it be heritable and also the presence of variation in the population under selection. Therefore, heritability is a very important parameter for the breeder, allowing the estimation of the heritable portion of phenotypic variation, the estimation of genetic gain and the choice of selection methods to be applied (REIS et al., 2002).
Heritability can be estimated as a parent-offspring similarity measurement, and also as a broad and narrow sense genetic portion, considering that heritability does not characterize the trait, but the structure of the population under study (JACQUARD,
1983).
Many soybean researches have been done on broad and narrow sense heritability estimates (AZEVEDO FILHO et al., 1998; TOLEDO et al., 2000; FARIAS
NETO and VELLO, 2001; ROSSMAN, 2001; REIS et al., 2002),
though few of them have been done using parent-offspring regression, among which is an oat and a soybean study (CABRAL et al., 2001; MUNIZ et al., 2002).
The estimates of genetic parameters in early generations are very important to direct the breeding program in the process of selecting the most promising genotypes. Therefore, the present research was undertaken to estimate heritabilities in a broad and narrow sense and by parent-offspring regression, in F2 and F3 soybean populations from two-way crosses
for several traits.
2. MATERIAL AND METHODS
The present research was carried out at the experimental area of the Department of Crop Production, at the Faculdade de Ciências Agrárias e Veterinárias (UNESP), Jaboticabal Campus. Treatments consisted of 57 F2 and F3 families derived
from 6 two-way crosses (Table 1). The variable number of families per crossing is due to the selection of the best genotypes in the F2 generation, from which
families were opened in F3. Almost nine plants per
family were randomly selected and evaluated for the genetic parameters estimates.
The experiment was conducted using the family design with intercalated checks, with the control cultivars (Renascença and Liderança) located ten plots apart. The plots consisted of 5 meter lines, 0,5 m apart and with 20 plants per meter. The following traits were evaluated: number of days to maturity (NDM); plant height at maturity (PHM), in centimeters; first pod insertion height (FPI), in centimeters; lodging (L), grade scale varying from 1 (erect plant) to 5 (lodged plant); agronomic value (AV), grade scale varying from 1 (poor plant) to 5 (excellent plant); number of pods per plant (NP); number of seeds per plant (NS); grain yield per plant (GY), in gram.
Statistical Analysis
The trait variances for each control and for the segregating generation were analyzed according to the follo wing statistical model: , where Yij is an observation of the jth plant of the ith
family; µ is a general mean of the generation (control or family); fi is the genetic effect attributed to the ith
family, with i = 1,2...32; ei is the environmental effect
between rows (of the control or of families); pij is the
genetic effect ascribed to the jth plant of the ith family, with j = 1,2...293; δij is the environmental effect
between plants within rows (of the control or of families).
The statistical analyses were performed by using the Genes software (CRUZ, 2001). The original
data of L and AV and of NP and NS were transformed in √ x = 0.5 and, √x respectively, in order to adjust better the data to the normal distribution curve.
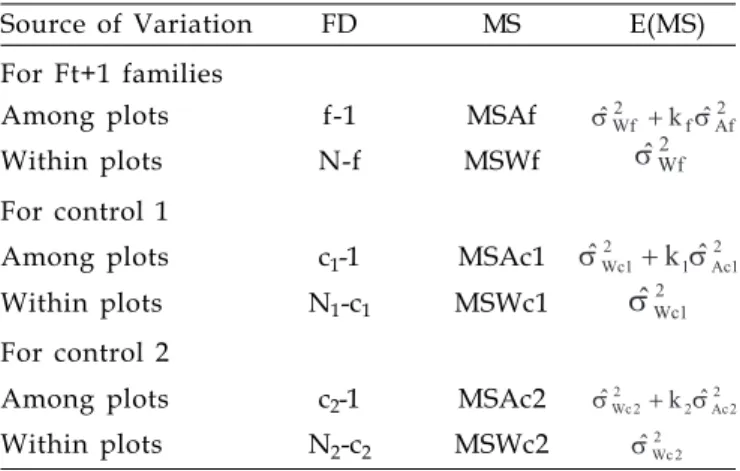
On table 2 a scheme of the variance analysis for the segregating generation (Ft+1 = F3) and for each control
is presented. In which: ; ;
; ; where:
kf, k1 e k2 are the weighted averages of the number of
plants per plot for families, control 1 and 2
Table 1. Genealogies, number of families (NF), and number of plants (NP) evaluated for six soybean crosses
Cross Genealogy NF NP
1 BRSMG Renascença x BR-16 10 96
2 MGBR 95-20937 x IAC Foscarin 31 6 60
3 MGBR 95-20937 x BR-16 15 127
Additive Genetic Variance and Variance due to the Dominance
Table 3 contains the total genotypic variance fractioning ( ) into additive variance ( ) and variance due to dominance deviations ( ), considering the endogamy coefficient in F3 generation
of ½ (CRUZ, 2001). This fractioning was possible
because self-fertilized families, derived from populations of a cross between two contrasting parents were used.
respectively; is the phenotypic variance among plants within families; is the genotypic variance among plants within families; is the environmental variance among plants within families; is the phenotypic variance among families; is the genotypic variance among families; and is the environmental variance among families.
The cultivars used as controls are completely homozygote genotypes, so they can be used to estimate the environmental variances, where: is the environmental variance among plants within control 1; is the environmental variance among plot of control 1; is the environmental variance among plants within control 2; and is the environmental variance among plots of control 2.
Variance Components Estimates
Using the data among and within plots related to controls and segregating lines, the following variance components were estimated:
Phenotypic Variance
Table 2. Scheme of variance analysis for each trait evaluated in F3 soybean families
Source of Variation FD MS E(MS)
For Ft+1 families
Among plots f-1 MSAf
Within plots N-f MSWf
For control 1
Among plots c1-1 MSAc1
Within plots N1-c1 MSWc1
For control 2
Among plots c2-1 MSAc2
Within plots N2-c2 MSWc2
f= number of segregating families in Ft+1, c1= number of control 1
replications, c2= number of control 2 replications, N= total number
of plants in the segregating generation Ft+1, N1 = total number of
plants for control 1 e N2= total number of plants for control 2.
Environmental Variance
Table 3. Total genotypic variance fractioning in the components due to additive variance ( ) and dominance deviations ( ).
Source of Variation Genotypic Variance Components Among families
Within families Total
With the available equations, was estimated:
;
Heritability Coefficient Estimates
Broad Sense Heritability
- Among families:
- Within families:
Narrow Sense Heritability
- Among families:
- Within families:
- Total:
Heritability based on parent-offspring regression
where b is the regression coefficient, with:,
where: refers to
the co-variance among Ft individuals values and the Ft+1 lines average ; is the Ft population average; is the Ft population variance; r is the Malecot endogamy coefficient.
3. RESULTS AND DISCUSSION
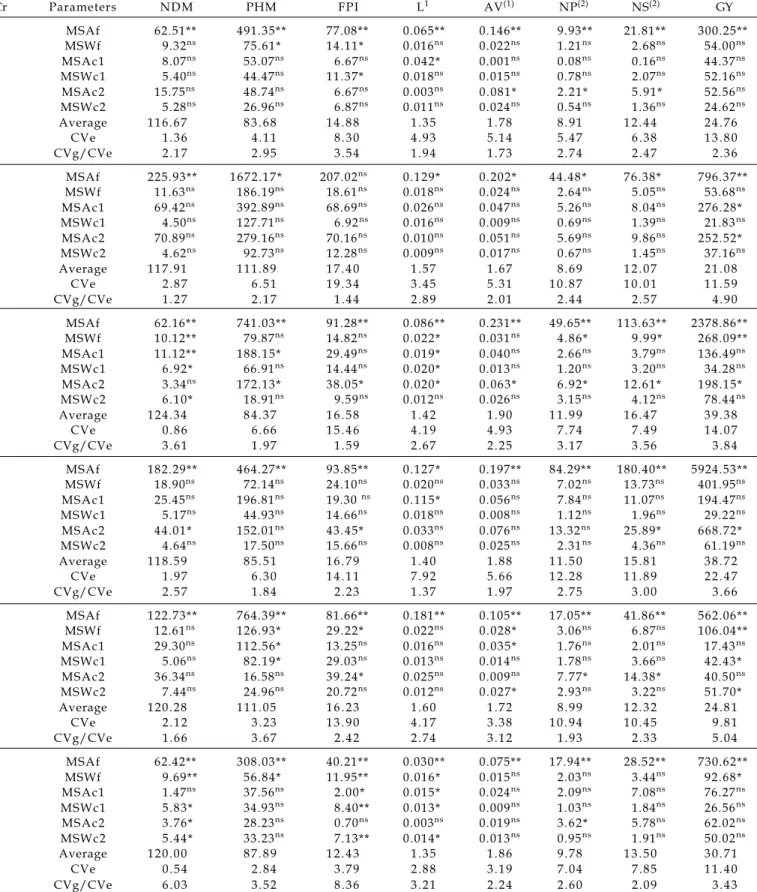
Table 4 shows a summary of the variance analysis involving 57 families from 6 crosses and intercalated checks (Renascença and Liderança) for the eight studied traits. Significant differences were noticed among the families for almost all traits in all 6 crosses, evidencing the large variability among progenies belonging to different families. Nevertheless, among progenies within the families and among and within the control’s plots, no significant differences were found for most of the traits in crosses.
The experimental variance coefficients (CVe %) ranged from 0.54% for NDM in cross 6 to 22.47% for GY in cross 4. The most expressive CVe values (%) were obtained for the FPI, NP, NS, GY traits, the last three being considered the primary production traits, controlled by a large number of genes and highly affected by the environment.
The observed CVe (%) values are very similar to those obtained by ROSSMANN (2001) for NDM and
PHM, by FARIAS NETO and VELLO (2001) for NDM and
GY, by UNÊDA-TREVISOLI (1999) for NDM and GY, by
AZEVEDO FILHO et al. (1998) for NDM, PHM and AV
and by MAURO et al. (1995) for PHM, FPI and NS.
Higher values were obtained by REIS et al. (2002) for
NDM, PHM, NP, NS and GY, by ROSSMANN (2001) for
L and GY, by FARIAS NETO and VELLO (2001) for PHM,
L and AV, by UNÊDA-TREVISOLI (1999) for PHM, L and
AV, by AZEVEDO FILHO et al. (1998) for GY and by
MAURO et al. (1995) for NP and GY.
The CVg/CVe ratio was very high, ranging from 1.27 for NDM in cross 2 to 8.36 for FPI in cross 6. In general, the highest values were found for the primary traits (NP, NS and GY) contrasting with what was observed by REIS et al. (2002), where the secondary
characters (NDM, PHM and FPI) were higher.
The high CVg/CVe values observed for NP, NS and GY reflect a very favorable situation for the selection aiming these traits, with possibilities of gains using simple selection methods, as observed by CRUZ and REGAZZI (1997).
Table 5 presents the broad sense heritability coefficients estimates among and within the families,
narrow sense among families, within families and total and based on parent-offspring regression. The total narrow sense heritability is based on an individual, being its family information despised.
In general, the highest heritability coefficients were obtained for the primary production traits (NP, NS and GY), in most crosses (Table 5). These values are due to the high genotypic variance of these traits, because of the striking superiority of some individuals and some families compared to the population average. This can be confirmed by the superiority of these same traits compared to the genetic variance coefficient (Table 4).
Individually, it can be observed in cross 4, that some values overcame the unity for NP, NS and GY, what according to REIS et al. (2002), is a sign of an
overestimated additive genetic variance or an underestimated environmental variance, which may characterize an inadequacy of the estimation methods for these variances. This fact may have been caused by the low number of representatives for some families, which had their development benefited by the low stand in the line corresponding to its family.
All six heritability coefficients showed high variation. Broad sense heritability among families ranged from 0.34 (L in cross 1) to 0.95 (FPI in cross 6). Similar estimates were found by REIS et al. (2002), for the NDM,
PHM, NP, NS and GY. MAURO et al. (1995) also obtained
similar results for PHM and FPI, but lower for NP, NS and GY, using the same plot type. Broad sense heritability within families, which ranged from 0.11 (L in cross 1) to 0.89 (GY in cross 4) was also similar to the results obtained by REIS et al (2002) for NDM and PHM, though
it was overcome by those obtained for NP, NS and GY.
Narrow sense heritability among families ranged from 0.27 (L in cross 1) to 1.00 (GY in cross 4), presenting similarities to what was found by REIS et al. (2002) for
NDM, NP, NS and GY. Lower estimates were found for PHM. ROSSMANN (2001) obtained similar amplitude levels
to that of NDM and GY, with slightly superior results for PHM and L. Narrow sense heritability within families presented a higher variance, from 0.06 (L in cross 1 and FPI in cross 5) to 1.25 (GY in cross 4), with results higher than those found by REIS et al. (2002) for NDM
and PHM and slightly lower for NP, NS and GY. Total narrow sense heritability ranged from 0.12 (L in cross 1) to 1.07 (GY in cross 4), presenting results lower than those obtained by REIS et al. (2002) for NDM and PHM
and similar for NP, NS and GY.
The estimated heritability by the parent-offspring regression situated between 0.14 (PHM in cross 1) and 1.33 (NS in cross 4), presented amplitude levels similar to those obtained by MUNIZ et al. (2002)
for PHM and FPI and higher for NS and GY. FARIAS
NETO and VELLO (2001) obtained similar results for
Table 4. Variance analysis for number of days to maturity (NDM), plant height at maturity (PHM), first pod insertion height (FPI), lodging (L), agronomic value (AV), number of pods (NP), number of seeds (NS) and grain yield (GY) traits
Cr Parameters NDM PHM FPI L1 AV(1) NP(2) NS(2) GY
1 MSAf 62.51** 491.35** 77.08** 0.065** 0.146** 9.93** 21.81** 300.25**
MSWf 9.32ns 75.61* 14.11* 0.016ns 0.022ns 1.21ns 2.68ns 54.00ns
MSAc1 8.07ns 53.07ns 6.67ns 0.042* 0.001ns 0.08ns 0.16ns 44.37ns
MSWc1 5.40ns 44.47ns 11.37* 0.018ns 0.015ns 0.78ns 2.07ns 52.16ns
MSAc2 15.75ns 48.74ns 6.67ns 0.003ns 0.081* 2.21* 5.91* 52.56ns
MSWc2 5.28ns 26.96ns 6.87ns 0.011ns 0.024ns 0.54ns 1.36ns 24.62ns
Average 1 1 6 . 6 7 8 3 . 6 8 1 4 . 8 8 1 . 3 5 1 . 7 8 8 . 9 1 1 2 . 4 4 2 4 . 7 6
CVe 1 . 3 6 4 . 1 1 8 . 3 0 4 . 9 3 5 . 1 4 5 . 4 7 6 . 3 8 1 3 . 8 0
CVg/CVe 2 . 1 7 2 . 9 5 3 . 5 4 1 . 9 4 1 . 7 3 2 . 7 4 2 . 4 7 2 . 3 6
2 MSAf 225.93** 1672.17* 207.02ns 0.129* 0.202* 44.48* 76.38* 796.37**
MSWf 11.63ns 186.19ns 18.61ns 0.018ns 0.024ns 2.64ns 5.05ns 53.68ns
MSAc1 69.42ns 392.89ns 68.69ns 0.026ns 0.047ns 5.26ns 8.04ns 276.28*
MSWc1 4.50ns 127.71ns 6.92ns 0.016ns 0.009ns 0.69ns 1.39ns 21.83ns
MSAc2 70.89ns 279.16ns 70.16ns 0.010ns 0.051ns 5.69ns 9.86ns 252.52*
MSWc2 4.62ns 92.73ns 12.28ns 0.009ns 0.017ns 0.67ns 1.45ns 37.16ns
Average 1 1 7 . 9 1 1 1 1 . 8 9 1 7 . 4 0 1 . 5 7 1 . 6 7 8 . 6 9 1 2 . 0 7 2 1 . 0 8
CVe 2 . 8 7 6 . 5 1 1 9 . 3 4 3 . 4 5 5 . 3 1 1 0 . 8 7 1 0 . 0 1 1 1 . 5 9
CVg/CVe 1 . 2 7 2 . 1 7 1 . 4 4 2 . 8 9 2 . 0 1 2 . 4 4 2 . 5 7 4 . 9 0
3 MSAf 62.16** 741.03** 91.28** 0.086** 0.231** 49.65** 113.63** 2378.86**
MSWf 10.12** 79.87ns 14.82ns 0.022* 0.031ns 4.86* 9.99* 268.09**
MSAc1 11.12** 188.15* 29.49ns 0.019* 0.040ns 2.66ns 3.79ns 136.49ns
MSWc1 6.92* 66.91ns 14.44ns 0.020* 0.013ns 1.20ns 3.20ns 34.28ns
MSAc2 3.34ns 172.13* 38.05* 0.020* 0.063* 6.92* 12.61* 198.15*
MSWc2 6.10* 18.91ns 9.59ns 0.012ns 0.026ns 3.15ns 4.12ns 78.44ns
Average 1 2 4 . 3 4 8 4 . 3 7 1 6 . 5 8 1 . 4 2 1 . 9 0 1 1 . 9 9 1 6 . 4 7 3 9 . 3 8
CVe 0 . 8 6 6 . 6 6 1 5 . 4 6 4 . 1 9 4 . 9 3 7 . 7 4 7 . 4 9 1 4 . 0 7
CVg/CVe 3 . 6 1 1 . 9 7 1 . 5 9 2 . 6 7 2 . 2 5 3 . 1 7 3 . 5 6 3 . 8 4
4 MSAf 182.29** 464.27** 93.85** 0.127* 0.197** 84.29** 180.40** 5924.53**
MSWf 18.90ns 72.14ns 24.10ns 0.020ns 0.033ns 7.02ns 13.73ns 401.95ns
MSAc1 25.45ns 196.81ns 19.30 ns 0.115* 0.056ns 7.84ns 11.07ns 194.47ns
MSWc1 5.17ns 44.93ns 14.66ns 0.018ns 0.008ns 1.12ns 1.96ns 29.22ns
MSAc2 44.01* 152.01ns 43.45* 0.033ns 0.076ns 13.32ns 25.89* 668.72*
MSWc2 4.64ns 17.50ns 15.66ns 0.008ns 0.025ns 2.31ns 4.36ns 61.19ns
Average 1 1 8 . 5 9 8 5 . 5 1 1 6 . 7 9 1 . 4 0 1 . 8 8 1 1 . 5 0 1 5 . 8 1 3 8 . 7 2
CVe 1 . 9 7 6 . 3 0 1 4 . 1 1 7 . 9 2 5 . 6 6 1 2 . 2 8 1 1 . 8 9 2 2 . 4 7
CVg/CVe 2 . 5 7 1 . 8 4 2 . 2 3 1 . 3 7 1 . 9 7 2 . 7 5 3 . 0 0 3 . 6 6
5 MSAf 122.73** 764.39** 81.66** 0.181** 0.105** 17.05** 41.86** 562.06**
MSWf 12.61ns 126.93* 29.22* 0.022ns 0.028* 3.06ns 6.87ns 106.04**
MSAc1 29.30ns 112.56* 13.25ns 0.016ns 0.035* 1.76ns 2.01ns 17.43ns
MSWc1 5.06ns 82.19* 29.03ns 0.013ns 0.014ns 1.78ns 3.66ns 42.43*
MSAc2 36.34ns 16.58ns 39.24* 0.025ns 0.009ns 7.77* 14.38* 40.50ns
MSWc2 7.44ns 24.96ns 20.72ns 0.012ns 0.027* 2.93ns 3.22ns 51.70*
Average 1 2 0 . 2 8 1 1 1 . 0 5 1 6 . 2 3 1 . 6 0 1 . 7 2 8 . 9 9 1 2 . 3 2 2 4 . 8 1
CVe 2 . 1 2 3 . 2 3 1 3 . 9 0 4 . 1 7 3 . 3 8 1 0 . 9 4 1 0 . 4 5 9 . 8 1
CVg/CVe 1 . 6 6 3 . 6 7 2 . 4 2 2 . 7 4 3 . 1 2 1 . 9 3 2 . 3 3 5 . 0 4
6 MSAf 62.42** 308.03** 40.21** 0.030** 0.075** 17.94** 28.52** 730.62**
MSWf 9.69** 56.84* 11.95** 0.016* 0.015ns 2.03ns 3.44ns 92.68*
MSAc1 1.47ns 37.56ns 2.00* 0.015* 0.024ns 2.09ns 7.08ns 76.27ns
MSWc1 5.83* 34.93ns 8.40** 0.013* 0.009ns 1.03ns 1.84ns 26.56ns
MSAc2 3.76* 28.23ns 0.70ns 0.003ns 0.019ns 3.62* 5.78ns 62.02ns
MSWc2 5.44* 33.23ns 7.13** 0.014* 0.013ns 0.95ns 1.91ns 50.02ns
Average 1 2 0 . 0 0 8 7 . 8 9 1 2 . 4 3 1 . 3 5 1 . 8 6 9 . 7 8 1 3 . 5 0 3 0 . 7 1
CVe 0 . 5 4 2 . 8 4 3 . 7 9 2 . 8 8 3 . 1 9 7 . 0 4 7 . 8 5 1 1 . 4 0
CVg/CVe 6 . 0 3 3 . 5 2 8 . 3 6 3 . 2 1 2 . 2 4 2 . 6 0 2 . 0 9 3 . 4 3
Table 5. Broad sense heritability coefficients estimates among families (h2
Ba) and within families (h2Bw), narrow sense estimates among families (h2
Na), within families (h2Nw) and total (h2Ntotal) and based on parent-offspring regression estimates (h2
reg), for the eight traits in all six soybean crosses and for the crosses average
Cross Herit. *NDM PHM FPI L1 A V1 NP2 NS2 GY
1 h2
Ba 0 . 6 0 0 . 7 9 0 . 8 2 0 . 3 4 0 . 3 7 0 . 7 4 0 . 6 9 0 . 6 6
h2
Bw 0 . 4 3 0 . 5 2 0 . 3 4 0 . 1 1 0 . 1 4 0 . 4 5 0 . 3 5 0 . 2 7
h2Na 0 . 3 9 0 . 5 5 0 . 7 0 0 . 2 7 0 . 3 6 0 . 6 5 0 . 6 5 0 . 5 8
h2
Nw 0 . 1 3 0 . 1 9 0 . 2 0 0 . 0 6 0 . 1 3 0 . 2 8 0 . 2 8 0 . 1 7
h2
Ntotal 0 . 2 4 0 . 3 3 0 . 3 9 0 . 1 2 0 . 2 3 0 . 4 5 0 . 4 5 0 . 3 2
h2reg 0 . 3 2 0 . 1 4 0 . 8 2 0 . 4 9 0 . 5 3 0 . 4 3 0 . 5 0 0 . 5 3
2 h2
Ba 0 . 5 2 0 . 6 9 0 . 4 8 0 . 7 8 0 . 6 3 0 . 8 1 0 . 8 2 0 . 4 9
h2Bw 0 . 6 1 0 . 4 1 0 . 4 8 0 . 3 2 0 . 4 8 0 . 7 4 0 . 7 2 0 . 4 5
h2
Na 0 . 5 0 0 . 6 3 0 . 3 7 0 . 7 6 0 . 4 7 0 . 8 0 0 . 7 9 0 . 4 6
h2
Nw 0 . 5 1 0 . 3 0 0 . 2 2 0 . 2 8 0 . 2 0 0 . 7 2 0 . 6 3 0 . 3 6
h2
Ntotal 0 . 5 0 0 . 4 6 0 . 3 0 0 . 4 9 0 . 3 3 0 . 7 7 0 . 7 3 0 . 4 2 h2
reg 0 . 8 1 0 . 7 6 0 . 3 9 0 . 3 0 0 . 4 0 0 . 8 2 0 . 6 5 0 . 4 1
3 h2
Ba 0 . 8 3 0 . 6 4 0 . 4 5 0 . 6 6 0 . 6 7 0 . 8 6 0 . 8 9 0 . 9 0
h2
Bw 0 . 3 6 0 . 4 6 0 . 1 9 0 . 2 5 0 . 4 0 0 . 5 5 0 . 6 3 0 . 7 9
h2
Na 0 . 7 8 0 . 5 8 0 . 4 3 0 . 5 2 0 . 5 9 0 . 8 4 0 . 8 8 0 . 7 0
h2Nw 0 . 2 9 0 . 3 2 0 . 1 6 0 . 1 2 0 . 2 6 0 . 5 2 0 . 6 0 0 . 3 7
h2
Ntotal 0 . 5 4 0 . 4 6 0 . 2 8 0 . 2 5 0 . 4 1 0 . 7 0 0 . 7 6 0 . 5 4 h2
reg 0 . 7 2 0 . 6 8 0 . 4 1 0 . 5 5 0 . 5 9 0 . 8 1 0 . 9 1 0 . 8 8
4 h2
Ba 0 . 8 1 0 . 6 2 0 . 6 6 0 . 4 1 0 . 6 6 0 . 8 7 0 . 9 0 0 . 9 3
h2
Bw 0 . 7 4 0 . 5 7 0 . 3 7 0 . 3 6 0 . 5 1 0 . 7 6 0 . 7 7 0 . 8 9
h2Na 0 . 7 7 0 . 4 8 0 . 5 1 0 . 3 2 0 . 5 5 0 . 9 2 0 . 9 6 1 . 0 0
h2
Nw 0 . 6 3 0 . 2 6 0 . 1 7 0 . 1 7 0 . 2 7 0 . 9 3 1 . 0 7 1 . 2 5
h2
Ntotal 0 . 7 2 0 . 3 8 0 . 3 0 0 . 2 4 0 . 4 1 0 . 9 2 1 . 0 0 1 . 0 7 h2
reg 0 . 4 0 0 . 6 8 0 . 5 0 0 . 8 5 0 . 5 6 1 . 2 7 1 . 3 3 1 . 2 3
5 h2
Ba 0 . 5 6 0 . 8 8 0 . 4 3 0 . 8 1 0 . 6 9 0 . 5 0 0 . 6 4 0 . 9 1
h2
Bw 0 . 5 2 0 . 5 3 0 . 1 2 0 . 4 3 0 . 3 0 0 . 2 7 0 . 4 9 0 . 5 6
h2
Na 0 . 4 5 0 . 7 0 0 . 3 5 0 . 8 0 0 . 5 0 0 . 4 1 0 . 4 2 0 . 6 4
h2
Nw 0 . 2 8 0 . 2 6 0 . 0 6 0 . 4 2 0 . 1 2 0 . 1 4 0 . 1 6 0 . 2 1
h2
Ntotal 0 . 3 7 0 . 4 5 0 . 1 4 0 . 6 1 0 . 2 4 0 . 2 5 0 . 2 7 0 . 3 8 h2
reg 0 . 9 4 0 . 5 1 0 . 3 2 0 . 6 7 0 . 3 8 0 . 5 5 0 . 4 1 0 . 5 6
6 h2
Ba 0 . 9 4 0 . 8 5 0 . 9 5 0 . 5 8 0 . 5 8 0 . 7 7 0 . 6 8 0 . 8 7
h2Bw 0 . 4 2 0 . 4 0 0 . 3 5 0 . 1 2 0 . 2 7 0 . 5 1 0 . 4 6 0 . 5 9
h2
Na 0 . 8 9 0 . 7 2 0 . 6 9 0 . 4 3 0 . 4 7 0 . 7 1 0 . 6 0 0 . 7 4
h2
Nw 0 . 3 5 0 . 2 3 0 . 1 4 0 . 5 0 0 . 1 4 0 . 3 8 0 . 3 0 0 . 3 5
h2
Ntotal 0 . 5 8 0 . 4 3 0 . 3 0 0 . 1 2 0 . 2 7 0 . 5 5 0 . 4 5 0 . 5 4 h2
reg 0 . 7 5 0 . 7 9 0 . 6 6 0 . 4 2 0 . 7 3 0 . 9 2 0 . 8 6 0 . 9 3
Average h2Ba 0 . 7 1 0 . 7 5 0 . 6 3 0 . 6 0 0 . 6 0 0 . 7 6 0 . 7 7 0 . 7 9
h2
Bw 0 . 5 1 0 . 4 8 0 . 3 1 0 . 2 7 0 . 3 5 0 . 5 5 0 . 5 7 0 . 5 9
h2
Na 0 . 6 3 0 . 6 1 0 . 5 1 0 . 5 2 0 . 4 9 0 . 7 2 0 . 7 2 0 . 6 9
h2
Nw 0 . 3 7 0 . 2 6 0 . 1 6 0 . 2 6 0 . 1 9 0 . 5 0 0 . 5 1 0 . 4 5
h2
Ntotal 0 . 4 9 0 . 4 2 0 . 2 9 0 . 3 1 0 . 3 2 0 . 6 1 0 . 6 1 0 . 5 5 h2
reg 0 . 6 6 0 . 5 9 0 . 5 2 0 . 5 5 0 . 5 3 0 . 8 0 0 . 7 8 0 . 7 6
* NDM = number of days to maturity; PHM = plant height at maturity; FPI = first pod insertion height; L = lodging; AV = agronomic value; NP = number of pods; NS = number of seeds; GY = grain yield . (1) = data transformed into (2) = data transformed into .
It can also be noticed, on Table 5, the heritability averages of the six crosses, for all estimates and traits. In a general view, the cross 1 presented lower estimates than the average for almost all situations, traits and heritability estimation ways, except for the FPI trait. For the cross 2, most of the estimates were higher than the average, with exception to GY trait where all the heritability
The results showed that the broad and narrow sense heritability coefficients, frequently were closer, indicating that most of the genetic variance is probably due to additive nature. This fact is reinforced by the high CVg/CVe ratio obtained, with values distinctly higher than the unit, showing that quite simple selection methods can lead to satisfactory gains, especially for the primary traits (NP, NS and GY), which are more economically important, even in early generations.
The heritability estimates calculated by parent-offspring regression were similar to the narrow sense heritability, presenting the same overestimates in cross 4 for NP, NS and GY, with values higher than the unit. It is important to reinforce though, that BORÉM
(1997) considers that the estimates obtained by the parent-offspring regression, especially in F2 and F3 generations, are of broad nature, due to the fact that parent-offspring covariance includes components of additive, dominance and epistatic variance. However, since most of the genetic variance in the present experiment was of additive nature, with minimized dominance and epistatic effects, it was noticed that the three heritability coefficients (broad, narrow and regression) presented close values, for most of the situations, especially in the estimates obtained among families.
The high heritability coefficients observed specifically for the NP, NS and GY indicate that there might be success in early generation selection, even in F3 generation, by directing the selection process for
the most promising genotypes. The heritability estimates for the GY, mainly in crosses 4, 3 and 6, presented higher possibilities of gain, considering the broad and narrow sense coefficients as the parent-offspring regression. The least promising crosses, considering all three estimate methods, were the crosses 1 and 2.
Considering that the heritability coefficient defines the selection differential proportion that will be transmitted to the following generation, it can be deduced that selection among families will be more promising than selection within families. Furthermore, the traits and crosses that presented the best heritability coefficients estimates also presented higher gain possibilities through simple selection methods, even in early generations.
4. CONCLUSIONS
1. The heritability estimate in the broad sense, narrow sense and by regression were close in the experiment conditions, evidencing that additive nature represents the highest part of genetic variance.
2. Selection among families showed to be most promising than selection within families.
ACKNOWLEDGEMENTS
To CAPES and FAPESP for the awarded scholarships and financial aid to the research. To the technicians Geraldo Mangela de Assis and Amanda Roberta Corrado for the assistance in conducting the experiments.
REFERENCES
AZEVEDO FILHO, J.A.; VELLO, N.A.; GOMES, R.L.F. Estimativas de parâmetros genéticos de populações de soja em solos contrastantes na saturação de alumínio. Bragantia, Campinas, v.57, n.2, p.227-239, 1998.
BORÉM, A.; MIRANDA, G.V. Melhoramento de plantas. 4 ed. Viçosa: Editora UFV, Imprensa Universitária, 2005. 525p. CABRAL, C.B.; MILACH, S.C.K.; PACHECO, M.T.; CRANCIO, L.A. Herança de caracteres morfológicos de grãos primários em aveia. Pesquisa Agropecuária Brasileira, Brasília, v.36, n.9, p.1133-1143, 2001.
CRUZ, C.D. Programa Genes: versão Windows; aplicativo computacional em genética e estatística. Viçosa: Editora UFV, Imprensa Universitária, 2001. 648p.
CRUZ, C.D.; CARNEIRO, P.C.S. Modelos biométricos aplicados ao melhoramento genético. v.2. Viçosa: Editora UFV, Imprensa Universitária, 2003. 585p.
CRUZ, C.D.; REGAZZI, A.J. Modelos biométricos aplicados ao melhoramento genético. Viçosa: Editora UFV, Imprensa Universitária, 1997. 390p.
FARIAS NETO, J.T.; VELLO, N.A. Avaliação de progênies F4:3
e F5:3 e estimativas de parâmetros genéticos com ênfase para porcentagem de óleo, produtividade de grãos e óleo em soja.
Ciência e Agrotecnologia, Lavras, v.25, n.4, p.812-820, 2001. JACQUARD, A. Heritability: one word, three concepts.
Biometrics, Arlington, v.39, n.2, p.465-477, 1983.
MAURO, A.O.; SEDYIAMA, T.; SEDYIAMA, C.S. Estimativas de Parâmetros genéticos em diferentes tipos de parcelas experimentais em soja. Pesquisa Agropecuária Brasileira, Brasília, v.30, n.5, p.667-672, 1995.
MONTALVÁN, R.; BARBIN, D. Estatística e melhoramento genético de plantas. In: DESTRO, D.; MONTALVÁN, R.
Melhoramento genético de plantas. Londrina: Editora UEL, 1999. p.85-102.
REIS, E.F.; REIS, M.S.; SEDYAMA, T.; CRUZ, C.D. Estimativa de variâncias e herdabilidades de algumas características primárias e secundárias da produção de grãos em soja (Glycine max (L.) Merrill).
Ciência e Agrotecnologia, Lavras, v.26, n.4, p.749-761, 2002. ROSSMANN, H. Estimativas de parâmetros genéticos e fenotípicos de uma população de soja avaliada em quatro anos. 2001. 80p. Dissertação (Mestrado em Agronomia) -ESALQ/USP, Piracicaba.
TOLEDO, J.F.F.; ARIAS, C.A.A.; OLIVEIRA, M.F.; TRILLER, C.; MIRANDA, Z.F.S. Genetical and environmental analyses of yield in six two-way soybean crosses. Pesquisa Agropecuária Brasileira, Brasília, v.35, n.9, p.1783-1796, 2000.