http://periodicos.uem.br/ojs/acta ISSN on-line: 1807-8672
Doi: 10.4025/actascianimsci.v40i1.36481 ANIMAL BREEDING AND REPRODUCTION
Genetic components of birth weight of texel sheep reared in
extensive system
Fernando Amarilho-Silveira*, Nelson José Laurino Dionello, Gilson de Mendonça, Jaqueline Freitas Motta, Tiago Albandes Fernandes and Nicholas da Silveira Silva
Universidade Federal de Pelotas, Campus Universitário Capão do Leão, s/n, 96160-000, Capão do Leão, Rio Grande do Sul, Brazil. *Author for correspondence. E-mail: [email protected]
ABSTRACT. This study aimed to estimate the components of (co)variance, genetic and phenotypic parameters and trends for birth weight. We used 783 birth weight records, between 2012 to 2016, of Texel sheep reared in extensive system. The components of (co)variance and the genetic parameters were estimated using six different animal models, using the restricted maximum likelihood method (REML). The model that best fit the data was Model 3, with estimates of direct additive genetic variance of 0.004, maternal permanent environment variance of 0.164, heritability coefficient of 0.011 and phenotypic variation attributed to the maternal permanent environment of 0.394. For the genetic trend, we observed a genetic gain of 0.413% and for the phenotypic trend, a phenotypic gain of 0.159 kg, between 2012 and 2016 were found. Estimates of direct heritability and proportion of the phenotypic variance explained by the maternal permanent environment presented lower and higher values, respectively, in comparison to other studies. For trends, both genetic and phenotypic, there were gains in birth weight between 2012 and 2016. Keywords: maternal permanent environment, heritability, sheep breeding, direct additive variance.
Componentes genéticos do peso de ovinos texel, ao nascimento, criados em sistema
extensivo
RESUMO. Este trabalho foi realizado para estimar os componentes de (co)variância, parâmetros e tendências genéticas e fenotípicas do peso de ovinos da raça Texel, ao nascimento. Foram utilizados 783 registros de peso ao nascimento, entre os anos de 2012 a 2016, de ovinos criados em sistema extensivo. Foram estimados os componentes de (co)variância e os parâmetros genéticos com seis diferentes modelos animais, utilizando o método da máxima verossimilhança restrita (REML - Restricted Maximum Likelihood). O modelo que melhor se ajustou aos dados foi o modelo 3, com estimativas de variância genética aditiva direta de 0,004, variância do ambiente permanente materno de 0,164, coeficiente de herdabilidade de 0,011 e variação fenotípica atribuída ao ambiente permanente materno de 0,394. Foram constatados para a tendência genética um ganho genético de 0,413% e um ganho fenotípico de 0,159 kg para a tendência fenotípica, entre os anos de 2012 a 2016. As estimativas de herdabilidade direta e da proporção da variância fenotípica explicada pelo ambiente permanente materno apresentaram valores inferiores e superiores, respectivamente, em comparação a outros estudos. Para as tendências, tanto genética, como fenotípica, houve ganho no peso ao nascimento, entre os anos de 2012 a 2016.
Palavras-chave: ambiente permanente materno, herdabilidade, melhoramento genético ovino, variância aditiva direta.
Introduction
Selection based on objective indices is one of the most important strategies to maximize animal production. However, the lack of information on the genetic parameters needed to predict genetic gains is commonly cited as a barrier to proper mating planning. Thus, such estimates are required to determine the selection method to be used, estimating the maximum genetic gain that can be achieved (Lôbo, Lôbo, Paiva, Oliveira, & Facó, 2009). However, in Rio Grande do Sul there is little zootechnical accounting, limiting precise estimates
of the genetic parameters for the traits of productive importance.
related to the survival of newborns, once, according to Banchero, Ganzábal, Montossi, Barbieri and Quintans (2012), lambs that are born heavier have increased chances of survival, when compared to light lambs. Sawalha, Conington, Brotherstone and Villanueva (2007) describe that there is a well-established nonlinear relationship between lamb survival and birth weight, that is, both very light and very heavy lambs are at risk of dying before weaning; While lambs with an intermediate weight will have a better chance of survival. Small lambs are prone to succumb to hypothermia and starvation, while heavy lambs are at greater risk of dying because of dystocia. In agreement with Lavvaf and Noshary (2008), this trait, in addition to being related to survival, is the first about the growth of the individual, being its phenotypic expression in the progeny, influenced by the capacity of intrauterine nutrition. Thus, the dam contributes to progeny performance in two ways: 1) by its direct genetic effects passed to the progeny and 2) by its ability to provide an appropriate uterine environment.
Birth weight has a high correlation with other weight-related characteristics, so that lambs with higher birth weights would also have higher weights in the subsequent stages of growth compared to lambs with lower birth weight.
Many random factors affect lamb growth, i.e., besides the direct additive effect, maternal additive and maternal permanent environment effects should be considered, not only environmental factors such as year and month of birth, sex, type of birth and age of the dam at calving (Bahreini Behzadi, Shahroudi, & Van Vleck, 2007).
In this sense, this study was carried out to estimate the components of (co)variance, genetic and phenotypic parameters and trends for the birth weight trait of Texel sheep, reared in extensive system, using the animal model, which best fit the data.
Material and methods
There were available a total of 783 birth weight records (weight taken up to 12 hours post-birth) from 2012 to 2016, of Texel sheep reared in extensive system, in a private property located in the municipality of Bagé, State of Rio Grande do Sul, Brazil, at coordinates 31°08’38.91”S and 54°01’53.92”W. The pedigree file was composed of 21 rams and 255 dams, totaling 994 animals.
With respect to the ethical aspects in animal experimentation, this study does not have any implications for the assessment from the ethics committee of the institution (Ethics Committee on
Animal Experimentation), since the data processed were provided by the owners, who take such records, on a routine basis.
The influence of environmental effects on birth weight, such as the age of the dam at calving, year of birth, month of birth, sex, type of delivery and their interactions were tested. Multivariate analysis of variance was used for the statistical package R (R Core Team, 2016). Thus, multivariate analysis of variance showed significant effects of maternal age, year of birth, sex and type of birth, and also the interactions between year: month of birth (Year: Month), age of the dam at calving: month of birth (Id: Month), year of birth: sex (Year: Sex), and year of birth: type of birth (Year: TP). Therefore, as fixed effects only interactions were considered.
Year: Month, Id: Month, Year: Sex and Year: TP, with less than 5 birth weight records, consequently, were disregarded resulting in the exclusion of 41 records.
The components of (co)variance and genetic parameters, for the trait in question, were estimated using six different animal models, shown in Figure 1.
Figure 1. Animal models for estimation of (co)variance components and genetic parameters, for the birth weight of Texel sheep, reared in extensive system.
As shown in Figure 1, y is the vector of observations in animal i, as the sum of environmental effects b (fixed effects), direct additive genetic variance a, maternal additive genetic variance m, maternal permanent environment c, unknown or residual factors or error e. The letters
X, Z, M and W are the incidence matrices for the fixed, direct, maternal and maternal permanent environmental effects, respectively.
The analyses to estimate the (co)variance components and the genetic parameters were performed using the restricted maximum likelihood method (REML) under animal model, considering the birth weight, using the WOMBAT software (Meyer, 2012).
parameters (alternative model) was compared with the model with the lowest number of parameters (null model). The LRT assumes a chi-square distribution and its degrees of freedom are calculated by the difference in the number of parameters between the alternative model and the null model. The statistical significance for the models was established at the probability level of 5%, or p ≤ 0.05. The LRT (Hogg & Craig, 1995) was obtained by the formula: LRT = - 2x (Ls-Lc). Where Ls is the logarithm of the maximum likelihood function (Log L) of the null model and Lc is the Log L of the alternative model.
The models that presented the same number of parameters were compared by the AIC criterion (Akaike, 1977), which was calculated to classify the models, according to their ability to fit the data, where the lower the AIC value, the better the fit.
Genetic and phenotypic trends were analyzed visually by the interpretation of the graph obtained by Office Excel software. Thus, the genetic trends were calculated by the average genetic value per year, expressed as a percentage of the phenotypic average of the respective year. The genetic gain was calculated by the difference in the genetic value of 2016 and 2012. The phenotypic trends were calculated by the average birth weight in each year and their progress was calculated by the difference in the average weight in 2016 and the average weight in 2012.
Results and discussion
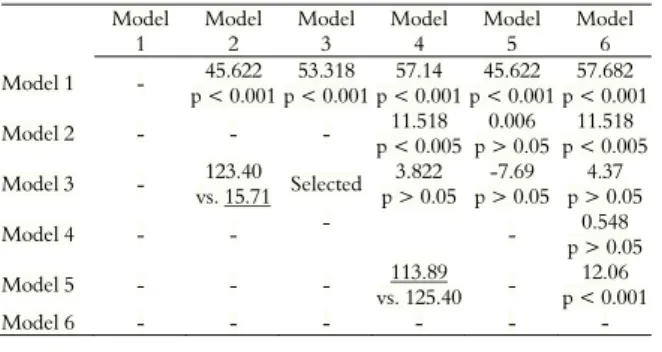
The likelihood ratio test (LRT) between the models with different number of parameters and the Akaike criterion (AIC) for models with the same number of parameters are listed in Table 1. Model 1 showed the worst fit to the data. Considering the LRT, the best models were 2 and 3, that is, those considering maternal additive effects and maternal permanent environmental effects, respectively. However, the one that best fit the data by the AIC and, consequently, was selected to present the genetic components was model 3.
Table 1. LRT between the models (above the diagonal), comparing models with zero degrees of freedom performed by the AIC test (below the diagonal).
Model 1 Model 2 Model 3 Model 4 Model 5 Model 6
Model 1 - 45.622
p < 0.001 53.318 p < 0.001
57.14 p < 0.001
45.622 p < 0.001
57.682 p < 0.001
Model 2 - - - 11.518
p < 0.005 0.006 p > 0.05
11.518 p < 0.005
Model 3 - 123.40
vs. 15.71 Selected 3.822 p > 0.05
-7.69 p > 0.05
4.37 p > 0.05
Model 4 - - - - 0.548
p > 0.05
Model 5 - - - 113.89
vs. 125.40 -
12.06 p < 0.001
Model 6 - - - -
Results that match those obtained by Lôbo et al. (2009) and Gowane, Chopra, Prince, Paswan and Arora (2010), who found the best fit to the data for the model that considered direct additive and maternal permanent environmental effects. Gowane et al. (2010) reported that several studies failed to partition the maternal additive and maternal environmental effects due to the requirement of repeated records for the sheep and, consequently, larger data volume.
Bahreini Behzadi et al. (2007) and Kariuki, Ilatsia, Kosgey and Kahi (2010) found results where the model that considered the direct and maternal additive effects was the one that better fit to the data of birth weight by LRT.
For Eskandarinasab, Ghafouri-Kesbi and Abbasi (2010) and Mohammadi, Shahrebabak Vatankhah and Shahrebabak (2013), the model that best fit to the data was the one considering direct and maternal additive effects. Eskandarinasab et al. (2010) attribute to the maternal genetic component a contribution to the phenotypic variance, roughly equal to the direct genetic effects (0.22 versus 0.23) for birth weight. This finding indicates that genes that contribute to maternal performance also have a similar influence on the individual’s birth weight, such as genes carried by them. The same authors argue that the inability to properly model the contribution of maternal genetic effects may result in an overestimation of the additive genetic variance and, therefore, an overestimation of heritability. In this study, the model equivalent to the study of these authors was the second-best fit, being only inferior to the model that considered the direct additive and permanent maternal environmental effects by AIC.
great environmental variations. Given the fact, it is important to consider this characteristic in extensive grazing systems.
Contrary to all studies already discussed, Ulutas, Sirin, Aksoy, Sahin and Kura (2013) found a better fit with the model that considered only the direct additive effect. The authors point out that this model presented higher values of genetic parameters and heritability, since all the genetic variation was included in this random effect. However, the authors make clear the importance of maternal effects, in which in the model that considered direct, maternal, maternal permanent environmental effects and direct maternal covariance, 19.4% of the total variance was attributed to the maternal effect and 0.04% to the maternal permanent environment. When the factor of the maternal permanent environment was removed, estimates of maternal effects were overestimated. In this sense, the authors conclude that although the simplest model was the best fit, the maternal effect, on birth weight should be taken into account.
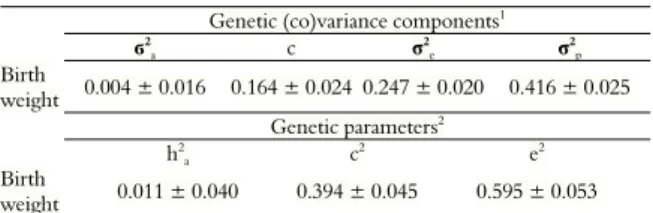
The (co)variance components and genetic parameters for birth weight are listed in Table 2, with estimates of direct additive genetic variance of 0.004, maternal permanent environmental variance of 0.164, residual variance of 0.247 and phenotypic variance of 0.416. For the heritability coefficient, phenotypic variation attributed to maternal permanent environment and phenotypic variance attributed to environmental effects were, respectively, 0.011, 0.394 and 0.595.
Table 2. (Co)variance components and genetic parameters for birth weight of Texel sheep reared in extensive system.
Genetic (co)variance components1
ϭ2
a c σ
2
e σ
2 p
Birth
weight 0.004 ± 0.016 0.164 ± 0.024 0.247 ± 0.020 0.416 ± 0.025
Genetic parameters2
h2
a c
2 e2
Birth
weight 0.011 ± 0.040 0.394 ± 0.045 0.595 ± 0.053
1σ2
a: Direct additive genetic variance; c: Variance attributed to the permanent maternal
environment; σ2
e: Residual variance; e σ 2
p: Phenotypic variance.
2h2
a: Direct additive
heritability; c2: Phenotypic variation attributed to the permanent maternal environment;
and e2: Phenotypic variation attributed to unknown environmental factors.
In Mehraban sheep, Mohammadi and Edriss (2007) reported estimates of direct additive variance of 0.12, maternal permanent environmental variance of 0.07, direct heritability coefficient of 0.35, and proportion of the phenotypic variance attributed to the maternal permanent environment of 0.11. Lavvaf and Noshary (2008), in Lori sheep, found direct additive and maternal permanent environmental variances, direct heritability coefficient and phenotypic variation due to maternal permanent environment of 0.609 and 0.407, 0.488
and 0.326, respectively. For Zamani and Mohammadi (2008), estimates were 0.09, 0.02, 0.26 and 0.05 for the direct additive variance, maternal permanent environment, heritability coefficient and phenotypic variation due to the permanent environment of the sheep, for the birth weight trait of Mehraban sheep.
For Targhee sheep, Borg, Notter and Kott (2009) estimated direct additive variance and maternal permanent environmental variance of 0.144 and 0.060, respectively; with a direct heritability coefficient of 0.19 and phenotypic variation due to the maternal permanent environment of 0.08. Lôbo et al. (2009) worked with a multibreed crossing system and observed higher values for the direct additive variance than those obtained in this study, as well as lower estimates of variance attributed to the maternal permanent environment, with values of 0.204 and 0.045, respectively. These same authors verified estimates of direct heritability of 0.35 and a phenotypic variation attributed to the maternal permanent environment of 0.077. These results demonstrate that the selection of animals for birth weight in the flock in question will reach a rapid genetic progress by presenting a moderate heritability coefficient and a low coefficient for the influence of the maternal permanent environment. Facts that did not occur in the current study, in which the genetic progress may be low, due to the great influence of the maternal permanent environment on the weight at birth.
The phenotypic variance found herein was superior to those reported by Gowane et al. (2010), for Bharat Merino sheep (0.347). Nevertheless, they obtained a residual variance of 0.260, with consequent estimates of direct additive and maternal permanent environmental variances of 0.017 and 0.067, respectively. In the study of these authors, estimates of the heritability coefficient and the phenotypic variance attributed to the permanent maternal environment were 0.05 and 0.19, respectively.
Gowane et al. (2010) attributed their findings to the poor nutritional level in which the sheep were managed, giving rise to a wide environmental variation, with a great importance of the effect of permanent environment of the mother on the weight of the lambs at birth.
variance (9.7%, 0.04 ± 0.01), thus presenting a direct heritability higher than the phenotypic variation attributed to the maternal permanent environment (0.24 vs. 0.09, respectively). The authors argue that the variation in maternal permanent environment may be due to physiological differences in the ability to provide nutrients to the developing fetus and physical differences in pelvic dimensions among ewes.
In the New Zealand sheep industry, Everett-Hincks, Mathias-Davis, Greer, Auvray and Dodds (2014) obtained direct additive variance of 0.087, maternal permanent environmental variance of 0.065 and phenotypic variance of 0.239; the direct additive estimate of the present study was lower than that reported by these authors. Likewise, the coefficient of heritability estimated by the authors was higher than those found in the present study, with a proportion of the phenotypic variation explained by the lower maternal permanent environment.
For Santa Inês sheep, Aguirre et al. (2016) found estimates of direct additive variance of 0.111 and 0.284 for the maternal permanent environment, with estimates of direct heritability and phenotypic variance explained by maternal permanent environment of 0.22 and 0.57, respectively. These authors associate these high proportions of the variance with the maternal permanent environment values, and the extensive rearing system on pasture, in which the sheep are in constant feeding transition due to the great environmental variations. Therefore, it is important to consider this effect in extensive grazing systems. The authors, in discussion, claimed that in systems with controlled environment these estimates are low, varying between 0.18 and 0.04.
None of the studies used in the discussion presented values similar to those obtained herein, in which the direct heritability was low, while the phenotypic variation attributed to the maternal permanent environment was high.
The coefficients of heritability of the productive characteristics are not constant and can vary according to the environmental conditions. There are two alternative hypotheses that may explain this phenomenon. First, the genetic variation of the quantitative traits may change as a direct response to the environmental conditions in which they are expressed, and second, the harsh rearing environment inflates the error variance and results in lower heritability estimates (Ghafouri-Kesbi, Abbasi, Afraz, Babaei, Baneh, & Abdollahi Arpanahi, 2011). Therefore, the authors refer to the influence
of maternal effects, when the phenotype of a mother or the environment it experiences, has a phenotypic effect on the offspring. This demonstrates that, when maternal genetic effects are present but not considered, the parameters become biased, with a consequent reduction in selection efficiency. This importance is because the environment provided by the mother includes the uterine environment, the amount of milk produced, the composition of the milk and the udder conditions (Jafari & Hashemi, 2014), thus permanently impacting the productivity of an animal.
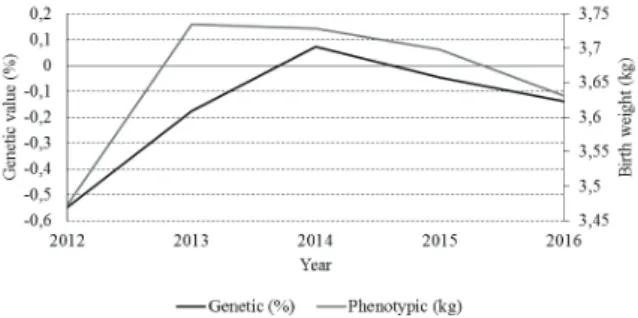
Genetic and phenotypic trends for birth weight are illustrated in Figure 2, where for genetic gain, there was a genetic gain of 0.413% and for the phenotypic trend, a phenotypic gain of 0.159 kg, between the years of 2012 and 2016.
For the genetic trend, a large genetic gain was registered between 2012 and 2013, with a marked gain between 2013 and 2014, but lower than the previous one, which represents an average gain 0.128% per year, from 2012 to 2014. However, between 2014 and 2016, there was a reduction of the average genetic value of the flock by 0.104% per year, accounting for an average genetic gain of 0.103% per year between 2012 and 2016.
For phenotypic progress, there was a weight gain between 2012 and 2013, with a gain in birth weight of 0.263 kg, shortly after 2013, the average weights, for each year, presented a reduction by 2016, totaling a loss of 0.103 Kg in this period. Therefore, the average phenotypic gain was 0.039 kg per year.
Figure 2. Genetic and phenotypic trends for birth weight of Texel sheep reared in extensive system. *Δg: genetic gain between 2012 and 2016; Δp: phenotypic gain between 2012 and 2016.
fluctuations in climatic conditions were responsible for the great environmental oscillations found.
In extensive rearing systems, natural pastures directly influence animal performance, due to the fact that environmental conditions impact on the quality and quantity of this food source. Furthermore, diseases and parasitic load are influenced by climatic conditions, which may also affect animal performance (Kariuki et al., 2010). The authors believe that very pronounced fluctuations in environmental trends may indicate a lack of human intervention to control circumstances, especially to improve or maintain quality and quantity of food.
For the Makooei breed, Mohammadi et al. (2013) found low genetic trends for birth weight, but steadily between 1996 and 2009, with a value of 0.075 kg. Contrary to the results obtained in the present study, Aguirre et al. (2016) reported a genetic loss of 0.012 kg from 2003 to 2014. The authors attribute to this finding the fact that there is no selection for the birth weight trait in this Santa Inês flock.
Conclusion
The models of best fit by the likelihood ratio test were models 2 and 3. According to Akaike’s criterion, the model that considered the direct additive, maternal and maternal permanent environmental effects was the most suitable for the estimation of the (co)variance components and genetic parameters.
Estimates of the direct heritability coefficient and the proportion of the phenotypic variance explained by the maternal permanent environment presented lower and higher values, respectively, when compared to those reviewed.
The trends indicate gains in the birth weight trait, between the years of 2012 and 2016, under extensive management.
References
Aguirre, E. L., Mattos, E. C., Eler, J. P., Barreto Neto, A. D., & Ferraz, J. B. (2016). Estimation of genetic parameters and genetic changes for growth characteristics of Santa Ines sheep. Genetics and Molecular Research,15(3). doi: 10.4238/gmr.15038910. Akaike, K. (1977). On entropy maximization principle. In P.
R. Krishnaiah (Ed.), Applications of statistics (p. 27-41).
Amsterdam, NL:North Holland Publishing.
Bahreini Behzadi, M., Shahroudi, F., & Van Vleck, L. (2007). Estimates of genetic parameters for growth traits in Kermani sheep. Journal of Animal Breeding and Genetics, 124(1), 296-301.
Banchero, G., Ganzábal, A., Montossi, F., Barbieri, I., & Quintans, G. (2012). Aportes de la Investigación para el Aumento de la Producción de Corderos. Veterinaria (Montevideo), 48(Suppl. 1), 13-18.
Borg, R. C., Notter, D. R., & Kott, R. W. (2009). Genetic analysis of ewe stayability and its association with lamb growth and adult production. Journal Animal Science,
87(11), 3515-3524.
Eskandarinasab, M., Ghafouri-Kesbi, F., & Abbasi, M. A. (2010). Different models for evaluation of growth traits and Kleiber ratio in an experimental flock of Iranian fat-tailed Afshari sheep. Journal of Animal Breeding and Genetics,127(1), 26-33.
Everett-Hincks, J. M., Mathias-Davis, H. C., Greer, G. J., Auvray, B. A., & Dodds, K. G. (2014). Genetic parameters for lamb birth weight, survival and death risk traits. Journal Animal Science, 92(7), 2885-2895. Ghafouri-Kesbi, F., Abbasi, M. A., Afraz, F., Babaei, M.,
Baneh, H., & Abdollahi Arpanahi, R. (2011). Genetic analysis of growth rate and Kleiber ratio in Zandi sheep. Tropical Animal Health and Production, 43(6), 1153-1159.
Gowane, G. R., Chopra, A., Prince, L. L., Paswan, C., & Arora, A. L. (2010). Estimates of (co)variance components and genetic parameters for body weights and first greasy fleece weight in Bharat Merino sheep.
Animal, 4(3), 425-431.
Hatcher, S., Atkins, K. D., & Safari, E. (2010). Lamb survival in Australian Merino sheep: a genetic analysis.
Journal Animal Science, 88(10), 3198-205.
Hogg, R., & Craig, A. (1995). Introduction to mathematical statistics. New Jersey, NJ: Prentice Hall.
Jafari, S., & Hashemi, A. (2014). Genetic analysis of fleece and post-weaning body weight traits in Makuie sheep. Genetics and Molecular Research,13(1), 1079-1087.
Kariuki, C. M., Ilatsia, E. D., Kosgey, I. S., & Kahi, A. K. (2010). Direct and maternal (co)variance components, genetic parameters and annual trends for growth traits of Dorper sheep in semi-arid Kenya. Tropical Animal Health and Production,42(3), 473-781.
Lavvaf, A., & Noshary, A. (2008). Estimation of genetic parameters and environmental factors on early growth traits for Lori breed sheep using single trait animal model. Pakistan Journal of Biological Sciences,
11(1), 74-79.
Lôbo, A. M., Lôbo, R. N., Paiva, S. R., Oliveira, S. M., & Facó, O. (2009). Genetic parameters for growth, reproductive and maternal traits in a multibreed meat sheep population. Genetics and Molecular Biology,32(4), 761-770.
Meyer, K. (2012). WOMBAT - A program for mixed model analyses by restricted maximum likelihood. User notes. Animal genetics and breeding unit. Armidale, AU: University of New England.
Mohammadi, H., & Edriss, M. A. (2007). Genetic parameters of early growth traits in Mehraban breed of sheep. Pakistan Journal of Biological Sciences, 10(3), 373-377.
trends for growth traits of Makooei sheep in Iran. Tropical Animal Health and Production, 45(1), 185-191.
R Core Team (2016). R: A language and environment for statistical computing. Vienna, AT: R Foundation for Statistical Computing. Retrieved from https://www.R-project.org/
Sawalha, R., Conington, J., Brotherstone, S., & Villanueva, B. (2007). Analysis of lamb survival of Scottish Blackface sheep. Animal, 1(1), 151-157.
Shokrollahi, B., & Baneh, H. (2012). (Co)variance components and genetic parameters for growth traits in Arabi sheep using different animal models. Genetics and Molecular Research,11(1), 305-314.
Ulutas, Z., Sirin, E., Aksoy, Y., Sahin, A., & Kuran, M. (2013). Estimates of (co)variance components for direct
and maternal effects on birth weight of Karayaka lambs.
Tropical Animal Health and Production, 45(4), 953-956. Zamani, P., & Mohammadi, H. (2008). Comparison of
different models for estimation of genetic parameters of early growth traits in the Mehraban sheep. Journal of Animal Breeding and Genetics, 125(1), 29-34.
Received on March 29, 2017. Accepted on August 1, 2017.