Palavras chave: Análise multivariada Divergência genotípica Conservação Historic: Received 09/10/2017 Accepted 19/12/2017
Keywords: Multivariate analysis Genotypic divergence
Conservation
1 Paulista State University - Ilha Solteira, São Paulo, Brazil +Correspondence:
DOI: 10.1590/01047760201723042450
Alexandre Marques da Silva¹, Daniela Silvia de Oliveira Canuto1+, Mario Luiz Teixeira de Moraes1
GENETIC PARAMETERS IN RIPARIAN REFLORESTATION WITHOUT STRUCTURE OF PROGENIES BY MIXED MODELS (REML/BLUP)
ABSTRACT: The objective of this work is to estimate genetic parameters for silvicultural traits in riparian reforestation at 20 years of age, without progeny structure by mixed models (REML / BLUP). The present work was carried out at the Fazenda de Ensino, Pesquisa e Extensão (FEPE) of the Faculdade de Engenharia de Ilha Solteira, Universidade Estadual “Julio de Mesquita Filho” (FEIS/UNESP), located in the municipality of Selvíria (MS). In February and March of 1986 began the planting of the riparian reforestation in modules, existing two Modules with different numbers of species. The spacing used in the planting of the species was 2 x 3 m. The riparian reforestation has an area of 9.5 ha in the total sum of the two Modules of planting. The silvicultural traita evaluated at 20 years were total plant height (ALT, m), diameter at breast height (DBH, cm) and survival of planted individuals, which were used to calculate the variance component components of genetic parameters, using the genetic-statistical program SELEGEN-REML/BLUP. High genetic variability was observed among the genotypes for the silvicultural traits studied in the riparian reforestation. The accuracy was of high magnitude, showing good reliability of the results. The mixed model method (REML/BLUP) was adequate for the estimation of genetic parameters and prediction of genotypic values in riparian reforestation, and it could be used routinely.
PARÂMETROS GENÉTICOS EM REFLORESTAMENTO CILIAR SEM ESTRUTURA DE PROGÊNIES POR MODELOS MISTO (REML/BLUP)
RESUMO: O objetivo deste trabalho é estimar parâmetros genéticos para caracteres
silviculturais em reflorestamento ciliar aos 20 anos de idade, sem estrutura de progênies
por modelos mistos (REML/BLUP). O presente trabalho foi realizado na Fazenda de Ensino, Pesquisa e Extensão (FEPE) da Faculdade de Engenharia da Ilha Solteira, Universidade Estadual “Julio de Mesquita Filho” (FEIS/UNESP), localizada no município
de Selvíria (MS). Em fevereiro e março de 1986 iniciou o plantio do reflorestamento
ciliar em módulos, existindo dois modelos com diferentes números de espécies. O
espaçamento utilizado no plantio das espécies foi de 2 x 3 m. O reflorestamento ciliar
tem uma área de 9,5 ha na soma total dos dois modelos de plantio. As características silviculturais avaliadas aos 20 anos foram a altura total de planta (ALT, m), o diâmetro
na altura do peito (DAP, cm) e a sobrevivência dos indivíduos plantados, as quais foram
utilizadas para calcular as estimativas dos componentes de variância dos parâmetros genéticos, utilizando o programa genético-estatístico SELEGEN-REML/BLUP. Observou-se alta variabilidade genética entre os genótipos para os caracteres silviculturais estudados
no reflorestamento ciliar. A acurácia foi de alta magnitude, mostrando boa confiabilidade
dos resultados. O método do modelo misto (REML/BLUP) mostrou-se adequado à
estimação de parâmetros genéticos e predição de valores genotípicos no reflorestamento
OF PROGENIES BY MIXED MODELS (REML/BLUP)
INTRODUCTION
Among the main consequences of deforestation are: depletion of timber stocks, accelerated soil
destruction, gradual desertification, with consequent decrease in productivity, occurrence of floods and
increase of the greenhouse effect. It is known that the forest is an association of living organisms in equilibrium, highly vulnerable to internal and external threats. Any damage can break the integrity of that harmonic cycle and cause chain destruction. Activities such as logging,
farming, urban sprawl, fires and inadequate management
of the soil, mining and even tourism and leisure, without appropriate criteria, can harm the forest.
The Cerrado stricto sensu is the biome that has been suffering the highest rates of deforestation due to the rapid process of expansion of the country’s agricultural frontiers, attracting much of the national agribusiness to these areas. Among the vegetal formations
of the Cerrado, the fluvial or riparian environment, it is
characterized by being associated with water courses with high richness, genetic diversity and for its role in the protection of water resources, edaphic, wild and aquatic fauna. In this context, it is necessary to develop alternative models of management that will contribute to reduce the degradation process of riparian forests, such as restoring natural vegetation and preserving biodiversity, providing food and shelter to the local fauna, restoring the protection of body of water and avoid erosion.
The intense and disorderly devastation can lead to the disappearance of several forest species of ecological and commercial importance in several regions, with serious impairment of their genetic potential (KAGEYAMA; DIAS, 1982). Therefore, its restoration, using plant species suitable for this purpose, is an urgent and essential necessity for the conservation of the water resources of altered river basins (SALVADOR, 1989). The restoration or mixed planting of native species in deforested areas, aiming to form a forest as close as possible to the original one, has been the utopia of researchers who have been dedicating themselves to the recovery of areas of permanent degraded protection (KAGEYAMA; GANDARA, 2004). The genetic diversity promotes the raw material for the adaptation, evolution and survival of species and individuals, being fundamental for the sustainability and stability of the ecosystem (BARREIRA et al., 2006). That is, genetic variation is necessary for populations to be able to cope with environmental changes (SANTOS; DIAS, 2013).
In the characterization of genetic diversity, basically four types of markers are used: morphological, biochemical, molecular and cytological (KAMADA et al.,
2009). Morphological markers have the advantage of being
identified according to the commercial interest of the plant
as: height (H), DBH (diameter at breast height), wood density, stem shape, seed production, etc. Phenotypic traits are used as morphological markers since the time of
Mendel as easily identifiable visual phenotypes.
According to Resende (2016) the procedure of estimation/prediction in the improvement of perennial species that is being most used is the REML/BLUP (restricted maximum likelihood/best non-vitiated linear prediction). The REML/BLUP method is an excellent genotypic evaluation procedure, and it is known as the mixed model methodology. This procedure naturally addresses the imbalance, leading to more accurate estimates and predictions of genetic parameters and values, respectively. In view of this situation, the present work aims to estimate genetic parameters for silvicultural traits in riparian reforestation at 20 years of age, without progeny structure by the mixed REML/BLUP models.
MATERIAL AND METHODS
The present work was carried out at the Fazenda de Ensino, Pesquisa e Extensão (FEPE) of the Faculty of Engineering of Ilha Solteira, Universidade Paulista “Julio de Mesquita Filho” (FEIS/UNESP), located in the municipality of Selvíria (MS).
The climate of the region was classified as Aw,
according to the Köeppen system, presenting rainfall in the summer and dryness in the winter. By the current nomenclature at suborder level is a RED LATOSOL (EMBRAPA, 2013). The study area is on the Paraná
Sedimentary Basin Plateau, with very smooth slopes, flat
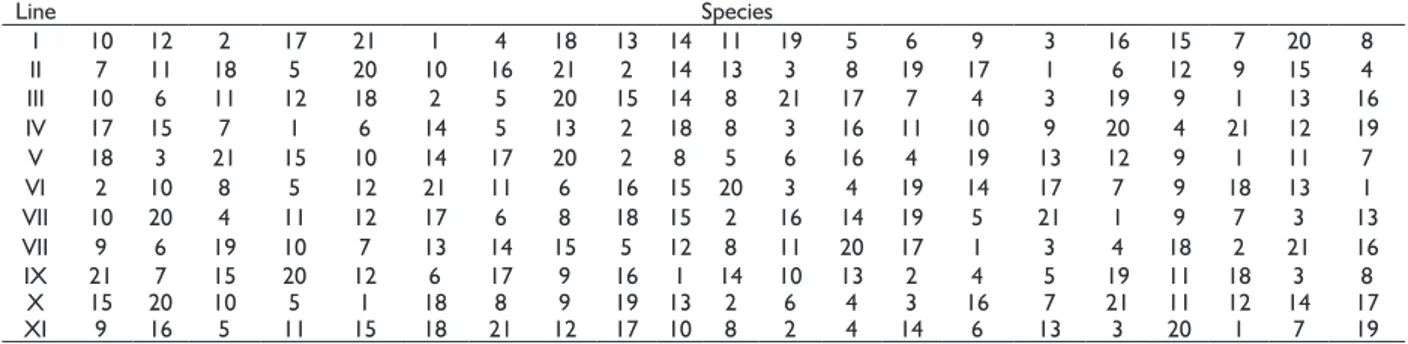
and gently undulating relief (ALVES; SOUZA, 2008). The riparian reforestation area is located at the FEPE and it was deforested and had an intense mechanized activity for rice planting (Silva et al 2016). In February and March of 1986 the riparian reforestation was carried out in two modules, with different numbers of species, using seedlings donated by CESP (Companhia Energética de São Paulo). The Module I (Table 1) consists of 21 species, planted in 33 repetitions, and Module II (Table 2) by 14 species in 13 repetitions and the spacing used was the 2 x 3 m. The riparian reforestation has an area of 9.5 ha in the total sum of the two Modules of planting. In Table 1 and 2 are the sketch of species distribution of Module 1 and Module 2, respectively. The
experiments have 11 planting lines, with the first and last rows (I and XI) being bordered. The identification of the
The silvicultural traits evaluated at 20 years were: total plant height (H, m), diameter at breast height (DBH, cm) and survival (S) of planted individuals. The species
Plinia truncifl ora (13A) and Alibertia edulis (13B) did not enter the statistical analysis due the following fact: Due
the insuffi cient number of seedlings of 13B to plant in both
modules, some plots were planted with 13B and, then there are modules that were planted the two species, and these are not repeated equally in all modules. The silvicultural trait data were used to calculate the variance components using the genetic-statistical program SELEGEN-REML/BLUP (RESENDE, 2016), which uses genetic evaluation techniques involving the prediction of values and the estimation of variance components. The procedure adopted by the SELEGEN program to predict genetic values is BLUP (best univariate linear prediction), using estimates of variance components obtained by the maximum likelihood (REML) method.
The experiment was set up without a progeny structure and one site, each species was considered as a population and each module one replicate, so the SELEGEN-REML / BLUP was used, following the model 24 (RESENDE, 2006), which refers to complete blocks, several populations, without progeny structure, in one place: y = Xr + Zg + Wp + e, where y is the data vector,
r is the vector of repetition effects (assumed to be fi xed)
plus the general mean, g is the vector of genotypic effects of populations (assumed to be random ), p is the vector
of plot effects, e is the vector of errors or residuals (random). Capital letters represent the incidence matrixes for these effects.
The genetic parameters estimated by the silvicultural traits were: Vg: genotypic variance among populations; Vc: environmental variance between plots;
Ve: residual variance; Vf: individual phenotypic variance; : individual heritability in the broad sense, that is, of the total genotypic effects of populations; : coeffi cient of determination of plot effects; : heritability of the population mean, assuming complete survival; accuracy of population selection, Ac: assuming complete survival; m: Average of traits; LRT:l ikelihood ratio test;
CVr: coeffi cient of relative variation; CVg: coeffi cient
of genetic variation among progenies; CVe: coeffi cient of environment variation. Multivariate analysis was calculated using model 104 (RESENDE, 2006), which calculates measures of genotypic divergence based on the statistical distance of Mahalanobis. This distance allows to obtain alternative groupings, according to the Tocher method. The criterion for evaluating the Tocher grouping is that the mean of the genetic divergence measures within each group should be less than the mean distances between any groups. To obtain the Tocher grouping, the arboreal species P. truncifl ora and A. edulis of Module I and
Eriobotrya japonica of Module II were withdrawn for the calculation, due to the presence of zeros values, which impaired statistical analysis.
RESULTS AND DISCUSSION
Prediction of Genetic Parameters
MODULE I
The Vf for the ALT trait was 27.4194 and the residual variance (Ve) contributed 64%. For DBH, the residual variance (Ve) and genotypic variance among populations (Vg) contributed similarly to the value of phenotypic variation (144.01). For the survival trait (S),
TABLE 1 Schematic of distribution of Module I species from the riparian reforestation in FEPE.
Line Species
I 10 12 2 17 21 1 4 18 13 14 11 19 5 6 9 3 16 15 7 20 8
II 7 11 18 5 20 10 16 21 2 14 13 3 8 19 17 1 6 12 9 15 4
III 10 6 11 12 18 2 5 20 15 14 8 21 17 7 4 3 19 9 1 13 16
IV 17 15 7 1 6 14 5 13 2 18 8 3 16 11 10 9 20 4 21 12 19
V 18 3 21 15 10 14 17 20 2 8 5 6 16 4 19 13 12 9 1 11 7
VI 2 10 8 5 12 21 11 6 16 15 20 3 4 19 14 17 7 9 18 13 1
VII 10 20 4 11 12 17 6 8 18 15 2 16 14 19 5 21 1 9 7 3 13
VII 9 6 19 10 7 13 14 15 5 12 8 11 20 17 1 3 4 18 2 21 16
IX 21 7 15 20 12 6 17 9 16 1 14 10 13 2 4 5 19 11 18 3 8
X 15 20 10 5 1 18 8 9 19 13 2 6 4 3 16 7 21 11 12 14 17
XI 9 16 5 11 15 18 21 12 17 10 8 2 4 14 6 13 3 20 1 7 19
TABLE 2 Schematic of distribution of Module II species from the riparian reforestation in FEPE.
Line Species
I 14 9 4 3 6 1 5 13 2 12 10 7 8 11
II 9 11 8 2 12 7 10 4 1 13 6 14 3 5
III 9 11 7 12 4 3 8 6 10 14 13 5 1 2
IV 7 6 14 8 13 5 10 9 2 11 3 1 4 12
V 10 8 7 3 6 4 12 1 2 9 11 14 13 5
VI 11 8 2 6 9 10 12 7 4 13 3 1 14 5
VII 5 12 11 7 2 6 13 1 8 3 10 4 9 14
VIII 9 11 1 7 13 5 4 8 14 10 12 6 2 3
IX 1 14 5 11 7 9 6 4 3 8 12 10 13 2
X 9 3 7 14 12 1 2 8 6 13 4 10 5 11
OF PROGENIES BY MIXED MODELS (REML/BLUP)
the phenotypic variation (0.2285) had a greater contribution to the residual variation (Ve= 0.1590) (Table 4).
The individual heritability in the broad sense ( The individual heritability in the broad sense ( ) was higher for the DBH trait. This result is expected since the DBH was the one that presented the greatest contribution of the genotypic variation among populations (Vg) under the phenotypic variation (Vf). The coeffi cient of determination of plot effects (
of plot effects ( ) was of low magnitude, indicating a low environmental variation. Values of observed in trials with high experimental control in perennial plants are around 10%, when the estimated heritability is of the order of 30%, that is, 10% of the total phenotypic variation within
the block (FARIAS NETO et al., 2008). Thus, at the 30%
level of individual heritability, > 0.10 can be classifi ed as low and > 0.10 can be classifi ed as high, thus allowing
inference on spatial variability within blocks. The mean heritability of populations was high for all traits, suggesting high genetic progress in response to selection using population information.
The accuracy (Ac) was of high magnitude for the traits (0.99), according to Resende and Duarte (2007), showing robust reliability of the results, since the
selective accuracy refl ects the quality of the information
and procedures used in the prediction of genetic values and the higher. The selective accuracy in the evaluation of
a individual, the greater the confi dence in the assessment
and predicted for the individual. (PIMENTEL et al., 2014). This measure is associated with the precision of selection and refers to the correlation between predicted genetic values and true genetic values of individuals.
The overall mean for the H trait was higher in Module II, but lower for the DBH and for the S the
Modules presented close values. The coeffi cient of
genetic variation (CVg), which indicates in percentage the general average of the amount of genetic variation (RESENDE, 2007) was superior for the DBH trait,
but inferior to the experimental coeffi cient, similar to Canuto et al. (2016). The coeffi cient of relative variation
(CVr) and CVg indicated that DBH is the best trait for selection and the one that presents the best possibilities
of fi nding superior progenies. Also, it is the trait with
higher correlation with height (Table 5.) and second Silva et al. (2012) is a trait easily measurable and that holds less percentage of error during its evaluation.
MODULE II
The genetic variance was the one of the variance componetes that contributed most to the phenotypic variance values for H and DBH traits, refl ecting the high individual hedge values in the restricted sense, a, 59 and 0.63 for H and DBH, respectively (Table 4).
The coefficient of determination of plot effects (
The coefficient of determination of plot ) indicated that there is a low environmental variation between plots, being higher for S. The average heritability of populations was of high magnitude for the three traits evaluated, but it assumes complete survival, which does
not occur in the experiment. Following the classifi cation
proposed by Resende and Duarte (2007), the accuracy was very high (Ac < 0.90) for all evaluated traits.
The coeffi cient of genetic variation (CVg) was highest for DBH and was also higher than the coeffi cient of experimental variation. The CVr, which is the parameter
TABLE 3 Species used in riparian reforestation at FEPE. Number Name Common name Family/Subfamily
Module I
1 Albizia lebbeck Albizia Mimosoideae
2 Holocalyx balansae Alecrim-do-campo Caesalpinoideae
3 Morus nigra Amora Moraceae
4 Myroxylon peruiferum Bálsamo Papilionoideae 5 Spondias lutea Cajá-mirim Anarcadiaceae 6 Peltophorum dubium Canafístula Caesalpinioideae
7 Ficus guaranitica Figueira Moraceae
8 Psidium guajava Goiaba Myrtaceae
9 Parapiptadenia rigida Guarucaia Mimosaceae 10 Tabebuia sp. Ipê-amarelo Bignoniaceae 11 Tabebuia roseo-alba Ipê-branco Bignoniaceae 12 Tabebuia impetiginosaIpê-roxo Biognoniaceae 13A Plinia truncifl ora Jabuticaba Myrtaceae
13B Alibertia edulis Marmelo Myrtaceae
14 Jacaranda cuspidifolia Jacarandá-caroba Bignoniaceae
15 Machaerium
acutifolium
Jacarandá-do-campo Papilionoideae
16 Syzygium cumini Jambolão Myrtaceae
17 Licania tomentosa Oiti Chrysobalanaseae
18 Ceiba speciosa Paineira Bombacaceae
19 Koelreuteria paniculataQuereutéria Sapindaceae
20 Enterelobium
contortisiliquum Tamboril Mimosoideae 21 Hovenia dulcis Uva japonesa Rhamnaceae
Module II
1 Anadenanthera
peregrina var. falcata Angico-roxo Mimosaceae
2 Myracrodruon
urundeuva Aroeira Anacardiaceae
3 Cordia ecalyculata Café-de-bugre Boraginaceae 4 Mabea fi stulifera Canudo-de-pito Euphorbiaceae 5 Terminalia argentea Capitão-do-campo Combretaceae
6 Genipa americana Jenipapo Rubiacea
7 Inga sp. Ingá Mimosaceae
8 Tabebuia sp
Ipê-amarelo-do-campo Bignoniaceae
9 Tabebuia heptaphylla Ipê-rosa Bignoniaceae 10 Michelia champaca Magnólia-amarela Magnoliaceae 11 Eriobotrya japonica Nespereira Rosaceae
12 Adenanthera
pavonina
Olho-de-dragão Fabaceae
TABLE 4 Estimates of genetic parameters for silvicultural traits studied from Modules I and II of riparian reforestation at 20 years of age.
Parameter Module I Module II
Height (m) DBH (cm) Survival Height (m) DBH (cm) Survival
Vg 8.4400 67.6992 0.0408 26.1417 90.1113 0.0522
Vc 1.3511 6.2698 0.0287 0.1899 0.2974 0.0128
Ve 17.6282 70.0440 0.1590 18.0535 52.5793 0.1677
Vf 27.4194 144.0130 0.2285 44.3850 142.9881 0.2328
0.31 ± 0.03 0.47 ± 0.04 0.18 ± 0.01 0.59 ± 0.09 0.63 ± 0.09 0.22 ± 0.03
0.0493 0.0435 0.1256 0.0043 0.0021 0.0550
0.99 0.99 0.98 0.99 0.99 0.96
Ac 0.9945 0.9970 0.9838 0.9971 0.9976 0.9789
m 8.73 14.26 0.37 9.89 13.55 0.36
LRT 311.99** 517.15** 383.93** 187.23** 228.27** 137.31**
CVr 0.56 0.81 0.46 1.50 1.54 1.04
CVg 33.31 57.71 55.00 51.72 70.07 62.64
CVe 59.70 71.21 119.30 34.40 45.36 60.55
** P<0.01
that indicates the ratio between the genotype coeffi cient of the individual and the experimental coeffi cient was
higher than one for all the traits, specialy for DBH, which indicate the DBH as the most favorable trait for selection (ZARUMA et al., 2015). Furthermore, the DBH is the trait that there is greater possibility of selecting better genotypes, indicated by the CVg, and has a high correlation with the ALT.
Matrix of genetic correlation
The genetic correlation between H and DBH was high and positive for both planting Modules (Table 5). Thus, trees with higher H also present greater DBH and the selection option based on DBH should
be refl ected in estimates of expressive genetic gains
for both triats (SAMPAIO et al., 2002; SEBBENN et al., 2009). Survival showed a low genetic correlation with the other silvicultural traits studied, that is, it is
more infl uenced by the environmental effect than the
plant development.
TABLE 5 Genetic correlation between silvicultural traits for Module I and II of riparian reforestation at 20 years of age.
Module I Module II
DBH S DBH S
H 0.92** 0.49 0.94** 0.44
DBH - 0.36 - 0.34
*P< 0.01.
Mahalanobis Genetic Distances (Tocher)
The formation of groups, by the Tocher method,
made it possible to group the genotypes into fi ve groups
(Table 6). Group 1 contains 60% of the evaluated
genotypes, showing similarities to the studied silvicultural traits, being far from groups 4 and 5. In these two groups we have the arboreal species Ficus guaranitica (7) and
Holocalyx balansae (2), species with larger and lower silvicultural performances in riparian reforestation at 20 years of planting (SILVA et al., 2007). It can be observed that in Module I there is high genetic variability for the silvicultural traits studied due to the number of groups formed that do not occurred for Module II of planting. In planting Model II the genotypes were grouped into one group (Table 6).
TABLE 6 Mahalanobis GENE Distinction (Tocher) Grouping for genotypes of the Module I and II.
Group Module I Module II
Genotypes Genotypes
1 3, 4, 5, 6, 8, 10, 11, 12, 14, 16, 18, 21
1, 2, 3, 4, 5, 6, 7, 8, 9, 10, 13, 14, 12
2 1, 15, 17, 19
-3 9, 20
-4 7
-5 2
OF PROGENIES BY MIXED MODELS (REML/BLUP)
CONCLUSIONS
Genotypes of the species have high genetic variability for the silvicultural traits H and DBH at 20 years of planting.
There is a high positive genetic correlation between DBH and H traits, and the direct selection in one trait will results in indirect selection in the other.
The high accuracy of the genotypic values of the genotypes for the silvicultural traits studied indicate that the estimated parameters are robust.
The mixed model method (REML/BLUP) is adequate for the estimation of genetic parameters and prediction of genotypic values in riparian reforestation module trials.
REFERENCES
ALVES, M.C.; SOUZA, Z.M. Recuperação de área degradada por construção de hidroelétrica com adubação verde e corretivo. Revista Brasileira de Ciências do Solo, v. 32, p. 2505-2516, 2008.
BARREIRA, S.; SEBBENNA.M.; SCOLFORO; J.R.S; KAGEYAMA; P.Y. Diversidade genética e sistema de reprodução em população nativa de Eremanthus erythropappus (DC.) MacLeish sob exploração. Scientia Forestalis, n. 71, p. 119-130, 2006.
CANUTO, D.S.O.; SILVA, A.M.; MORAES, M.L.T.; RESENDE,
M.D.V. Estabilidade e adaptabilidade em testes de progênies
de Myracrodruon urundeuva sob quatro sistemas de plantio. CERNE, v. 22, n. 2, p. 171-180, 2016.
EMPRESA BRASILEIRA DE PESQUISA AGROPECUÁRIA - EMBRAPA. Sistema brasileiro de classificação de solos. 3.ed. Brasília, 2013. 353p.
FARIAS NETO, J.T.; RESENDE, M.D.V.; OLIVEIRA, M.S.P.; NOGUEIRA, O.L.; FALCÃO, P.N.B; SANTOS, N.S.A. Estimativas de parâmetros genéticos e ganhos de seleção
em progênies de polinização aberta de açaizeiro. Revista Brasileira de Fruticultura, Jaboticabal - SP, v. 30, n. 4, p. 1051-1056, 2008
KAGEYAMA, P.Y.; DIAS, I.S. Aplicação da genética em espécies
florestais nativas. Silvicultura em São Paulo, São Paulo, v.16A, n.2, p.728-791, 1982.
KAGEYAMA, P.Y.; GANDARA, F.B. Recuperação de áreas ciliares. In: RODRIGUES, R.R.; LEITÃO FILHO, H.F. (Ed.). Matas
ciliares conservação e recuperação. 2.ed. São Paulo: Editora da Universidade de São Paulo, 2004. p. 249-269. KAMADA, T.; PICOLI, E.A.T.; ALFENAS, A.C.; CRUZ, C.D.;
VIEIRA, R.F.; OTONI, W.C. Diversidade genética de populações naturais de Diversidade genética de populações naturais de Pfaffia glomerata (Spreng.) Pedersen estimada por marcadores RAPD. Acta Scientiarum Agronomy. Maringá, v. 31, n. 3, p. 403-409, 2009
PIMENTEL; A.J.B.; GUIMARÃES, J.F.R.; SOUZA, M.A.; RESENDE, M.D.V.; MOURA, L.M.; ROCHA, J.R.A.S.C.; RIBEIRO, G. Estimação de parâmetros genéticos e predição de valor genético aditivo de trigo utilizando modelos mistos. Pesquisa Agropecuária Brasileira, Brasília, v.49, n.11, p.882-890, 2014
RESENDE, M. D. V. O Software Selegen-Reml/Blup. Documentos EMBRAPA, Campo Grande, 2006.
RESENDE, M. D. V. Software Selegen-REML/BLUP: a useful tool for plant breeding. Crop Breeding and Applied Biotechnology. Viçosa, v. 16, p. 330-339, 2016.
RESENDE, M.D.V.; DUARTE, J.B. Precisão e controle de qualidade em experimentos de avaliação de cultivares.
Pesquisa Agropecuária Tropical. v. 37, n. 3, p. 182-194, 2007.
SALVADOR, J.L.G. Considerações sobre as matas ciliares
e a implantação de reflorestamentos mistos nas
margens de rios e reservatórios. 2 ed. São Paulo: CESP/ ARI, 1989. 15p. (Série Divulgação e Informação, 105). SAMPAIO, P.T.B; RESENDE, M.D.V.; ARAÚJO, A.J.
Estimativas de parâmetros genéticos e métodos de seleção para o melhoramento genético de Pinus oocarpa Schied. Pesquisa Agropecuária Brasileira, Braílida, v. 37, n. 5, p. 625-636, 2002.
SANTOS, F.R.; DIAS, C.A.R. Fascículo – Evolução. Belo Horizonte: CAED-UFMG, 2013. 152 p.
SANTOS, H.G.; JACMINE, P.K.T.; ANJOS, L.H.C.; OLIVEIRA, V.A.; OLIVEIRA, J.B.; COELHO, M.R.; LUMBRERAS, J.F.; CUNHA, T.J.F. Sistema brasileiro de classificação de solos. Rio de janeiro: Embrapa Solos, 2013. 353p.
SEBBENN, A.M.; FREITAS, M.L.M.; ZANATTOA.C.S.; MORAIS, E.; MORAES, M.A. Comportamento da variação
genética entre e dentro de procedências e progênies de
Gallesia integrifolia Vell. Moq. para caracteres quantitativos.
Revista do Instituto Florestal, São Paulo, v. 21, n. 2, p. 151-163, 2009.
SILVA, A.M.; CANUTO, D.S.O.; CAMBUIM, J.; MORAES, M.L.T. Reflorestamento ciliar em diferentes modelos
de plantio: margem do reservatório da hidroelétrica
de Ilha Solteira. 191p.,1. Ed., Curitiba, 2016.
SILVA, J. M. AGUIAR, A. V.; MORI, E. S.; MORAES, M. L. T.
Divergência genética entre progênies de Pinus caribaea var
caribaea com base em caracteres quantitativos. Pesquisa Florestal Brasileira, Colombo, v. 32, n. 69, p. 69-77, 2012. ZARUMA; D.U.G.; CANUTO; D.S.O.; PUPIN, S.; CAMBUIM;
J.; SILVA; A.M.; MORI; E.S.; SEBBENN; A.M.; MORAES;
M.L.T. Variabilidade genética em procedências e progênies