An Ordination Technique for Fish Diet Comparisons
Tadeusz Penczak
1, Angelo A. Agostinho
2*and Norma S. Hahn
21 Department of Ecology and Vertebrate Zoology, University of Lódz , 90-237 Lódz , Banacha 12/16, Poland;
2
NUPELIA, Universidade Estadual de Maringá, Av. Colombo, 5790 CEP 87020-900, Maringá, Paraná – Brazil.
ABSTRACT
The frequency of nine food types in the guts of 58 fish species from the Paraná River and its floodplain was compared using similarity definition. A synthetic table ordered on the basis of this definition, with fish species on axis y, and food types on axis x, enabled easy reading numerous kinds of information on feeding ecology of fish in the catchment. For example: 1) which fish species were generalists, specialists or opportunists, 2) those classified as herbivorous species consumed small amounts of animal food, 3) that fish consumed any food type that contained transformed solar energy and matter, 4) what are food preferences dependent on fish taxonomic affinity. The possibility of employing synthetic tables for investigating spatial and temporal variation in fish diet has also been indicated.
Key words: Paraná River, floodplain, fish, feeding, similarity definition, synthetic table
*Author for correspondence
INTRODUCTION
Ordination techniques (or multivariate techniques) have been used commonly in research of plant and animal communities (Krebs, 1989; James & McCulloch, 1990; Diniz-Filho & Bini, 1996), including fish communities
(Winemiller & Leslie, 1992; Agostinho et al.,
1997). The synthetic diagram proposed by Rominiszyn (1970), constructed on the basis of a similarity definition, has also been used for analyzing fish communities (Penczak, 1972; Balon & Stewart, 1983; Witkowski, 1984;
Zalewski et al, 1990; Penczak et al, 1991;
Przybylski et al, 1991; Penczak & Agostinho,
1994).
We employed the similarity definition to compare the diet of numerous species of fish
from large water bodies published by Hahn et al
(1997), where fish species were arranged by taxonomic order, and food items randomly in a large table. By employing the synthetic Romaniszyn (1970) method we wanted to check if ecological interpretations of this data was possible.
MATERIAL AND METHODS
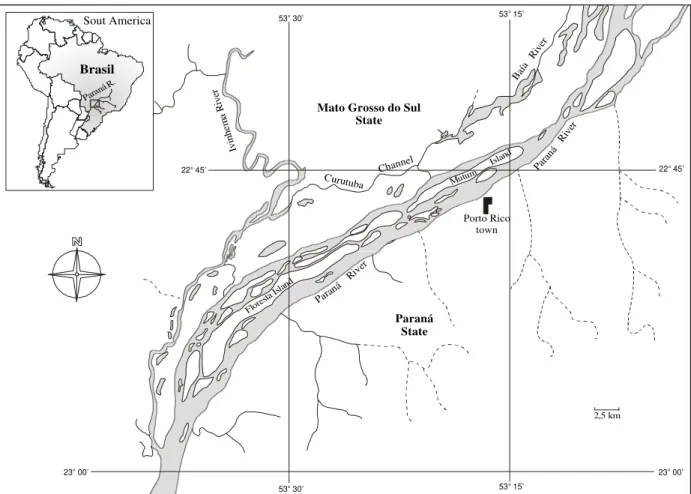
Sampling was carried out in the Paraná River and its floodplain (Fig. 1). In the sampled stretch, extending between the mouths of the Paranapanema and Ivai, the Paraná River has a wide braided channel with a low slope (0.09 m
km-1) and a great accumulation of sediment in its
bed. An extensive alluvial plain (20 km) borders its left margin (Mato Grosso do Sul State), within which lies a complex system of channels and temporary and permanent lagoons.
One fleet of gillnets (mesh size range 3-16 cm knot to knot) was operated monthly between October 1986 to September 1988, and February 1992 to March 1994. Fishes were removed from the nets at 08:00, 18:00 and 22:00 h during each 24 h sampling period.
The material examined consisted of 5713 guts from 58 fish taxa, representing 22 families. The diet of seven fish species was estimated on the basis of one or two guts only, and eight others on the basis of less than 10 fish.
analyzed by the frequency of occurrence (fo%) method (Hynes, 1950):
fo(%) = 100 n1/N
where n1 = numbers of fish containing a
particular prey taxon, and N = total number of fish in the sample.
53 15’o
53 15’o
53 30’o
53 30’o
Porto Rico town
Paraná State Mato Grosso do Sul
State
23 00’o
23 00’o
22 45’o 22 45’o
Baí a
Rive r
Rive r
Rive r
Para ná
Paran á
Sout America
Channel Curutuba
Brasil
2,5 km
Paraná R.
Iv
in
he m a R
iv
er
Flores
ta Island
Mutum
Island
Figure 1. Map of the study area.
The subject of the coenological analysis is a comparison of occurrence frequency of ten diet types in the guts of 58 fish species (Table 1;
Hahn et al, 1997).
Similarity between food types (columns) and between fish species (rows) was calculated using the Marczewski & Steinhaus (1958) equation:
s = 100w /(a + b - w)
where s is similarity of two collections (two food types or two fish species), w is the total of the lower percentage of food types of each pair of species common for two given analyzed food types ('columns') (or the total of the lower percentage of food types of each pair of two given analyzed fish species consuming them ('rows'), a and b are the total percentage of food
types for compared 'columns' (food type) and 'row' (fish species).
Of these two dimensions food types ('columns') and fish species ('rows)) we choose the former to use as an example (Table 2), because the latter would have required presenting a huge (58 columns by 58 rows) table. Because for the calculation of similarity coefficients a given numerical value must be introduced into the equation, we replaced '+', '++' and '+++' from Table 1 by numerical values proportional to them.
Table 1. Main food types utilized by fish species from the Upper Paraná River and its floodplain (I=microcrustacea,
II= Mollusca, III=insect, IV=other invertebrates, V=fish, VI=algae, VII=plant, VIII=detritus, and IX=sediment). n is the number of investigated guts, No is the species number; frequency of occurrence of prey in the fish gut: + = >0 -30%; ++ = 31 a 60%; +++ = > 60%.
Family, Food types
No species n I II III IV V VI VII VIII IX
Potamotrigonidae
1 P.motoro 1 +++
Characidae
2 A.bimaculatus 200 + +++ + +++ + ++ +
3 A.lacustris 250 + +++ +
4 A.shubarti 293 + ++ + +++ +
5 B.orbignyanus 46 +++ + + ++
6 G.knerii 6 + +++
7 M.intermedia 10 +++ ++ + + +
8 R.paranensis 76 +++ +++ + +++
9 S.maxillosus 55 + +++ +
Serrasalmidae
10 P.mesopotamicus 18 + ++ + +++
11 S.marginatus 728 + + +++ +
12 S.spilopleura 172 + +++ +
Anostomidae
13 L.elongatus 11 +++ + +
14 L.friderici 129 ++ ++ +++ +
15 L.lacustris 48 + + + +++ +
16 L.obtusidens 125 + ++ + + +++ ++
17 L.vittatus 1 +++
18 S.altoparanae 96 +++ +++
19 S.borellii 230 + ++ ++ +++
Parodontidae
20 A.affinis 24 ++ ++ +++
Curimatidae
21 C.modesta 41 + +++ ++ +++
22 C.nagelii 148 + +++ ++ +++
23 S.insculpta 94 + +++ ++ +++
Prochilodontidae
24 P.lineatus 71 + + ++ +++
Erythrinidae
25 H.malabaricus 81 + + +++ +
Cynodontidae
26 R.vulpinus 138 + + +++ +
Gymnotidae
27 G.carapo 40 +++ + ++ + +
Sternopygidae
28 E.trilineata 279 + +++ + +++ +
Rhamphichthydae
29 R.rostratus 7 + +++
Doradidae
30 P.granulosus 176 + ++ + + + + +++ + +
31 T.paraguayensis 203 +++ ++ +++ + + +++ +
Auchenipteridae
32 A.nuchalis 66 + +++ + +
33 P.galeatus 244 +++ + ++ ++
Table 1 – cont.
Family, Food types
No species n I II III IV V VI VII VIII IX
Ageneiosidae
34 A.brevifilis 2 +++
35 A.ucayalensis 17 + ++ +++
36 A.valenciennesi 2 + + ++
Pimelodidae
37 H.platyrhynchos 90 + +++ +
38 I.labrosus 338 ++ ++ +++ +++ + ++ ++
39 P.corruscans 57 + +++ +
40 P.gracilis 6 + +++ + + +
41 P.luetkeni 1 +++
42 P.maculatus 300 + ++ ++ +++ +++ + ++ +
43 P.pirinampu 10 +++
44 Rhamdia sp. 2 +++
45 S.lima 22 ++ +++
Hypophthalmidae
46 H.edentatus 36 +++ + ++
Callichthyidae
47 C.callichthys 5 ++ ++ + ++ +
48 H.littorale 322 +++ + +++ ++ + +++ +
Loricariidae
49 Hypostomus sp. 15 + +++ +
50 L.platymetopon 116 ++ + + +++ ++
51 L.prolixa 9 + + +++ ++
52 Loricariichthys sp. 23 ++ + + +++ ++
53 M.aculeatus 7 + +++ ++
54 R.aspera 11 + + +++ ++
Sciaenidae
55 P.squamosissimus 206 ++ ++ +++ +
Soleidae
56 C.jenynsii 5 ++ +++
Cichlidae
57 C.ocellaris 5 +++
58 S.pappaterra 2 + + + + ++ +
Table 2. Similarity of food types (I-IX). Bold numbers signify the highest similarities used for fractional dendrite’s connections. Symbols explanations as in Table 1.
Food type
Food type I II III IV V VI VII VIII IX
I 100 12.82 25.00 31.75 7.20 14.75 11.25 24.36 10.45
II 100 9.78 11.32 5.77 9.52 14.04 12.31 11.11
III 100 29.63 21.66 7.63 26.96 24.19 11.02
IV 100 19.20 21.43 20.93 27.27 21.92
V 100 4.62 19.23 4.49 2.19
VI 100 13.75 28.57 46.15
VII 100 12.38 5.56
VIII 100 39.19
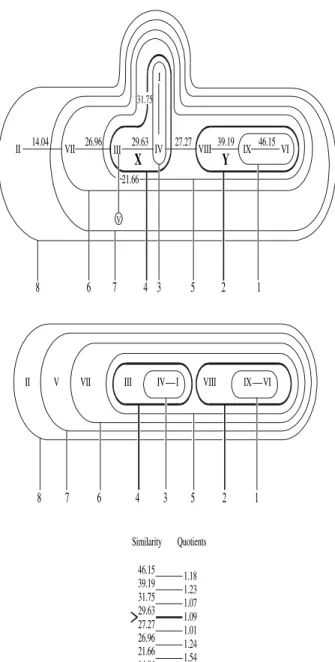
To transform a branched dendrite into a linear one, a technique of encircling groups of elements connected by decreasing similarity values was applied. The technique proceeded from the highest similarity (s = 46.15, circle no. 1) to the lowest one (s = 14.04, circle no. 8), which ensured against mistakes. Then, the linear dendrite was drawn starting from food types IX and VI, connected within circle no. 1, and ending by appending food type II within circle no. 8. This technique of proceeding from circle to circle was useful, because when transforming a branched dendrite into a linear one, weaker connections must be 'broken' to insert between respective food types, with similarities higher than those that have been 'broken away'. For example, food type I could be inserted between food types IV and VIII (similarity 27.27), but not between III and IV, because similarity between the latter pair was 29.63 (Fig. 2). More examples on how/where a dendrite may be 'broken' to insert elements with higher values of similarity are shown in Fig. 4.
Quotients calculated between decreasing similarities of neighbouring food types and fish species (Figs. 2 and 4), except the border ones, differed slightly between them and if a quotient differing from the neighbouring ones (Fig. 2: 1.09, Fig. 4: 1.07 and 1.05) happened to lie between their series, then its similarity (Fig. 2: 29.63, Fig. 4: 77.78 and 70.00) constituted the lower bound of similarity for distinguishing clusters (Romaniszyn, 1970). In the following analysis, all elements (food types, fish species) below that value of similarity have been treated separately.
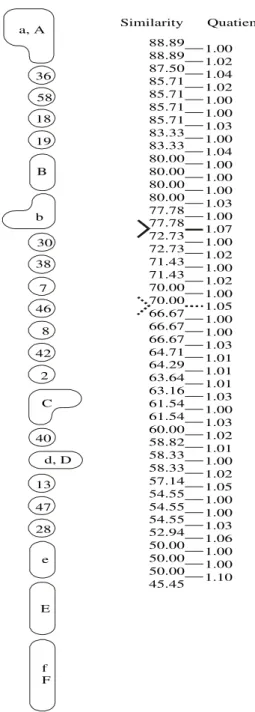
The dendrite for 58 species as well as a table with similarity values between fish species that was its source were too large to be presented here in their entirety. However, clusters and 'separate species' within them (quotient values 1.07 and 1.05) are presented in linear form (Fig. 3), as well as species compositions within single clusters (Fig. 4). According to Magurran (1988), a dendrogram of 30 elements or more could be difficult to interpret.
The lengths of lines connecting elements in Fig. 2 and 4 represented distance (1-s) rather than similarity.
II II
V
V VII VII
III III
IV IV
I I
14.04 26.96
21.66
29.63 27.27 39.19
31.75
46.15
Similarity Quotients
46.15 39.19 31.75 29.63 27.27 26.96 21.66 14.04
1.18 1.23 1.07 1.09 1.01 1.24 1.54
X Y
VIII VIII
IX IX
VI VI
8 8
7 7
6 6
5 5
4 4
3 3
2 2
1 1
Figure 2. The two-dimensional dendrite of food types
with two distinguished clusters of food types (X, Y) on the basis of a quotient 1.07 (similarity s ≥ 29.63). Circles numbered from 1 to 8, starting their drawing from the largest and ending with the lowest similarity value between food types, served for drawing the linear dendrite (below).
The linearly arranged dendrites of food types and fish species were used to derive a synthetic table (Romaniszyn, 1970), in which the plus and minus values were again used for symbolizing
items, i.e. as in the original table by Hahn et al
a, A 36 58 18 19 B b 30 38 7 46 8 42 2 C 40 d, D 13 47 28 e E f F 88.89 88.89 87.50 85.71 85.71 85.71 85.71 83.33 83.33 80.00 80.00 80.00 80.00 77.78 77.78 72.73 72.73 71.43 71.43 70.00 70.00 66.67 66.67 66.67 64.71 64.29 63.64 63.16 61.54 61.54 60.00 58.82 58.33 58.33 57.14 54.55 54.55 54.55 52.94 50.00 50.00 50.00 45.45 1.00 1.02 1.04 1.02 1.00 1.00 1.03 1.00 1.04 1.00 1.00 1.00 1.03 1.00 1.07 1.00 1.02 1.00 1.02 1.00 1.05 1.00 1.00 1.03 1.01 1.01 1.01 1.03 1.00 1.03 1.02 1.01 1.00 1.02 1.05 1.00 1.00 1.03 1.06 1.00 1.00 1.10 Similarity Quatients
Figure 3. Simplified pattern of a two-dimensional
dendrite, in which distinguished clusters and separated species are marked. Clusters of species were distinguished on the basis of two quotients, 1.07 and 1.05, representing similarities ≥ 77.78 and ≥ 70.00, respectively. All similarity indices and quotients from the two-dimensional dendrite are included in the picture.
RESULTS
Based on the linear composition of elements (food types and fish species), a synthetic table distinguished the following elements: species characterized by s = 100%, two types of clusters
of fish species (the stronger with s = 77.78% and a weaker one with s = 70.00%) and food type clusters with s = 29.63. As a result, the dendrite for fish species contained 6 'strong' clusters (A-F), 5 'weaker' ones (a-b, d-f) and 15 separate species. The dendrite for food types contained two clusters (X, Y), and 3 prey with no pronounced connections (Table 3).
Before starting the analysis of the synthetic table, some technical problems connected with the interpretation of the species' clusters have to be explained. Clusters distinguished by stronger (big letters) and weaker (small letters) similarity values either only border one another, or the 'weaker' clusters envelope the 'stronger' clusters. The former case occurred when s < 70.00%. Hence, clusters b and B as well as E and e were separated because their similarities were 63.64% and 61.54%, respectively. The latter case occurred between clusters a and A, d and D and f and F, because their similarities were 70.00% (Fig. 4).
The synthetic table (Table 3) enabled an easier interpretation of ecological information hidden in Table 1. At the beginning of Table 3, a large cluster of piscivores (A + a) is visible, yet fishes were consumed exclusively by five species, whereas the others also consumed: plants, insects and other invertebrates, but never food types I, VIII, IX and VI. In the connected clusters A + a (18 fish species), as many as nine families are represented, yet only one (Pimelodidae) is represented by six taxons, whereas the others are represented by 1-2 taxa. Moving down the table we also can see three species with frequent consumption (No. 8, 42 and 2) and five with intermediate (++) frequency of food consumption.
57, 44, 43, 41, 34 83.00
83.33
37, 39 85.71
85.71
26, 25, 11 85.75 12, 9, 3 77.78 55
56 6
10
48 31 50, 52 51, 54 53 49 24 20
4 14 15 30
27
21, 22, 23 16 2
1, 17
32 29
33 5
C
1 2
63.64
88.89 70.00
70.00
61.54
71.43
71.43 64.29
72.73 80.00
80.00 80.00
87.50 85.71 77.78 72.73
F f
E e
80.00
88.89
A
B
a
b D
d
45
35
Figure 4. Connections of fish species within the distinguished clusters marked with lines representing by their length
the distance definition (s-1). Arrows indicate the only feasible places of inserting fish species, always 'breaking' lower similarity values. Arrow no. 1 represents s = 6.54, arrow no. 2 s = 60.00. Solid line indicates a cluster distinguished for s ≥ 77.78, dotted line for s ≥ 70.00.
Except cluster D, with species consuming insects almost exclusively, the middle of the synthetic table is occupied by omnivores with species consuming insects almost exclusively. This part also includes: 1) individual taxa; 2) cluster B with a domination of plants in its diet; 3) cluster b encompassing the family Anostomidae, also with a domination of plants in its diet, but also consuming additionally fishes, insects and detritus; 4) cluster C, located near the center of the synthetic table, characterized by the domination of insects in its diet, with a
contribution of fish and plants; and 5) taxa from cluster D consume, with minor exceptions, insects.
At first sight, eight of nine food types distinguished in Table 3 were consumed with the highest frequency (+++) in the Paraná River floodplain. Because 57 of 58 fish species captured occurred in all sampled habitats (Hahn
et al, 1997), no attempt was made to examine
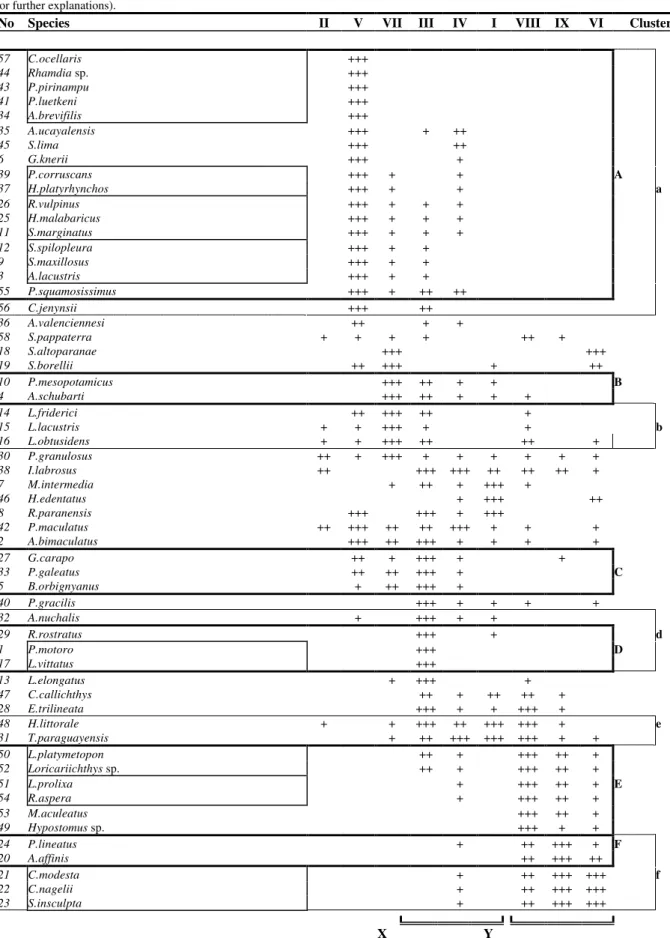
Table 3. Synthetic table showing ordered with the similarity coefficient (s) nine food types (I- IX) for 58 fish species in the Paraná river and its floodplain, according to prey frequency of occurrence in their guts. Clusters of species distinguished for s≥77.78% are marked by capital letters and surrounded with a solid line; for s>70.00%, by small letters and dotted line. The fish species names are framed when s is equal 100%. Clusters of food types distinguished for s≥29.63 are marked by capital letters (X,Y) and double line. Symbols explanations as in Table 1 (see text for further explanations).
No Species II V VII III IV I VIII IX VI Clusters
57 C.ocellaris +++
44 Rhamdia sp. +++
43 P.pirinampu +++
41 P.luetkeni +++
34 A.brevifilis +++
35 A.ucayalensis +++ + ++
45 S.lima +++ ++
6 G.knerii +++ +
39 P.corruscans +++ + + A
37 H.platyrhynchos +++ + + a
26 R.vulpinus +++ + + +
25 H.malabaricus +++ + + +
11 S.marginatus +++ + + +
12 S.spilopleura +++ + +
9 S.maxillosus +++ + +
3 A.lacustris +++ + +
55 P.squamosissimus +++ + ++ ++
56 C.jenynsii +++ ++
36 A.valenciennesi ++ + +
58 S.pappaterra + + + + ++ +
18 S.altoparanae +++ +++
19 S.borellii ++ +++ + ++
10 P.mesopotamicus +++ ++ + + B
4 A.schubarti +++ ++ + + +
14 L.friderici ++ +++ ++ +
15 L.lacustris + + +++ + + b
16 L.obtusidens + + +++ ++ ++ +
30 P.granulosus ++ + +++ + + + + + +
38 I.labrosus ++ +++ +++ ++ ++ ++ +
7 M.intermedia + ++ + +++ +
46 H.edentatus + +++ ++
8 R.paranensis +++ +++ + +++
42 P.maculatus ++ +++ ++ ++ +++ + + +
2 A.bimaculatus +++ ++ +++ + + + +
27 G.carapo ++ + +++ + +
33 P.galeatus ++ ++ +++ + C
5 B.orbignyanus + ++ +++ +
40 P.gracilis +++ + + + +
32 A.nuchalis + +++ + +
29 R.rostratus +++ + d
1 P.motoro +++ D
17 L.vittatus +++
13 L.elongatus + +++ +
47 C.callichthys ++ + ++ ++ +
28 E.trilineata +++ + + +++ +
48 H.littorale + + +++ ++ +++ +++ + e
31 T.paraguayensis + ++ +++ +++ +++ + +
50 L.platymetopon ++ + +++ ++ +
52 Loricariichthys sp. ++ + +++ ++ +
51 L.prolixa + +++ ++ + E
54 R.aspera + +++ ++ +
53 M.aculeatus +++ ++ +
49 Hypostomus sp. +++ + +
24 P.lineatus + ++ +++ + F
20 A.affinis ++ +++ ++
21 C.modesta + ++ +++ +++ f
22 C.nagelii + ++ +++ +++
23 S.insculpta + ++ +++ +++
DISCUSSION
More information can be read from Table 3 than
from Table 1. Table 1 contains the Hahn et al.,
(1997) 'frequency' data (i.e. how many species consume separately insects, fish, plants, algae, microcrustacea and mollusca). Table 3 separated some species that consumed some of these diet elements separately, yet it is clear that food types V, VIII, IX and VI constituting cluster Y, co-occurred with species clusters E, F and f with no exception.
Synthetic tables allow one to 1) distinguish species or clusters belonging to generalist, specialist or opportunist species (Gerking, 1994), 2) distinguish predatory, omnivorous and herbivorous species plus intermediate forms and outliers, and 3) determine the extent to which herbivorous species require sometimes small amounts of animal food (Kamler, 1992; Gerking, 1994). Our analysis suggested that a large majority of families have trophic specialists. Exceptions were the family Loricaridae, which formed cluster E, Curimatidae, (all of which entered cluster f), and a large group of pimelodids, belonging to piscivores.
The synthetic table has limitations also. For example, a food web shows consumer-resource interactions among a group of organisms, or aggregates trophic units, including their shifts in space and time (Winemiller & Polis, 1996), but Table 3 contains a composite of samples from various months. If similar tables were developed separately for fish samples from successive months, seasons or size groups, then temporal diet shifts could be discerned. Dietary variation in space also would be visible if data collected from different habitats were analysed as separate tables.
ACKNOWLEDGEMENTS
The authors wish to thank L. Glowacki (University of Lódz) for help in preparing the English version of the draft manuscript. We also thank NUPELIA (Universidade Estadual de Maringá, Paraná, CNPq) for financial assistance.
RESUMO
As freqüência de ocorrência de nove tipos de itens alimentares em estômagos de 58 espécies de peixes do rio Paraná e sua planície alagável são comparadas com base nas definições de similaridade. É proposta uma tabela sintética baseada nessas definições, com as espécies de peixes no eixo y e os tipos de alimento no eixo x, permitindo uma visualização mais clara de diversos tipos de informações sobre a ecologia alimentar de peixes na bacia. Entre as informações, destacam-se (i) quais espécies são generalistas, especialistas ou oportunistas; (ii) que espécies classificadas como herbívoras consomem também itens de origem animal; (iii) que os peixes consomem qualquer tipo de alimento que contenha energia; (iv) que a preferência alimentar depende das afinidades taxonômicas. A possibilidade de empregar tabelas sintéticas na investigação de variações espaciais e temporais na dieta de peixe é também indicada.
REFERENCES
Agostinho, A.A.; Bini, L.M.; Gomes, L.C. (1997), Ecologia de comunidade de peixes da área de influência do reservatório de Segredo. In- Reservatório de Segredo:bases ecológicas para o manejo, Eds. A.A. Agostinho & L.C.
Gomes, EDUEM, Maringá, PR, Brazil. pp.97-111 (in Portuguese)
Balon, E.K. & Stewart, D.J. (1983), Fish assemblages in a river with unusual gradient (Luongo, Africa - Zaire system), reflections on river zonation, and description of another
new species. Envir. Biol. Fish.,9, 225-252.
Diniz-Filho, J.A.F. & Bini, L.M. (1996), Assessing the relationship between multivariate community structure and
environmental variables. Mar. Ecol. Prog.
Ser.,143, 303-306.
Gerking, S.D. (1994), Feeding ecology of fish.
Academic Press, San Diego.
Hahn, N.S.; Andrian, I.F.; Fugi, R. & Almeida,
V.L.L. (1997), Ecologia trófica. In- A planície
Agostinho. & N.S. Hahn, EDUEM, Maringá, PR, Brazil. pp. 205-224 (in Portuguese). Hynes, H.B.N. (1950), The food of fresh-water
sticklebacks (Gasterosteus aculeatus and
Pygosteus pungitius), with a review of
methods used in studies of the food of fishes.
J. Anim. Ecol., 19: 36-58.
James, F.C. & McCulloch, C.E. (1990), Multivariate analysis in ecology and
systematics: panacea or Pandora's box. Ann.
Rev. Ecol. Syst.,21, 29-66.
Kamler, E. (1992), Early life history of fish: an
energetics approach. Chapman and Hall,
London.
Krebs, C. (1989), Ecological methodology.
Harper & Row, New York.
Magurran, A.E. (1988), Ecological Diversity and
its Measurement. Crom Helm, Sydney.
Marczewski, E. & Steinhaus, H. (1958), On a certain distance of sets and the corresponding
distance of function. Coll. Math.,6, 319-327.
Penczak, T. (1972), Structure of fish groupings in the rivers and streams of the Nida drainage
basin. Ekol. pol.,20, 327-344.
Penczak, T.; Forbes, I.; Coles, T.F.; Atkin, T. & Hill, T. (1991), Fish community structure in the rivers of Lincolnshire and South
Humberside, England. Hydrobiologia, 211,
1-9.
Penczak, T.; Agostinho, A.A. & Okada, E.K. (1994): Fish diversity and community structure in two small tributaries of the Paraná River, Paraná State, Brazil.
Hydrobiologia, 294, 243-251.
Przybylski, M.; Biro, P.; Zalewski, M.; Tatrai, I. & Frankiewicz, P. (1991), The structure of fish communities in streams of the northern part of the catchment area of Lake Balaton
(Hungary). Acta Hydrobiol.,33, 135-148.
Romaniszyn, W. (1970), An attempt at interpreting agglomerative tendencies of animals based on definition of similarity and
distance. Wiad. ekol., 16, 306-321.
Winemiller, K.O. & Leslie, M.A. (1992), Fish assemblages across a complex, tropical
freshwater/marine ecotone. Envir. Biol.
Fish.,34, 29-50.
Winemiller, K.O. & Polis, G.A. (1996), Food webs: what can they tell us about the world. In: Food webs: integration of patterns and dynamics, Eds. K.O. Winemiller & G.A.
Polis, Chapman and Hall, New York, pp. 1-22.
Witkowski, A. (1984), Structure of communities and biomass of ichthyofauna in the Biebrza
River, its old river beds and affluents. Pol.
ecol. Stud., 10, 447-474.
Zalewski, M.; Frankiewicz, P.; Przybylski, M.; Banbura, J. & Nowak, M. (1990), Structure and dynamics of fish communities in temperate rivers in relation to the
abiotic-biotic regulatory continuum concept. Pol.
Arch. Hydrobiol.,37, 151-176.