CONDITION FACTOR IN NINE SPECIES OF FISH OF THE
CHARACIDAE FAMILY IN THE UPPER PARANÁ RIVER
FLOODPLAIN, BRAZIL
LIZAMA, M. de los A. P. and AMBRÓSIO, A. M.
Programa de Pós-graduação em Ecologia de Ambientes Aquáticos Continentais, Universidade Estadual de Maringá, DBI/Nupélia, Avenida Colombo, 5790, Bloco G90, CEP 87020-900, Maringá, Paraná, Brazil Correspondence to: Maria de los Angeles P. Lizama, Universidade Estadual de Maringá, Avenida Colombo, 5790,
Bloco G90, CEP 87020-900, Maringá, Paraná, Brazil, e-mail: abrapoa@wnet.com.br Received March 14, 2000 – Accepted December 18, 2000 – Distributed February 28, 2002
(With 12 figures)
ABSTRACT
The condition factor for nine species of tropical freshwater fish of the Characidae family in the upper Paraná River floodplain is described. Fish were caught over a period of 12 months (February 1993 to March 1994). Knowledge of the nine species is important for adequate management and maintenance of the biological equilibrium of the ecosystem.
Key words: condition factor, Characidae, floodplain, Paraná River.
RESUMO
Estudo do fator de condição de nove espécies de peixes da família Characidae na planície de inundação do alto rio Paraná, Brasil
O fator de condição foi descrito para 9 espécies de peixes da família Characidae de água doce tropical na planície de inundação do alto rio Paraná. Os peixes foram capturados em um período de 12 meses (de fevereiro de 1993 a março de 1994). O conhecimento dessas nove espécies é extremamente im-portante para a obtenção de um adequado manejo e manutenção do equilíbrio biológico do ecossistema.
Palavras-chave: fator de condição, Characidae, planície de inundação, rio Paraná.
INTRODUCTION
Knowledge of quantitative aspects such as weight-length relationship, condition factor, growth, recruitment, and mortality of fishes is an important tool for the study of fishing biology, mainly when the species lies at the base of the higher food web. In fish, the factor of condition (K) reflects, through its variations, information on the phy-siological state of the fish in relation to its welfare. From a nutritional point of view, there is the accu-mulation of fat and gonadal development (Le Cren, 1951). From a reproductive point of view, the highest K values are reached in some species (Angelescu
et al.,1958). K also gives information when
com-paring two populations living in certain feeding, density, climate, and other conditions; when
deter-mining the period of gonadal maturation; and when following up the degree of feeding activity of a species to verify whether it is making good use of its feeding source (Weatherley, 1972).
The study of the condition factor is thus im-portant for understanding the life cycle of fish species and contributes to adequate management of these species and, therefore, to the maintenance of equilibrium in the ecosystem.
The aim of this research is to follow a series of investigations to understand the structure of the main foraging species of the floodplain. The condi-tion factor of 9 species of the Characidae family will be analyzed: Astyanax altiparanae Garutti &
callistus (Boulenger, 1900); Hemigrammus marginatus (Ellis, 1911); Moenkhausia intermedia
(Eigenmann, 1908); Moenkhausia sanctae-filomenae
(Steindachner, 1907) and Roeboides paranensis
(Pignalberi, 1975).
MATERIALS AND METHODS
Fishes were collected monthly from March 1993 to February 1994 in the floodplain of the upper Paraná River (Fig. 1) by 50 m long seining nets with 0.8 cm mesh (0.5 cm mesh in the bag) and by gillnets with different mesh sizes.
Astyanax altiparanae, A. schubarti and R. paranensis were the only ones to be caught in nets
with smaller mesh because they are small-sized species.
Fishes were identified at the species level. Total length (TL; cm), standard length (SL; cm),
and total weight (TW; g) were obtained. Data on sex and stage of gonadal immaturity in some indivi-duals were also obtained.
The value of b from the weight-length relation (Lizama et al., 1999), described in Table 1, was
employed in calculating the condition factor. Indivi-dual values of the condition factor were obtained through the formula K = TW/SLb. Monthly means
were calculated from individual values. Separation by sex was not possible and the grouped form was used.
Species data from a bibliographical survey were also employed. They deal with aspects on reproduction, feeding, and population structure in other environments. Such data were a help in un-derstanding species behavior.
The few data sampled on sex and stage of gonadal maturity somewhat elucidated hypotheses on the life cycle of these species.
Fig. 1— Area studied.
53º15’
53º30’
PORTO RICO CITY
PARANÁ STATE MATO GROSSO DO SUL
STATE
23º00’ 23º00’
22º45’ 22º45’
Baía
River
Direction of flux Field Station of the Nupélia
Legend
Collecting points Paraná
River Channel
Corutuba
10 km
Ivinheima
River
Ivinheima River
Floresta island
N
SOUTH AMERICA
BRAZIL
Paraná R.
Ivinheima
Patos Lagoon Paraná
TABLE 1
Weight/length relationship values of nine species in the floodplain of the upper Paraná River. (N = numbers of individuals used.)
TW/SL Relationship Species
N A b r
Astyanax altiparanae 1832 0.02348 3.13 0.94
Astyanax schubarti 662 0.0179 3.11 0.94
Aphyocharax nasutus 1393 0.0162 2.89 0.94
Cheirodon notomelas 755 0.0199 3.09 0.92
Hyphessobrycon callistus 1086 0.0183 3.10 0.90
Hemigramus marginatus 1712 0.0145 3.14 0.91
Moenkhausia intermedia 1641 0.0176 3.02 0.96
Moenkhausia sanctae-filomenae 295 0.0204 3.21 0.91
Roeboides paranensis 2287 0.0104 3.21 0.94
RESULTS AND DISCUSSION
The condition factor is an index reflecting interactions between biotic and abiotic factors in the physiological condition of fishes. It shows the population’s welfare during the various stages of the life cycle (Angelescu et al.,1958). In the case
of Puntius puntius (Bhatnagar, 1963) and Micropogonias furnieri (Vazzoler & Braga, 1983),
the condition factor decreases at the start of the spawning period due to very high metabolic rates. There is normally a gradual increase in the condi-tion factor during the reproductive period and normalization occurs immediately afterwards. Vazzoler & Vazzoler (1965) state that the condition factor does not merely reflect the feeding condition of the adult stage, but includes the state of gonadal development, based on the consumption of fat reserves during the spawning period. Similar results have been obtained by Martins-Juras (1980) for
M. furnieri.
Vazzoler & Braga (1983) showed that in
Cynoscion jamaicensis, there was a certain
cons-tancy in the condition factor values in relation to the length of mature specimens during a one-year period. Vazzoler & Vazzoler (1965) had already observed that in Sardinella brasiliensis this
cons-tancy did not exist, as the young extract of this species presented K values greater than those of the adult extract. Braga & Gennari Filho (1988)
revealed that the condition factor and the quantity of accumulated fat follow the rhythm of the re-productive process. At the start of this process, high values are the result of fat accumulation in the preceding phases; a gradual K decrease occurs together with decrease in fat (during this period the reproductive intensity is very low). Afterwards, there is a gradual increase in accumulated fat and K values, suggesting a preparatory span for a new reproductive period.
Employing body weight (total weight minus gonad weight), Braga & Gennari Filho (1990) showed that monthly values decreased at the highest reproductive level. This indicates that during this period the fish often does not feed, but uses lipid reserves necessary for spawning. The same authors stated that generally there is a decrease in feeding activity during the reproductive period, followed by a fall in the mean value of the condition factor and in the monthly percentage frequency of visceral fat accumulated during these months.
As for the condition factor of Astyanax altiparanae, K varies about 0.024. The lowest
Fig. 2— Monthly condition factor for nine Characidae species in the floodplain of the upper Paraná River. 0
0.008 0.016 0.024 0.032 0 0.04
K'
Mar/93
Mar/93
Mar/93
Mar/93
Mar/93
Mar/93
Mar/93
Mar/93
Mar/93 May
May
May
May
May
May
May
May
May J ul
J ul
J ul
J ul
J ul
J ul
J ul
J ul
J ul Sep
Sep
Sep
Sep
Sep
Sep
Sep
Sep
Sep Nov
Nov
Nov
Nov
Nov
Nov
Nov
Nov
Nov J an/94
J an/94
J an/94
J an/94
J an/94
J an/94
J an/94
J an/94
J an/94 A. altiparanae
0.010 0.012 0.014 0.016 0.018 0.020
K'
A. nasutus
0.015 0,017 0.019 0.021 0.023
K'
C. notomelas A. schubarti
0.020 0.022 0.024 0.026 0.028 0.030 0.032
K'
0.016 0.018 0.020 0.022 0.024 0.026
K'
H. callistus
0 0.005 0.010 0.015 0.020
H. marginatus
0.016 0.020 0.024 0.028 0.032
K'
M. intermedia
0.01 0.015 0.02 0.025 0.03
K
K
'
'
M. sanctae-filomenae
0 0.01 0.011 0.012 0.013 0.014
K'
Figueiredo-Garuti & Garuti (1991) observed that the species has three reproductive periods: August/September, November/January, and March. They also state that the lowest K value occurs in
the beginning of the reproductive period and the highest at its end. Fig. 3 shows that the species recruits throughout the year, which corresponds to results mentioned above.
Fig. 3— Length frequency distribution of Astyanax altiparanae in the floodplain of the upper Paraná River.
Aphyocharax nasutus has a monthly variation
in K values similar to that of the genus Astyanax.
The lowest value occurs in August, probably during the recovery period of the species. Condition value increases in September and oscillates around 0.014, which may indicate the start of the reproductive period. The highest K value occurs in April (Fig. 2), possibly explaining why only one individual was captured during the month. Results may be confirmed from Fig. 4 which shows that intro-duction of juveniles occurred between May and June, but starting from August.
Results similar to those of the present authors were obtained for Astyanax schubarti by Rodrigues
et al. (1995). Since the species has its highest
condition factor in December-January, it has been suggested that specimens develop and prepare for reproduction during this period. According to these authors, the species has annual and parceled spaw-ning with continuous recruitment of juveniles. Results shown in Fig. 5 are not so clear on this point when compared with those of Rodrigues et al. (1995), which may be explained if one considers
that the population is essentially composed of juveniles (only 3.2% of sampled individuals with lengths greater than those of L50).
During the whole year, Cheirodon notomelas
presented low K values. The highest values oc-March/93
0 10 20 30 40 50 60 70
April May
June
0 10 20 30 40 50 60
70 July August
September
0 10 20 30 40 50 60 70
December
Frequency
(%)
0 10 20 30 40 50 60 70
October
January/94
November
February
1.8 2.6 3.4 4.2 5 5.8 6.6 7.4 8.2 9 9.8 10.6 11.4
Length class (cm)
A. altiparanae
curred in October (Fig. 2). This suggests that during this period the species would be prepared for reproduction, but would probably spawn throu-ghout the whole year as well, as perhaps confirmed by the monthly length frequency distribution (Fig. 6) showing that the shorter specimens are intro-duced into the environment starting in April.
Hyphessobrycon callistus presented
increa-sing K values throughout the whole year. The lowest values occurred between May and July (especially the latter), possibly signaling the end of the reproductive period. From July on, K in-creased until October and oscillated until Fe-bruary. The highest value occurred in January (Fig. 2), the period of probable spawning peak. Fig. 7 corroborates this, since it shows the intro-duction of first length classes in February and suggests recruitment of juveniles in the floodplain. The absence of specimens in March and April
may be explained by sampling problems or be-cause of some biotic or abiotic factor. Starting from May, the first length classes of this species may already be found, perhaps a standard for these Characid species.
Concerning Hemigrammus marginatus, the
lowest value of the condition factor occurs in Au-gust and may mean the end of the reproductive period. From September, the K value gradually increases, reaching its highest value in November (Fig. 2). This indicates that the species is prepared for reproduction sometime before that period (Au-gust). It should be emphasized that during the other months the K value remained constant with only slight variation. Although no specimen was caught between March-April and January, Fig. 8 shows the presence of the smallest length classes, espe-cially from May to August, supposedly a spawning period, too.
Fig. 4 — Length frequency distribution of Aphyocharax nasutus in the floodplain of the upper Paraná River.
100
0
0
0
0 100
100
100 20
20
20
20 40
40
40
40 60
60
60
60 80
80
80
80
1.4 1.7 2 2.3 2.6 2.9 3.23.5 3.84.14.4 1.4 1.7 2 2.3 2.6 2.93.23.5 3.8 4.14.4 1.4 1.7 2 2.3 2.6 2.93.23.5 3.8 4.14.4 A. nasutus
March/93 April May
June July August
September
December
Frequency
(%)
October
January/94
November
February
Fig. 5 — Length frequency distribution of Astyanax schubarti in the floodplain of the upper Paraná River.
Fig. 6 — Length frequency distribution of Cheirodon notomelas in the floodplain of the upper Paraná River.
0
0
0
0 100
100
100
100 20
20
20
20 40
40
40
40 60
60
60
60 80
80
80
80
2.32.83.33.84.34.85.35.86.36.87.3 2.32.83.33.84.34.85.35.86.36.87.3 2.32.83.33.84.34.85.35.86.36.87.3
A. schubarti
March/93 April May
June July August
September
December
Frequency
(%)
October
January/94
November
February
Length class (cm)
C. notomelas
0 0 0 0
30 30 30 30
50 50 50 50
20 20 20 20
40 40 40 40
60 60 60 60
10 10 10 10
11.21.41.61.8 22.22.42.62.8 33.23.4 11.21.41.61.822.22.42.62.83 3.23.4 11.21.41.61.8 22.22.42.62.833.23.4
March/93 April May
June July August
September
December
Frequency
(%)
October
January/94
November
February
Fig. 7 — Length frequency distribution of Hyphessobrycon callistus in the floodplain of the upper Paraná River.
Fig. 8— Length frequency distribution of Hemigrammus marginatus in the floodplain the upper Paraná River.
0
0
0
0 30
30
30
30 50
50
50
50 20
20
20
20 40
40
40
40 60
60
60
60 10
10
10
10
H. callistus
1.1 1.7 2.3 2.9 3.5 4.1 4.7 1.1 1.7 2.3 2.9 3.5 4.1 4.7 1.1 1.7 2.3 2.9 3.5 4.1 4.7
March/93 April May
June July August
September
December
Frequency
(%)
October
January/94
November
February
Length class (cm)
0 0
0
0 10 10
10
10 20 20
20
20 30 30
30
30 40 40
40
40 50 50
50
50 60 60
60
60 70 70
70
70
1.11.41.72.02.32.62.93.23.53.84.1 1.11.41.72.02.32.62.93.23.53.84.1 1.11.41.72.02.32.62.93.2 3.53.84.1 H. marginatus
March/93 April May
June July August
September
December
Frequency
(%)
October
January/94
November
February
Rodrigues et al. (1991) stated that in the case
of Moenkhausia intermedia, the species has the same
spawning type as that of Astyanax altiparanae, with
higher spawning intensity in October and November. Monthly condition factors show that values oscillate throughout the year (Fig. 2). Values are lowest between July and September, mainly in August. In these months, the species ends a reproductive term. The condition factor increases starting from September (the reproductive period is resumed), reaching its highest values in February and March. Results agree with data from Vazzoler (1996) and Rodrigues et al. (1991). Fig. 9 shows that entrance
of recruits occurs practically throughout the year. Braga & Gennari Filho (1990) state that the species has two spawning peaks.
Moenkhausia sanctae-filomenae has the
low-est K values in January and highlow-est in June (Fig. 2). Fig. 10 shows results with an introduction of recruits during May and low frequency in Sep-tember and February, even though individuals with less than 2.1 cm were not caught in the dragnets. Results suggest that the species spawns between September and June, i.e., between the months in which values of the condition factor are highest.
Concerning Roeboides paranensis, values of
the monthly condition factor (Fig. 2) suggest that those of the species are highest between January and March (highest in March). During this period, spawning occurs. With lowest K values between June and August, it seems likely that individuals would be recovering from the previous spawning. Fig. 11 shows individuals in all length classes during the year, suggesting continuous recruitment in the area under analysis.
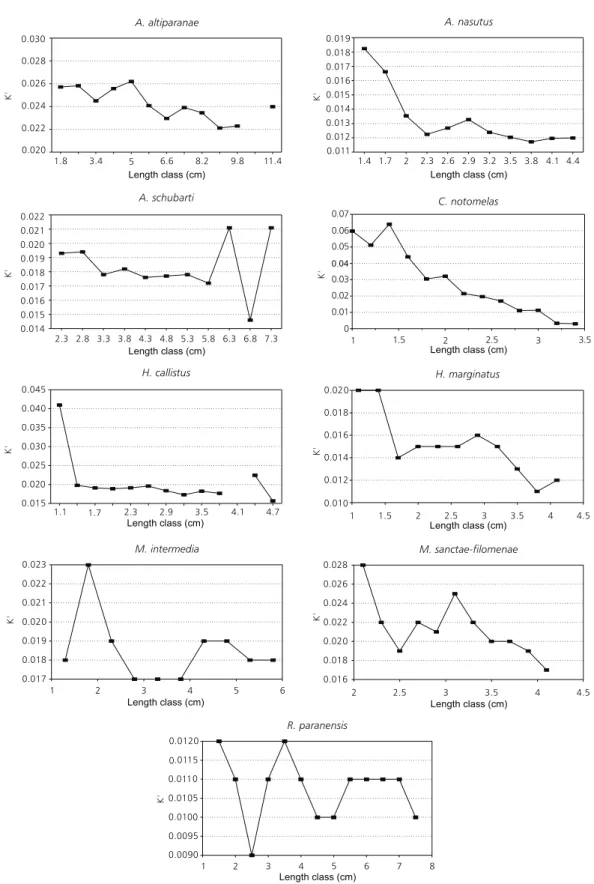
In the case of the condition factor per length class (Fig. 12), the present authors affirm that, as a general rule, the highest values of the condition factor occur in the lowest lengths, or rather, in the juvenile classes. Vazzoler (1996) confirmed that lowest K values during the more developed gonadal stages may mean resource transfer to the gonads during the reproductive period. Braga (1986), through other authors, showed that values of the condition factor vary according to seasons and are influenced by environmental conditions. The same may be occurring in the environment under study since the floodplain is influenced by many biotic and abiotic factors, which favor the equilibrium of all the species in the ecosystem.
Fig. 9 — Length frequency distribution of Moenkhausia intermedia in the floodplain the upper Paraná River.
M. intermedia
0
0
0
0 30
30
30
30 50
50
50
50 20
20
20
20 40
40
40
40 60
60
60
60 10
10
10
10
1.3 1.8 2.3 2.8 3.3 3.8 4.3 4.8 5.3 5.86.36.8 1.31.82.32.83.33.84.34.85.35,86.36.8 1.31.82.32.83.33.84.34.85.35.86.36.8
March/93 April May
June July August
September
December
Frequency
(%)
October
January/94
November
February
Fig. 10 — Length frequency distribution of Moenkhausia sanctae-filomenae in the floodplain of the upper Paraná River.
Fig. 11— Length frequency distribution of Roeboides paranensis in the floodplain of the upper Paraná River.
2.1 2.3 2.5 2.7 2.9 3.1 3.3 3.5 3.7 3.9 4.1 2.1 2.3 2.5 2.7 2.9 3.1 3.3 3.5 3.7 3.9 4.1 2.1 2.3 2.5 2.7 2.9 3.1 3.3 3.5 3.7 3.9 4.1 0
0 0 0
100 100 100 100
20 20 20 20
40 40 40 40
60 60 60 60
80 80 80 80
M. sanctae-filomenae
March/93 April May
June July August
September
December
Frequency
(%)
October
January/94
November
February
Length class (cm)
0 10 20 30
15 25
5
0 10 20 30
15 25
5
0 10 20 30
15 25
5
0 10 20 30
15 25
5
1.5 2 2.5 3 3.5 4 4.5 5 5.5 6 6.5 7 7.5 1.5 2 2.533.5 4 4.5 5 5.5 6 6.5 7 7.5 1.5 2 2.533.5 4 4.5 5 5.5 6 6.5 7 7.5 R. paranensis
March/93 April May
June July August
September
December
Frequency
(%)
October
January/94
November
February
Fig. 12 — Condition factor per length class for the nine Characidae species in the floodplain of the upper Paraná River. 0.020
0.022 0.024 0.026 0.028 0.030
K'
1.8 3.4 5 6.6 8.2 9.8 11.4
Length class (cm)
Length class (cm)
Length class (cm) Length class (cm)
Length class (cm) Length class (cm)
Length class (cm)
Length class (cm) Length class (cm) 0.011
0.012 0.013 0.014 0.015 0.016 0.017 0.018 0 019
K'
1.4 1.7 2 2.3 2.6 2.9 3.2 3.5 3.8 4.1 4.4 A. nasutus
0.014 0.015 0.016 0.017 0.018 0.019 0.020 0.021 0.022
K
'
2.3 2.8 3.3 3.8 4.3 4.8 5.3 5.8 6.3 6.8 7.3 0 0.01 0.02 0.03 . 0 04 0.05 0.06 0.07
K'
1 1.5 2 2.5 3 3.5
0.015 0.020 0.025 0.030 0.035
. 0040 0.045
K
K
'
'
1.1 1.7 2.3 2.9 3.5 4.1 4.7
0.012 0.014 0.016 0.018
0.010 0.020
K
K
K
'
'
'
1 1.5 2 2.5 3 3.5 4 4.5
0.017 0.018 0.019 0 0.02 0.021 0.022 0.023
1 2 3 4 5 6 0.016
0.018 0.020 0.022 0.024 0.026 0.028
2 2.5 3 3.5 4 4.5
0
0 0.009 0.0095
1 2 3 4 5 6 7 8
00 0.01 0.0105 0.011 0.0115 0.0120
C. notomelas A. schubarti
H. callistus H. marginatus
M. intermedia M. sanctae-filomenae
R. paranensis A. altiparanae
GENERAL CONSIDERATIONS
Data on the characid species of the upper Paraná River floodplain show that almost all have prolonged spawning and that recruitment occurs practically throughout the year in this environment. The authors suppose that juveniles of these species have a higher condition factor than mature ones. This has already been observed in studies of va-rious species of marine fish along the Brazilian coast. One may conclude that these foraging species are extremely well adapted to their environment and perform an important role in the trophic ba-lance of this ecosystem.
Acknowledgments — Thanks are due to the PADCT/CIAMB/ UEM program for support this research and to the Research Nucleus in Limnology, Ichthyology and Aquaculture (NUPELIA) of the State University of Maringá for logistic help and infrastructure.
REFERENCES
ANGELESCU, V., GNERI, F. S. & NANI, A., 1958, La mer-luza del mar argentino (biologia e taxonomia). Secr. Mar. Serv. Hidrog. Nav. Publico, H1004: 1-224.
BHATNAGAR, G. K, 1963, On some aspects of the biology of Pontius kolus (Sykes) of the Tungabhadra Reservoir.
Indian J. Fish., 10(2): 500-520.
BRAGA, F. M. S., 1986, Estudo entre o fator de condição e relação peso/comprimento para alguns peixes marinhos.
Rev. Brasil. Biol., 46(2): 339-346.
BRAGA, F. M. dos S. & GENNARI FILHO, 1990, Contribui-ção para o conhecimento da reproduContribui-ção de Moenkhausia intermedia (Characidae, Tetragonopterinae), na represa
de Barra Bonita, rio Piracicaba, São Paulo. Naturalia,
15: 171-188.
BRAGA, F. M. dos S. & GENNARI FILHO, 1991, Estudos sobre a fecundidade, desova e mortalidade natural de
Moenkhausia intermedia (Characidae, Tetragonopterinae), na represa de Barra Bonita, rio Piracicaba, São Paulo,
Naturalia, 16: 55-68.
FIGUEIREDO-GARUTI, M. L. & GARUTI, V., 1991, Fator de condição total e fator de condição somático para fê-meas de Astyanax bimaculatus (Pisces, Characidae), pro-cedentes da região noroeste do Estado de São Paulo, Ba-cia do rio Paraná. In: IX Encontro Brasileiro de Ictiologia, p. 62.
LE CREN, E. D., 1951, The length-weight relationship and seasonal cycle in gonad weight and condition in the perch Perca fluviatilis. J. Anim. Ecol., 20(2): 201-219. LIZAMA, M. de los A. P., AMBRÓSIO, A. M. & VAZZOLER,
A. E. A. de M., 1999, Relação peso-comprimento e estru-tura da população de nove espécies da família Characidae na planície de inundação do alto rio Paraná, Brasil. Rev. Bras. Zool., 16(3): 779-788.
MARTINS-JURAS, I. A. G., 1980, Estudo sobre o crescimento de Macrodon ancylodon (Bloch & Schneider, 1801) cap-turada nas costas do Rio Grande do Sul (Latitude 29oS
a 32oS).Dissertação de Mestrado, Universidade de São
Paulo, Instituto Oceanográfico, 182p.
RODRIGUES, A. M., SANTOS, R. A. dos, CAMPOS, E. C., DA CÂMARA, J. J. C. & MANDELLI, J. Jr., 1991, Tipo de desova e fecundidade de Moenkhausia intermedia
(Eigenmann, 1908), na represa de Ibitinga, Estado de São Paulo, Brasil. Braz. J. Vet. Res. Anim. Sci., 28(2): 201-206. RODRIGUES, A. M., SANTOS, R. A. dos, GIAMAS, M. T. D., CAMPOS, E. C. & CAMARA, J. J. C. da, 1995, Tipo de desova e fecundidade do lambari prata Astyanax schubarti Britski, 1964 (Pisces, Characiformes, Characi-dae), na represa de Ibitinga, Estado de São Paulo, Brasil.
Bol. Inst. Pesca, 22(1): 133-139.
VAZZOLER, A. E. A. de M., 1996, Biologia da reprodução de peixes teleósteos: teoria e prática. EDUEM, SBI, Maringá, 169p.
VAZZOLER, A. E. A. de M. & BRAGA, F. M. S., 1983, Con-tribuição para o conhecimento da biologia de Cynoscion jamaicensis (Vaillant & Bocourt, 1883), na área entre Cabo de São Tomé (22o04’S) e Torres (29o21’S), Brasil. Bolm
Inst. Oceanogr., 32(2): 125-136.
VAZZOLER, A. E. A. de M. & VAZZOLER, G., 1965, Re-lation between condition factor and sexual development in Sardinella aurita (Cuv. & Val. 1847). Anais Acad. Bras. Ciênc., 37(supl.): 353-359.