I
João Miguel dos Santos Ribeiro
Bachelor of Sciencie in Biology
Two-Phase Acid/Gas Anaerobic Reactor for
Industrial Wastewater of Food & Drink SME
Industries
Dissertation to obtain the degree of Master in Biotechnology
Supervisor: Mónica Isabel Gonçalves Carvalheira, PhD,
FCT/UNL
Co-supervisor: Joana Sofia Cassidy, PhD, FCT/UNL
Jury:
President: Prof. Dr. Pedro Miguel Ribeiro Viana Baptista, FCT/UNL Examiner: Prof. Dr. Leonor Miranda Monteiro do Amaral, FCT/UNL
Dr. Mónica Isabel Gonçalves Carvalheira, FCT/UNL
II Copyright João Miguel dos Santos Ribeiro, FCT/UNL, UNL
III
Acknowledgements
Com enorme alegria agradeço em especial à minha orientadora, Dr. Mónica Carvalheira, porque desde o inicio e até terminar este estudo ensinou-me diversas formas de trabalhar e de raciocínios, tendo sido a sua orientação, essencial para a minha evolução como investigador.
Agradeço muito, à minha co-orientadora, Dr. Joana Cassidy, devido a sua presença assídua ao orientar, que foi de enorme importância para a realização desta dissertação.
Obrigado também ao Dr. Christophe Roca.
Um enorme obrigado da minha parte, a vossa orientação foi fundamental!
Por serem a minha força e motivação, agradeço aos meus pais. Sem eles não estava onde estou.
Avó, avô e tio agradeço mais uma vez por tudo o que fizeram por mim.
À minha namorada, muito obrigado pelo enorme carinho e suporte que me deu até agora.
Aos meus amigos, pelas alegrias e os momentos de diversão, são os maiores! Especial ao Vieira pelos desenhos dos reactores!
Por fim agradeço ao grupo BioEng, por me ter recebido com uma gigante simpatia.
IV
Abstract
Food and beverage wastes are rich in organic material such as carbohydrates, proteins, oils, fats, sugars and others. Those high levels of organic material translate in high amounts of chemical oxygen demand (COD) and biochemical oxygen demand (BOD) which cause several pollutions problems, such as water quality degradation and air pollution. Anaerobic digestion (AD) appears as a great solution given its ability to treat and convert organic matter into biogas.
The current objective is to use a two-phase AD to treat wastes from juice (apple pulp) and winery industry (winery waste with grape concentrated (WWGC)) in order to convert as much COD into biogas. For this, several operational conditions were studied.
Firstly, biogas was produced when treating waste apple pulp. The best conditions for the acidogenic phase were: Organic loading rate (OLR) of 35.05±2.30 g COD/(L.day); Hydraulic retention time (HRT) of 1 day; T 30ºC; pH of 5.45. The yield in terms of VFAs conversion from sugar was 0.46 g ΔVFA COD/g sugar COD. For the methanogenic phase, the best conditions studied were: OLR of 7.26±0.38 g COD/(L.day); HRT of 2.5 days; T 37ºC; pH of 7.5. The methane yield achieved was 0.32±0.03 L CH4/g COD.
Secondly, WWGC was treated using the two-phase AD producing biogas. In the acidogenic phase, the optimum conditions were: OLR of 23.20±6.51 g COD/(L.day); HRT of 1 day; T 30ºC; pH of 5.45. The yield of VFAs conversion was 0.50±0.23 g ΔVFA COD/g sugar COD. In the methanogenic phase, the highest methane yield achieved was 0.34±0.03 L CH4/g COD with the following conditions: Organic loading rate of 9.70±0.81 g COD/(L.day); HRT of 2 days; T 30ºC; pH of 7.5.
Optimization of the operational conditions lead to a better performance of the two-phase AD process when treating both wastes tested. A significant COD removal and a high methane yield were achieved for both wastes.
V
Resumo
Resíduos alimentares e de bebidas são compostos maioritariamente por matéria orgânica, como carbohidratos, proteínas, óleos, açúcares, entre outros. Esses níveis elevados de matéria orgânica correspondem a altas quantidades de carência química de oxigénio (CQO) e carência bioquímica de oxigénio (CBO) que causam diversos problemas de poluição, como por exemplo a diminuição da qualidade de águas e o aumento poluição atmosférica. A digestão anaeróbia surge como uma ótima solução devido à sua habilidade de tratar e converter matéria orgânica em biogás.
O objetivo deste estudo é utilizar a digestão anaeróbia em duas fases para tratar resíduos provenientes da indústria de sumos (polpa de maçã) e de vinho (resíduos de vinho com concentrado de uva (RVCU)) com o intuito de converter o máximo de CQO possível em biogás. Assim, várias condições de operação foram estudas.
Inicialmente, o biogás foi produzido durante o tratamento dos resíduos de polpa de maçã. As melhores condições de operação obtidas para a fase acidogénica foram: Carga orgânica de 35.05±2.30 g CQO/(L.dia); Tempo de retenção hidráulico (TRH) de 1 dia; T 30ºC; pH de 5.45. O rendimento em relação à conversão de açúcar em VFAs foi 0.46 g ΔVFA CQO/g açúcar CQO. Para a fase metanogénica, a melhores condição obtidas foram: carga orgânica de 7.26±0.38 g CQO/(L.dia); TRH de 2.5 dias; Tº 37ºC; pH de 7.5. O rendimento em metano foi 0.32±0.03 L CH4/g CQO.
No tratamento de RVCU através da digestão anaeróbia de duas fases foi também observado uma produção de biogás. Na fase acidogénica, as melhores condições obtidas foram: carga orgânica de 23.20±6.51 g CQO/(L.dia); TRH de 1 dia; T 30ºC; pH 5.45. O rendimento de VFAS foi 0.50±0.23 g
ΔVFA CQO/g açúcar CQO. Na fase metanogénica o rendimento máximo foi de 0.34±0.03 L CH4/g CQO com as seguintes condições: carga orgânica de 9.70±0.81 g CQO/(L.dia); TRH de 2 dias; T 30ºC; pH de 7.5.
A otimização das condições de operação levou a um melhor desempenho da digestão anaeróbia em duas-fases para ambos os resíduos testados. Foi possível uma remoção significativa de CQO e foram atingidos elevados rendimentos de metano para ambos os resíduos.
VI
Contents
1. Introduction ... 1
1.1 Problem statement ... 1
1.2 Anaerobic digestion biotechnology ... 2
1.2.1 Hydrolysis phase ... 3
1.2.2 Acidogenesis ... 3
1.2.3 Acetogenesis phase ... 4
1.2.4 Methanogenesis phase ... 4
1.3 Sulphate reducing bacteria in anaerobic digestion ... 5
1.4 Environmental conditions ... 5
1.4.1 Organic loading rate and hydraulic retention time ... 6
1.4.2 Temperature ranges ... 6
1.4.3 pH and alkalinity ranges ... 7
1.4.4 Nutrients ... 7
1.5 Two-phases anaerobic digestion ... 8
1.6 The main objective ... 9
2. Methods and materials ... 11
2.1 5-Litres two-phase anaerobic reactor setup ... 11
2.2 Bioreactor inoculum and reactor start-up ... 11
2.2.1 Acidogenic phase with apple pulp waste ... 11
2.2.2 Methanogenic phase with apple pulp waste ... 12
2.2.3 Acidogenic phase with Winery Waste with Grape Concentrated (WWGC) ... 12
2.2.4 Methanogenic phase with WWGC ... 12
2.3 Influents (real wastes) ... 12
2.3.1 Acidogenic reactor... 12
2.3.2 Methanogenic reactor ... 13
2.4 Biogas flow rate and composition ... 14
2.4.1 Acidogenic and methanogenic phase ... 14
2.5 Operational conditions ... 14
2.5.1 Acidogenic phase with apple pulp waste ... 14
2.5.2 Methanogenic phase with apple pulp waste ... 15
2.5.3 Acidogenic phase with WWGC ... 16
2.5.4 Methanogenic phase with WWGC ... 16
2.6 Analytics methods ... 17
2.6.1 Chemical oxygen demand (COD) ... 17
2.6.2 Volatile Fatty acids and ethanol ... 17
2.6.3 Ammonium and phosphorus ... 18
2.6.4 Sugar ... 18
VII
2.6.6 Total suspended solids and Volatile suspended solids ... 18
2.6.7 Sulphide ... 19
2.7 Parameters calculation ... 19
3. Results and discussion ... 21
3.1 Performance of the acidogenic bioreactor with apple pulp waste ... 21
3.1.1 Organic matter conversion ... 21
3.1.2 Ammonium and phosphorus ... 24
3.1.3 Total suspended solids (TSS) and Volatile suspended solids (VSS) ... 25
3.1.4 Gas composition... 26
3.2 Methanogenic reactor with apple pulp waste ... 27
3.2.1 Organic matter conversion ... 27
3.2.2 Ammonium and phosphorus ... 28
3.2.3 Total suspended solids and Volatile suspended solids ... 29
3.2.4 Biogas composition ... 30
3.2.5 Yield and productivity ... 31
3.3 Acidogenic reactor with WWGC ... 33
3.3.1 Organic matter conversion ... 33
3.3.2 Ammonium and phosphorus ... 35
3.3.3 Total suspended solids and Volatile suspended solids ... 36
3.3.4 Gas composition... 37
3.4 Methanogenic reactor with WWGC ... 38
3.4.1 Organic matter conversion ... 38
3.4.2 Ammonium and phosphorus ... 40
3.4.3 Total suspended solids and Volatile suspended solids ... 41
3.4.4 Sulphides ... 42
3.4.5 Biogas composition ... 42
3.4.6 Biogas yield and productivity ... 43
3.4.7 Two-phase AD comparison: pulp fruit waste vs. WWGC vs. literature ... 44
4. Conclusion ... 47
5. Future work ... 49
VIII
List of figures
XI
List of tables
Table 1.1 – Extracellular hydrolyses, their spectrum of action and its products (adapted from Gerardi
2007) ... 3
Table 1.2- Genus of acetate-removing methanogens and possible substrates (adapted from Wong and Chu 2003)... 4
Table 1.3- Genus of hydrogen-removing methanogens and possible substrates (adapted from Wong and Chu 2003). ... 5
Table 2.1 – Conditions imposed during acidogenic phase with apple pulp waste. ... 15
Table 2.2- Conditions imposed during methanogenic phase with apple pulp waste. ... 15
Table 2.3- Conditions imposed during acidogenic phase with WWGC. ... 16
Table 2.4- Conditions imposed during methanogenic phase with WWGC. ... 17
Table 3.1 – Conversion of CODtotal_inin VFAs (%), yield of ΔVFAs per sugar CODtotal_in and productivity of VFAs in all periods of acidogenic phase with apple pulp waste (I, II, III, IV and V). ... 24
Table 3.2- Averages of yield and productivity of methanogenic phase with apple pulp waste for each operational period. ... 32
Table 3.3 - Conversion of CODtotal_in in VFAs(%), Yield of ΔVFAs per CODsugar and productivity of VFAs in all periods of acidogenic phase with WWGC (I, II, III and IV). ... 35
Table 3.4- Averages of yield and productivity of methanogenic phase with WWGC in each period. ... 44
Table 3.5- Comparison of both AD operations in this study in terms of OLR and methanogenic CODsoluble. ... 45
XII
Abbreviations
AD- Anaerobic digestion
COD- Chemical oxygen demand CSTR- Continuously stirred tank reactor GC- Gas chromatography
HPLC- High-performance liquid chromatography HRT- Hydraulic retention time
OLR- Organic loading rates SBR- Sulphate-reducing bacteria TSS- Total suspended solids VFAs- Volatile fatty acids VSS- Volatile suspended solids
WFD- European Waste Frame Directive
1
1. Introduction
1.1 Problem statement
The agro-industry produces high quantities of solid, liquid and gaseous wastes. Their composition varies according to the source of raw material, the operation and processing methods (Prasertsan et al. 2007). According to the European Waste Framework Directive (WFD), between 2004 and 2012, 28 countries generated 598 830 000 tonnes of animal and vegetal wastes, and Portugal alone produced 5 248 704 tonnes of animal and vegetal wastes.
Food wastes are rich in organic material such as carbohydrates, proteins, oils, fats, sugars and others. Those high levels of organic material translate in high amounts of Chemical Oxygen Demand (COD) and Biochemical oxygen demand (BOD) which cause several pollutions problems, such as water quality degradation and air pollution (Woodard and Curran, Inc 2006; Prasertsan et al. 2007). Due to these negative impacts, agro-industries wastes must be managed and processed in order to achieve the quality required by the regulatory standards.
In addition, the development of a renewable resource of energy and products (e.g. waste valorisation for biogas and biopolymers) is needed due to assist in preventing global warming, in population growth, in reducing economic costs associated with waste treatment and disposal (Liguori et al. 2013). Thus, it is necessary to change or adapt the conventional disposal and treatment of wastes and by-products, such as waste incineration which release high emissions of greenhouse gases and volatile organic compounds into the atmosphere or landfills where toxic leachates are produced and may be released in groundwater if not treated.
A good alternative might be to resort to biorefineries. The latter involve different types of processes: thermochemical, chemical, enzymatic and biological conversions (de Jong and Jungmeier 2015). In biological conversions, the treatment of organic wastes occurs through anaerobic and aerobic digestion. Aerobic digestion converts 50-60% of the carbon source into carbon dioxide and 40-50% into renewable microbial biomass, while anaerobic digestion can convert 95% of the carbon source into biogas (methane and carbon dioxide) and the rest into biomass (Parawira 2004). This two biological process can be functionalized in separated or combined, sequential or integrated, for example on treatment of azote dye-contaminating wastewater (Van Der Zee and Villaverde 2005). As agro-industrial wastes are rich in carbon source and nutrients essential for the development of microorganisms, biological treatments can be a sustainable, economic and ecological option for industries (Liguori et al. 2013).
2 (Parawira 2004). Anaerobic digestion is best suited in the treatment of waste streams with high organic load sand complex wastes which cannot be treated aerobically (Demirel and Yenigün 2002)
The main advantage of anaerobic processes is the ability to convert organic matters into biogas (methane and carbon dioxide), that can be further applied in internal combustion generator systems to produce power, creating a balance with the utilization of natural gas, propane, fuel oil, or other fossil fuels. Industries, such as, sugar refineries, distilleries and food and beverage industries produce wastes which could be directly treated onsite and the biogas generated could be applied on equipment such as boilers, kilns, sludge dryers and in other equipment which are energy dependent. If purified, biogas can be used as fuel for vehicles which can economically support transportation industries (USDA et al. 2014).
1.2 Anaerobic digestion biotechnology
In anaerobic treatment is crucial to understand the technology, biochemistry and microbiology of the process in order to optimize the process. This natural digestion of organic matters (carbohydrates, proteins and lipids) results from a coordinated and syntrophic activity between different trophic groups of microorganisms (Zeikus 1977), and the final products are mainly methane (CH4) and carbon dioxide (CO2) gases, and water (Reis 1991). Anaerobic digestion (AD) is widely used for treating wastewater since it stabilizes wastewater solids, reduces pathogens and odors. In addition, AD can also be used to reduce the total solid waste, producing an effluent that contains stabilized solids, some in forms of nutrients (U.S. Environmental Protection Agency. 2006).
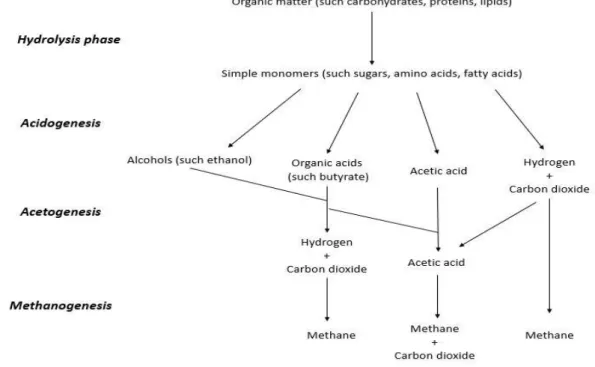
AD can be divided into four main phases: hydrolysis, acidogenesis, acetogenesis and methanogenesis (Figure 1.1) (Wong and Chu 2003), described below.
Figure 1.1 - The major pathways of organic matter degradation by anaerobic digestion (adapted from Wong and
3
1.2.1 Hydrolysis phase
Hydrolytic phase is the first step of anaerobic degradation where organic matter is hydrolysed due to extracellular hydrolases produced by facultative anaerobes and anaerobes (Wong and Chu 2003). During hydrolysis, macromolecules such carbohydrates, protein and lipids are hydrolysed into simple monomers (Table 1.1) (Gerardi 2007). This phase is time consuming (Gerardi 2007) and its duration depends on the compounds nature which can be harder to depolymerise (Reis 1991). Longest degradation is the transformation of lipids into fatty acids by Clostridium and Micrococcus genus which
are responsible for the production of lipases (Wong and Chu 2003). Carbohydrates can be hard to degrade given its nature (Reis 1991). Cellulases and xylanases enzymes, which are secreted by
Cellulomonas sp and Clostridium sp, convert carbohydrates into simple sugars (e.g. glucose) (Wong
and Chu 2003; Lo et al. 2009). The proteins present are hydrolysed into amino acids, small peptides, ammonium and carbon dioxide (Parawira 2004) by Bacteroides, Butyrivibrio, Clostridium, Fusobacterium, Selenomonas and Streptococcus (McInerney 1988; Wong and Chu 2003).
Table 1.1 – Extracellular hydrolyses, their spectrum of action and its products (adapted from Gerardi 2007)
Substrate Extracellular hydrolyses Product
Lipids Lipolytic (e.g. Lipase) Fatty acids
Carbohydrates Saccharolytic/Cellulolytic (e.g. Cellulase)
Simple sugar
Proteins Proteolytic (e.g. Protease) Amino acids
1.2.2 Acidogenesis
Monomers produced in the hydrolytic phase are consumed during acidogenesis by fermentative microorganisms or anaerobic oxidisers (acid-forming) produce organic acids, short- chain fatty acids also known as volatile fatty acids (VFAs), alcohols, carbon dioxide and hydrogen (Boone and Mah 1987). In this second phase of anaerobic digestion, there is an important syntrophic relationship between facultative and obligatory anaerobes. If, for some reason, there is oxygen present in the process, facultative microorganisms (e.g. Streptococci and Enterococcaceae) will consume it (Alves
1998; Ali Shah et al. 2014). Hence, obligatory microorganisms such as Pseudomonas, Bacillus, Clostridium, Micrococcus, or Flavobacterium genus have optimum conditions to perform acidogenesis (Shah et al. 2014).
short-4 chain fatty acids (e.g. butyrate and propionate). In this phase, the final fermentative products can have an impact in the entire anaerobic digestion perfomance, affecting efficiency and running stability of the next phases (Wang et al. 2009).
1.2.3 Acetogenesis phase
Fermentations processes are classified based on the nature of the products (Reis, 1991). Thus, during acetogenesis, the fermentation products of the previous phase (acidogenesis) are converted to acetate, hydrogen and carbon dioxide by obligate hydrogen producing acetogens (e.g Enterobacter
spp., Serratia spp., Citrobacter spp., Syntrobacter spp. and Desulfovibrio spp.) (Boonet and Bryant
1980; Wong and 2003) through acetogenic dehydrogenation (Alves 1998; Wong and Chu 2003).
Hydrogen-consuming homoacetogens (e.g. Clostridium spp and Acetobacterium spp.) consume
hydrogen and carbon dioxide to producing acetate via acetogenic hydrogenation (Wong and Chu 2003). Acetogenic dehydrogenation and hydrogenation are reactions which result from syntrophic relations between hydrogen producing and consuming bacteria (Iannotti et al. 1973).
AD is a process which depends on syntrophies between acidogenic/acetogenic bacteria and methanogens (acetate-removing methanogens and hydrogen-removing methanogens) (Wong and Chu 2003). Thus, environmental and operational conditions, such as the partial pressure of hydrogen, are crucial for acidogenic, acetogenic and methanogenic communities (Xing et al. 1997; Sekiguchi et al. 2001). Without those syntrophic relations (fatty-acid-, hydrogen- and acetate-removing reactions), the web of reactions between acetogenic and methanogenic phases cannot occur (Sekiguchi et al. 2001) .
1.2.4 Methanogenesis phase
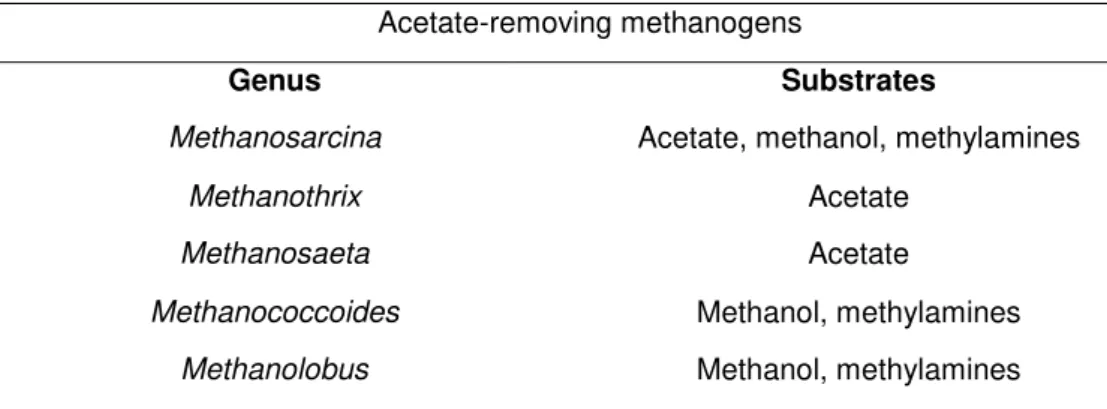
Methanogenesis is the fourth and final phase of AD where methanogenic microorganisms consume a limited number of substrates, mainly acetate but also others such as formate, methanol, methylamines, carbon dioxide and hydrogen to produce methane as an end metabolic (Wong et al. 2003). Methanogens are oxygen-sensitive anaerobes, and belong to a particularly group of Archaea (Archaea domain) (Alves 1998; Parawira 2004; Gerardi 2007). There are two groups of methanogens - acetate-removing methanogens and hydrogen-removing methanogens – which belong to different species of archaea (Table 1.2 and Table 1.3).
Table 1.2- Genus of acetate-removing methanogens and possible substrates (adapted from Wong and Chu 2003).
Acetate-removing methanogens
Genus Substrates
Methanosarcina Acetate, methanol, methylamines
Methanothrix Acetate
Methanosaeta Acetate
5
Table 1.3- Genus of hydrogen-removing methanogens and possible substrates (adapted from Wong and Chu 2003).
‘’Methane producers’’ are highly sensitive to environmental variations (Wong and Chu 2003).
When conditions are not optimal for methanogens, accumulation of volatile fatty acids (e.g. acetate) and hydrogen will occur. If the concentration of hydrogen rises, acetogenesis will also be inhibited and the propionic, butyrate and valerate start to accumulate. This accumulation will result in a lower pH, i.e., loss of the alkalinity power. As methanogens grow slowly and prefer pH values between 6-8, this kind of variations can cause the failure of the system (Reis 199; Wong and Chu 2003; Parawira et al. 2006).
1.3 Sulphate reducing bacteria in anaerobic digestion
AD is very dependent on the syntrophic relations between anaerobic microorganisms which are responsible for different catabolic reactions. Without the syntrophic relations, the sequence of intermediates products to methane production cannot occur (Reis 1991). When sulphate reducing bacteria (SRB) are present, competition for substrate may occur which may decrease the methanogenic activity. Wastewater from winery industries usually contain sulphates and/or sulphites. SRB have a strong activity in anaerobic environments which are rich in sulphates (SO42-) (Reis 1991). In these environments, sulphate is reduced to hydrogen sulphide (H2S), which is a toxic compound (Sawyer et al. 2003). SRB are known to utilize a wide range of substrates (Liamleam and Annachhatre 2007). As such, when the objective is to treat wastes from wine industries (with sulphate present) through AD, methane production may be lower due to the competition for substrate between methanogens and SRB. Acidogenic, acetogenic and methanogenic microorganism can compete with SRB for the same substrates in the same environmental conditions (Kalyuzhnyi et al. 1998). SRB and acetogenic bacteria compete for ethanol and VFAs, and/or SBR and methanogenic archaea for hydrogen and acetate. In addition, the hydrogen sulphide produced by the SRB may have cause inhibition to all species present, and may even lead to its failure. Koster et al., (1986) studied the inhibition by hydrogen sulphide concentration, concluding that 250 mg/L of H2S at pH range 6.4-7.2 and 90 mg/L of H2S at range 7.8-8.0 inhibited 50% of methanogenesis.
1.4 Environmental conditions
In anaerobic processes, environmental conditions are relevant because anaerobic microorganisms are susceptible to environmental changes, especially the methanogens. Those
Hydrogen-removing methanogens
Genus Substrates
Methanobacterium Hydrogen, formate
Methanomicrobium Hydrogen, formate
Methanococcus Hydrogen, formate
6 important conditions are organic loading rates, hydraulic retention times, temperature and nutrient availability.
1.4.1 Organic loading rate and hydraulic retention time
To achieve stability in anaerobic processes it is crucial to ensure the control of the organic loading rates (OLR). OLR express the quantity of organic matter fed per unit volume of the reactor per unit time, and can be expressed in terms of chemical oxygen demand (kg COD/(L.day)). It is essential to ensure the best organic loading rate for anaerobic digestion to achieve efficient performances. If the reactor is fed with lower organic loading rates, the capacity of the reactor will not be fully utilized. However, overloading the reactor with organic matter could lead to accumulation of VFA or other inhibitors and thus, fail of the bioreactor (Gerardi 2003).
One way to control the OLR is to vary the hydraulic retention time (HRT). HRT is the time that the feedstock is present in the anaerobic reactor. Retention times are very important for anaerobic digestion since unsuitable times can lead to overloading which may cause biomass washout and process failure (Parawira 2004). This parameter will have impact in the economic gain of the overall process. As expected, shorter HRT for a certain volume of wastewater is more economical favourable than higher HRT (Dugba and Zhang 1999). Hence, this parameter must be carefully study. Parawira et. al (2007) operated 3 systems with different OLR (2.2 to 11.0; 4.5 to 22.3 and; 1.3 to 36.0 g COD/(L.day)). The best yield was obtained for an OLR of 11gCOD/(L.day) which is a rather low OLR considering the high organic matter in agroindustrial wastes.
1.4.2 Temperature ranges
7 optimal set point. Additionally, the concentration of volatile fatty acids increases more than double in thermophilic conditions when compared to the mesophilic conditions (Speece 1985).
Comparing the four phases of AD, hydrolysis and acidogenesis are not so dependent of temperature. Due to the mixed population that both have, there are always some microorganisms that support the variations of temperature. Acetogenic and methanogenic phases have specific microorganism that are more sensitive to different ranges of temperature (Parawira 2004).
1.4.3 pH and alkalinity ranges
The performance of anaerobic digestion also depends on the activity of the hydrogen ion. This activity results from available carbon and energy sources, substrate dissimilation, various synthesis and storage material and releases of metabolic products from the cell (Elefsiniotis and Oldham 1994). The methanogenic community is more sensitive to pH variations than other groups in the anaerobic community (e.g. acidogenic bacteria). For acidogenic bacteria, the optimal range is between 5.5 and 6.5 and for methanogens 7.8 and 8.2. For anaerobic communities in single phase (not separated in acid/gas) the range varies between 6.8 and 7.4 (Khanal 2008). When stable, methanogenic processes do not require pH control because of its buffering capacity. However, when treating wastes with low buffering capacity (e.g carbohydrate-rich waste) there is a necessity to control the pH. Alkalinity capacity is extremely important for anaerobic digestion since it is the measurement of the chemical buffering capacity of the aqueous solution. As such, it is crucial that the bioreactor provides enough buffering capacity to neutralize, for example, the accumulation of VFA in bioreactor (Parawira et al. 2006). To control alkalinity, sodium bicarbonate is usually added or sodium hydroxide to increase alkalinity and control the pH. Alkalinity can also be generated through protein conversion to ammonium, which mixed with carbonic acid in solution forms ammonium bicarbonate buffer. However, this method increases the process cost, being economical unfavourable. Thus, it is important to ensure that anaerobic processes are being operated under optimal conditions to improve its capacity of buffering, without the need for external addition (Fannin 1987).
1.4.4 Nutrients
Organisms need certain nutrients to complete their cycles of growth and reproduction. For microorganisms involved in anaerobic digestion, nutrients are required and a lack of those nutrients can negatively affect the performance. Nutrients such as nitrogen and phosphorus are the most important for biomass synthesis (Speece and McCarty 1964). This supplementation is done commonly in the form of urea, aqueous ammonium or ammonium chloride for nitrogen, and for phosphorus as phosphoric acid or a phosphate salt (Khanal 2008). The amount of nutrients is calculated taking into consideration the optimal C:N:P ratio. For anaerobic digestion, the ratio of nutrients can be maintained around 100:0.6:0.13 (Moletta, 2005).
8 boron, copper, cobalt, nickel, selenium, molybdenum and tungsten to the fermentation medium improved methane yields in 30%.
1.5 Two-phases anaerobic digestion
Anaerobic digestion has been applied to several organic wastes such as, distillery and food waste. Two phase anaerobic digestion systems to treat the mentioned wastes is still being optimized. As referred in sections 1.2 and 1.3, the phases of AD (hydrolysis, acidogenesis, acetogenesis and methanogenesis) have significant differences in terms of microbial population and growth rates, as well as environmental conditions. Thus, the separation of this process in two phases (acidogenesis and methanogenesis) is a good option since it allows the optimization and higher stability of each phase (Pohland and Ghosh 1971). When AD occurs in two phases, acidifying organisms are maintained at lower pH producing high amounts of CO2 and VFAs. The latter are fed to the second reactor where the pH is maintained at pH >7 favouring specific methanogenic microorganisms, stopping the growth of microbial acidogens. Thus, it is possible to create conditions (e.g. pH) in one reactor for hydrolitic and acidogenic microorganism, and in other reactor conditions for acetogenic and methanogenic microorganism (Pohland and Ghosh 1971). Ariunbaatar et al. (2015) compared single-phase and two-phase in their study which resulted on failure of single two-phase duo to accumulation of acids leading to lost capacity of buffering. Their two-phase achieved higher OLR producing methane. Onward advantages of two-phase anaerobic digestion over single phase anaerobic digestion are indicate (Yu et al. 2002; Parawira 2004; U.S. Environmental Protection Agency. 2006; Rubio-Loza and Noyola 2010; Maspolim et al. 2015):
The start-up of acidogenic and methanogenic phase is easier and faster than in single phase AD;
Single phase AD does not support short HRTs due to possible wash out of methanogenic microorganism (slow growth rate) and VFAs accumulation;
The influent volume that can be treated in two-phases is higher than in single phase AD;
A good control of process reliability, stability and resilience when variations occurs, especially with variable waste conditions (e.g pH);
Higher biomass conversion performance as well as higher COD removal, significantly;
Two phase produces less and better quality of Class A biosolids;
Biogas producing is higher and its composition in methane is higher (80-85%) duo to specific conditions in methanogenic reactor.
There are some disadvantages of two-phase AD as engineer, implementation and operation that are more difficult than single phase AD, as well as its cost (U.S. Environmental Protection Agency. 2006).
9 systems to treat fruit and vegetable wastes. The single-phase system crashed due to the accumulation of VFAs. On the contrary, the two-phase system remained stable. It has been accepted that AD is more effective than other processes to treat fruit wastes, such as incineration. However, more in depth studies on the operational conditions so that the process becomes more rentable (Sitorus et al., 2013).
1.6 The main objective
11
2. Methods and materials
2.1 5-Litres two-phase anaerobic reactor setup
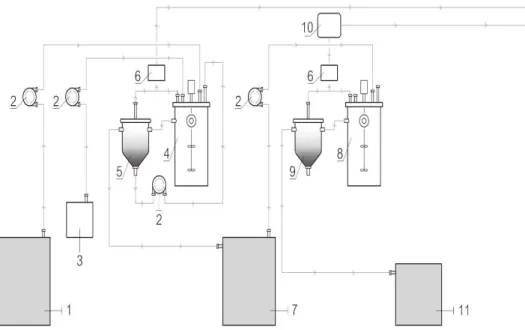
Two-phase anaerobic set-up is demonstrated in Figure 2.1. The two-phase AD system was composed by two 5-litre Continuously Stirred Tank Reactor (CSTR) (Bioprocess Control). In the acidogenic phase, CSTR configuration was utilized in order to provide an optimal contact between feedstock and biomass (stirring at 200 rpm), reducing mass transfer limitations. A decanter (5) was added in the reactor outlet in order to retain solids and biomass, clarifying the fermentation broth and promoting the recirculation of the suspended biomass. Similarly, a CSTR configuration was used in the methanogenic phase, but with lower stirring (100 rpm) to maintain the integrity of the granules. Similarly, to the acidogenic fermenter, a settler (9) was added in order to clarify the effluent broth and recirculate biomass, if necessary.
Figure 2.1- Two-phases AD set-up design: 1) acidogenic influent container (20L); 2) pump; 3) bottle of NaOH
solution; 4) acidogenic reactor of 5 litres (CSTR); 5) acidogenic decanter; 6) gas flow meter; 7) acidogenic effluent/methanogenic influent container; 8) methanogenic reactor of 5 litres (CSTR); 9) methanogenic decanter; 10) gas analyser for methane and carbon dioxide; 11) methanogenic effluent container.
2.2 Bioreactor inoculum and reactor start-up
2.2.1 Acidogenic phase with apple pulp waste
12
2.2.2 Methanogenic phase with apple pulp waste
The methanogenic fermenter was operated with methanogenic granules previously acclimatized (six months) using peach pulp acidogenic effluent (origin of the granules: anaerobic Biobed EGSB reactor treating wastewater from a brewery - UNICER, Porto). The inoculum had an average VSS concentration of 9.00 g VSS/L. The reactor started continuously with 5 days of HRT and a target organic loading rate (OLR) of 4.10 g COD/(L.day). The influent used in the first 5 days was obtained in the previous work with peach pulp waste.
2.2.3 Acidogenic phase with Winery Waste with Grape Concentrated (WWGC)
The inoculum used in the acidogenic phase was collected from an anaerobic digester from Beirolas WWTP (Sacavém, Portugal). The sludge (2.2 L) was diluted in 1.55 L of water and added to 1.25 L of WWGC (24 g COD/L) achieving a final concentration of 6 g COD/L and a VSS concentration of 7.70±0.01 g VSS/L. The reactor started in batch mode during the first 5 hours (to assure the sludge adaptation to the new substrate). After 5 hours, the reactor started to be fed continuously with a target OLR of 6 g COD/(L.day) and HRT of 4 days.
2.2.4 Methanogenic phase with WWGC
The methanogenic fermenter was inoculated with granular sludge from an anaerobic Biobed EGSB reactor treating wastewater from a brewery (UNICER, Porto). The volume of inoculum was 1.5L and diluted in 3.5 L of water, reaching an average VSS concentration of 7.20 g VSS/L. The operation was started in continuous mode with a HRT of 8.6 days and a target OLR of 1.90 g COD/(L.day).
2.3
Influents (real wastes)
2.3.1 Acidogenic reactor
13
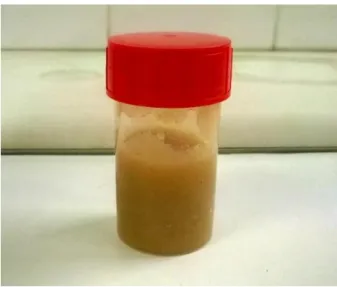
Figure 2.2- Apple pulp waste.
In order to have an influent with the intended characteristics, rich in ethanol and sugar, a mixture of winery wastewater and grape concentrate (Figure 2.3) was the second influent tested in the acidogenic reactor. Mixture was required due to the lower sugar content in winery waste, and it was prepared to reach an initial COD concentration of 24 g COD/L, and supplemented with ammonium and phosphorus to achieve a C:N:P ratio of 100:0.5:0.1. From day 15 the ratio was changed to 100:1:0.20 to avoid nutrient limitation.
Figure 2.3- Wastes of a WWGC mixture:a) winery waste; b) grape concentrated.
2.3.2 Methanogenic reactor
Fermentation products of acidogenic reactor with apple pulp waste
The methanogenic influent resulted from the effluent of the acidogenic fermentation. During the first 7 days of operation, the methanogenic influent used was obtained in previous work using peach pulp waste. From day 8, the influent used was the acidogenic effluent obtained with apple pulp waste.
14 Since the acidogenic effluent had ammonium and phosphorus, their supplementation was not necessary.
Fermentation products of acidogenic reactor with WWCG
Methanogenic influent resulted from the fermentation products obtained in acidogenic reactor with WWGC. Similarly, to the experimental period with apple pulp waste, the supplementation of ammonium and phosphorus was not performed.
2.4 Biogas flow rate and composition
2.4.1 Acidogenic and methanogenic phase
The biogas flow rate was monitored online by a gas flow meter (Bioprocess Control µflow), with
values acquired every 5 minutes for both phases. Also online, the methane and carbon dioxide content on methanogenic biogas was monitored by analyser BenchOne (Bluesens) on methanogenic phase. In both phases, biogas composition was monitored offline, by gas chromatography (GC), to evaluate the biomass activity of both reactors. The samples were collected from a valve located on the top of reactors.
2.5 Operational conditions
2.5.1 Acidogenic phase with apple pulp waste
15
Table 2.1 –Conditions imposed during acidogenic phase with apple pulp waste.
2.5.2 Methanogenic phase with apple pulp waste
As in the acidogenic reactor, the temperature was controlled at 30°C or 37°C. The pH was maintained at 7.33±0.09 for 57 days and, then controlled with a solution of NaOH (5 M) at 8.03±0.14, during 43 days. Initially, the reactor was started with a HRT of 5 days, resulting in an OLR of 4.14±0.04 g COD/(L.day). For the following days, the HRT was 2.5 days raising the OLR to 7.32±0.77 g COD/(L.day). Since an accumulation of volatile fatty acids was observed, the HRT was increased to 5 days, resulting in a OLR of 4.6±0.40 g COD/(L.day) during the last 11 days. The duration of each condition is presented in Table 2.2. To prevent the system failure, methanogenic reactor was not fed (batch mode) during the last period (between day 98 and day 100). Temperature, pH and biogas flow rate were monitored online through Bioprocess Control software.
Table 2.2- Conditions imposed during methanogenic phase with apple pulp waste.
Period Conditions Days
I HRT 2 days; Tº 30 ºC; pH at 5.45 1-5
II HRT 1 day; Tᵒ 30ᵒC; pH at 5.45 6-14
III HRT 1 day; Tᵒ 37ᵒC; pH at 5.45 15-30
IV HRT 1 day; Tº 37 ºC; micronutrients solution; pH at
5.45
31-82
V HRT 1 day; Tº 30ºC; without micronutrients solution; pH at 5.45
83-100
Period Conditions Days
I VFAs from acidogenic fermentation of peach pulp
waste; T 30ºC; HRT 5 days; pH at 7.5
1-5
II VFAS from acidogenic fermentation of apple pulp waste; Tº 30ºC; HRT 5 days; pH at 7.5
6-8
III HRT 2.5 days; Tº 30ºC; pH at 7.5 9-14
IV HRT 2.5 days; Tº 37ºC; pH at 7.5 15-57
V HRT 2.5 days; Tº 37ºC; pH at 8 58-82
VI HRT 2.5 days; Tº 30ºC; pH at 8 83-87
VII HRT 5 days; Tº 30ºC; pH at 8 88-97
16
2.5.3 Acidogenic phase with WWGC
The temperature of operation was controlled at 30°C by a water bath during the 104 days of operation. The pH was automatically controlled at 5.50±0.05 by addition of NaOH 5M. At the beginning, the reactor was operated with a HRT of 4 days achieving an OLR of 5.56±0.12 g COD/(L.day) in order to acclimatize the sludge. Then, the HRT was changed to 2 days with an OLR of 13.20±2.40 g COD/(L.day). When the HRT was reduced for 1 day, the OLR increased to 23.20±6.28 g COD/(L.day). The biomass recirculation flow rate was identical to the acidogenic feed flow rate, and started when the HRT was 1 day. On day 17, the content of nutrients was increased. Table 2.3 describes the periods and duration of each condition. Temperature, pH and biogas flow rate were monitored online through Bioprocess Control software.
Table 2.3- Conditions imposed during acidogenic phase with WWGC.
2.5.4 Methanogenic phase with WWGC
Similar to the acidogenic reactor, the temperature was controlled at 30°C during 90 days. The pH was maintained at 7.5±0.2, except during the reactor start-up that was maintained at 6.8±0.1.During the first 9 days the reactor was operated with a HRT of 8.6 days (OLR of 1.92±0.09 g COD/(L.day)), then the HRT was decreased to 5 days (OLR of 3.01±0.18 g COD/(L.day)). During the first 7 days with HRT of 5 days, the pH of influent was controlled at 7 in order to maintain the pH about 7.5 inside the reactor. After this time, the influent started to be fed with a pH of 5.45±0.05. On day 29, the HRT was decreased to 2.5 days (7.06±0.40 g COD/(L.day)). After this time, the HRT was decreased to 2 days (9.70±0.81 g COD/(L.day)) and then to 1.5 days (12.97±0.85 g COD/(L.day)). The duration of each condition is presented in Table 2.4. Temperature, pH and biogas flow rate were monitored online through Bioprocess Control software.
Period Conditions Days
I HRT 4 days; Tᵒ 30ᵒC; pH 5.45 1-7
II HRT 2 days; Tº 30ºC; pH at 5.45 8-13
III HRT 1 day; recirculation ON; Tº 30ºC; pH at 5.45 14-16
17
Table 2.4- Conditions imposed during methanogenic phase with WWGC.
2.6 Analytics methods
Sampling (feed and reactor) was performed 3 times a week, and depending on the state of each reactor, additional samples were taken to control their performance. The samples taken were analysed in terms of chemical oxygen demand (COD), volatile fatty acids (VFAs), ammonium and phosphorus concentration in both reactors. The sugar concentration was also determined in the acidogenic reactor. To determine the total suspended solids (TSS) and volatile suspended solids (VSS), samples were taken twice or once a week for acidogenic and methanogenic reactor, respectively. In order to monitor the granular sludge of the methanogenic reactor, samples were taken at various reactor heights, h0, h1, h2 and h3 (at 0, 10, 17 and 25 cm from bottom).
Samples for analytic methods were centrifuged (11.000 rpm during 3 minutes) to remove biomass and solids (except the sample of acidogenic feed).
2.6.1 Chemical oxygen demand (COD)
In order to assess COD variation and to calculate the real organic loading rates, COD was measured using Hach Lange GMBH kits. Prior to analysis, the samples were filtered with 0.2 µm syringe
filters, with the exception of the acidogenic feed (samples without biomass). The digestion was performed using the Hach Lange HT 200 S digestion (15 minutes). After digestion and cooling, the
concentration of COD was measured using a spectrometer Hach Lange DR 2800. In analysis of
samples, there was not duplicated.
2.6.2 Volatile Fatty acids and ethanol
The determination of volatile fatty acids (VFAs) and ethanol concentration was performed by high performance liquid chromatography (HPLC). The system was composed by a chromaster (VWR Hitachi) with IR-detector, a pre-column (125-0129 30x4.6mm Biorad) and a column (Aminex HPX-87H 300x7.8MM Biorad). The eluent was H2SO4 0.01 N with a flow rate of 0.5 mL/min. Column temperature was 30°C.
Period Conditions Days
I HRT 8.6 days; Tº 30ºC 1-9
II HRT 5 days; Tº 30ºC 10-28
III HRT 2.5 days; Tº 30ºC 29-36
IV HRT 2 days; Tº 30ºC 37-44
18 Firstly, supernatant samples were diluted using H2SO4 0.05 N and then filtered with 0.2 µm syringe filters. All samples were analysed without duplicated.
2.6.3 Ammonium and phosphorus
To control nutrients consumption, the ammonium and phosphorus concentration were determined by a colorimetric method implemented in a flow segmented analyser (Skalar San++).
The supernatant samples of acidogenic and methanogenic reactors and influent samples were diluted with Milli-Q water. For acidogenic phase, the reactor samples were analysed only once and the influent samples were analysed twice. For methanogenic phase, the reactor samples were analysed twice and the influent samples were analysed only once.
2.6.4 Sugar
A colorimetric method (Dubois et al. 1956) was applied to quantify sugars. Acidogenic reactor samples were filtered using 0.2 µm. Glucose solution (200 ppm) was used as standard. Briefly, a 0.5 mL of sample was added to 0.5 mL of phenol solution 5% and 2.5 mL of H2SO4 98%. After adding reagents, the samples were maintained in darkness for 10 minutes. Then mixed in vortex and maintained again in darkness during 30 minutes. After this time, the absorbance was measured at 490 nm using the Hach Lange DR 2800 spectrophotometer. In analysis of samples, there was not
duplicated.
2.6.5 Gas composition
The gas composition was determined through gas chromatography (GC). Weekly, one sample of each reactor was taken with gas-tight syringe and 250 mL of sample was injected in Thermo Trace GC Ultra. The GC was equipped with TCD detector and 30 meters of Carboxen 1010 Plt column. The mobile phase was helium with 1 mL/min of flow rate with isothermal runs during 50 minutes at 35°. The Injector temperature was 200°C.
2.6.6 Total suspended solids and Volatile suspended solids
The TSS and VSS were determined using the standard methods (APHA/AWWA 1995). Briefly, samples were filtered using glass fiber filters (Glass fiber 1.2um, 47 mm) previously dried and weighed (Sartorius analytical scale). After filtration, the samples were dried at 100°C over night. After this time,
the filters were weighed to TSS quantification. For VSS quantification, filters were dried at 550°C during 2 hours and weighed.
The average for VSS concentration in the methanogenic reactor was calculated using a mathematical trapezoidal rule.
19
2.6.7 Sulphide
Analysis to sulphides concentration on methanogenic reactor with WWGC influent were adapted from Cord-Ruwisch (1985) method. Briefly, 0.1 mL of reactor sample was diluted in 4 mL of CuSO4 solution. The absorbance was measured at 480 nm (ThermoSpectromic, Heλios). All samples were analysed twice.
2.7 Parameters calculation
To determine the percentage of ∆VFAs per CODtotal_in (conversion %), yield of VFAS CODsoluble_out per sugar CODtotal_in and productivity of VFAssoluble_out in acidogenic phase were used the equations 1, 2 and 3 respectively.
𝐶𝑜𝑛𝑣𝑒𝑟𝑠𝑖𝑜𝑛 % =
𝐶𝑂𝐷𝑡𝑜𝑡𝑎𝑙 𝑖𝑛 ∆𝑉𝐹𝐴𝑠×100
(1)
𝑌
p_VFA/s=
𝑆𝑢𝑔𝑎𝑟 𝐶𝑂𝐷∆𝑉𝐹𝐴𝑠 𝐶𝑂𝐷total 𝑖𝑛(2)
𝑃𝑟𝑜𝑑𝑢𝑐𝑡𝑖𝑣𝑖𝑡𝑦_𝑉𝐹𝐴𝑠 =
∆𝑉𝐹𝐴𝑠 Volume× Qin(3)
Where, ∆ VFAs is the concentration the difference between VFAs and ethanol in and VFAs and ethanol out, Yp/s is the yield of VFAs and ethanol per g COD sugar and Qin is influent flow rate.
To determine the yield and productivity of methane in methanogenic phase were used the following equations, 4 and 5, respectively:
𝑌
p_CH4/s=
𝑏𝑖𝑜𝑔𝑎𝑠 𝑓𝑙𝑜𝑤 𝑟𝑎𝑡𝑒×(% 𝑚𝑒𝑡ℎ𝑎𝑛𝑒
100 )
(𝐶𝑂𝐷 𝑠𝑜𝑙𝑢𝑏𝑙𝑒 in - COD soluble out)×𝑉𝑜𝑙𝑢𝑚𝑒𝐻𝑅𝑇
(4)
𝑃𝑟𝑜𝑑𝑢𝑐𝑡𝑖𝑣𝑖𝑡𝑦_𝑚𝑒𝑡ℎ𝑎𝑛𝑒 =
𝑏𝑖𝑜𝑔𝑎𝑠 𝑓𝑙𝑜𝑤 𝑟𝑎𝑡𝑒 × % 𝑚𝑒𝑡ℎ𝑎𝑛𝑒𝑉𝑜𝑙𝑢𝑚𝑒(5)
21
3. Results and discussion
3.1 Performance of the acidogenic bioreactor with apple pulp
waste
3.1.1 Organic matter conversion
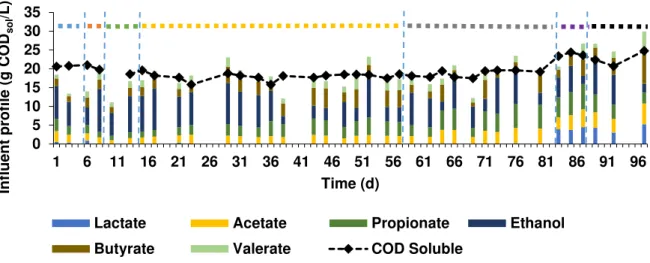
Figure 3.1 and Figure 3.2 represent the influent profile of the acidogenic reactor. Ethanol was the main compound (45.51±18.41 % of CODtotal_in) and VFAs were present in the form of lactate (0.46±0.61% of CODtotal_in), acetate (0.33±0.118% of CODtotal_in), propionate (0.28±0.19% of CODtotal_in) and butyrate (0.01±0.13% of CODtotal_in). The sugar was also present in the influent, as expected (Figure 3.2) and its concentration varied throughout the operation, with a minimum of 0.11 g/L and a maximum of 30.63 g/L. That variation as well as the variation in ethanol and VFAs concentration resulted from the state of waste apple pulp which was not identical throughout operational time since it was a real waste. Ethanol, VFAs and sugar were the main contributors for the CODtotal_in in the influent (Figure 3.3).
23
Figure 3.1- Influent profile of acidogenic reactor with apple pulp waste in terms of ethanol and VFAs during the operation time.
Figure 3.2- Influent composition (sugar in) and inside reactor composition (sugar out) in terms of sugar during the
operation time of acidogenic phase with apple pulp waste: blue bar (period I)- HRT of 2 days with temperature of 30ᵒC; orange bar (period II)- HRT of 1 day with temperature of 30ºC; green bar (period III)- HRT of 1 day with temperature of 37ᵒC; yellow bar (period IV)- HRT of 1 day with temperature of 37ᵒC and micronutrients solution added; purple bar (period V)- HRT of 1 day, without micronutrients solution and temperature of 30ᵒC.
Figure 3.3- Representation of compounds (sugar, ethanol and VFAs) which contribute to the CODtotal_in during the
operation of the acidogenic reactor with apple pulp waste. 0 5 10 15 20 25 30 35 40
1 6 11 16 21 26 31 36 41 46 51 56 61 66 71 76 81 86 91 96
In flu e nt c om po s iti on (g CO D/L) Time (d)
Lactate Acetate Propionate Ethanol Butyrate Valerate
0,0 0,5 1,0 1,5 2,0 2,5 3,0 0 5 10 15 20 25 30 35
1 6 11 16 21 26 31 36 41 46 51 56 61 66 71 76 81 86 91 96
S u g ar o u t ( g /L) S u g ar in (g /L) Time (d)
Sugar in Sugar out
0 10 20 30 40
1 6 11 16 21 26 31 36 41 46 51 56 61 66 71 76 81 86 91 96
Sug a r in , e tha no l a nd VFA s , CO Dtota l in (g CO D/L) Time (d)
24
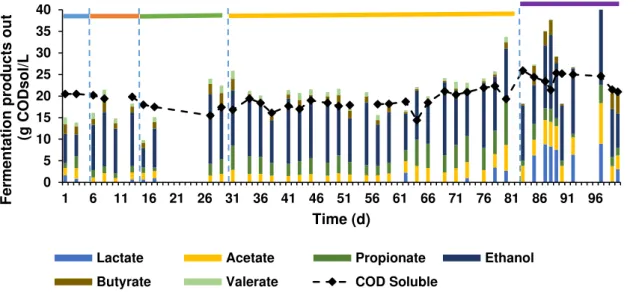
Figure 3.4- Fermentation products of the acidogenic phase with apple pulp waste along the operational time: blue
bar (period I)- HRT of 2 days with temperature of 30ᵒC; orange bar (period II)- HRT of 1 day with temperature of 30ºC; green bar (period III)- HRT of 1 day with temperature of 37ᵒC; yellow bar (period IV)- HRT of 1 day with temperature of 37ᵒC and micronutrients solution added; purple bar (period V)- HRT of 1 day, without micronutrients solution and temperature of 30ᵒC.
Table 3.1 –Conversion of CODtotal_in in VFAs (%), yield of ΔVFAs per sugar CODtotal_in and productivity of VFAs in
all periods of acidogenic phase with apple pulp waste (I, II, III, IV and V).
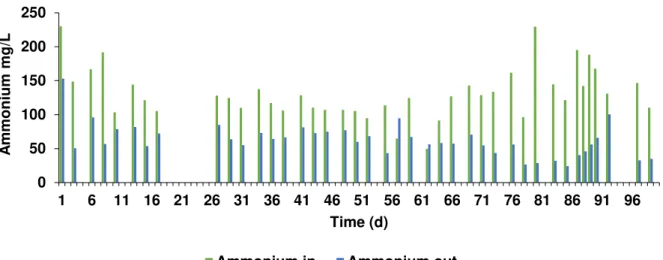
3.1.2 Ammonium and phosphorus
Figure 3.5 and Figure 3.6 show the concentration of ammonium and phosphorus in the influent and in the effluent. It is noticeable that there was a consumption of both nutrients throughout the operation which is a good indicative of the activity and growth of the biomass. In addition, given that there was still ammonium and phosphorus in the effluent, there was no limitation of nutrients.
0 5 10 15 20 25 30 35 40
1 6 11 16 21 26 31 36 41 46 51 56 61 66 71 76 81 86 91 96
F er men tatio n p ro d u cts o u t (g CO Dsol/L Time (d)
Lactate Acetate Propionate Ethanol Butyrate Valerate COD Soluble
Period Conditions
Conversion
VFAs/COD
(%)
Yield
g COD/g COD
Productivity
g COD/(L.h)
I HRT 2 days; Tº 30
ºC
35.75a 0.58a 4.70a
II HRT 1 day; Tᵒ 30ᵒC 30.12 ±16.15 0.21 ± 0.29 3.70 ± 5.31
III HRT 1 day; Tᵒ 37ᵒC 38.65 ± 11.98 0.42 ± 0.28 9.72 ± 3.69
IV HRT 1 day; Tº 37 ºC;
micronutrients solution
19.05 ± 16.64 0.19 ± 0.18 4.86 ± 5.71
V HRT 1 day; Tº 30ºC;
without micronutrients
46.07 ± 27.87 0.68 ± 0.41 16.42 ± 9.65
25
Figure 3.5- Ammonium concentration in the influent (in) and inside the reactor (out) of acidogenic phase with apple
pulp waste during the operational time.
Figure 3.6- Phosphorus concentration in the influent (in) and inside the reactor (out) of acidogenic phase with apple pulp waste during the operational time.
3.1.3 Total suspended solids (TSS) and Volatile suspended solids (VSS)
To determine the characteristics of the influent in terms of solids and to monitor the population concentration in the acidogenic phase, TSS and VSS of the influent and inside of reactor were determined. Throughout the operation, the feed presented an average of TSS and VSS of 7.94±1.72 g/L and 7.56±1.62 g/L, respectively. There were some variations due to apple pulp waste being a real waste (Figure 3.7). As mentioned in section 3.1.1, there was an increase of OLR, causing an increase of solids on days 85, 87, 92 and 99 (more pulp) where the average of TSS was 9.16±0.91 g/L and VSS was 8.78±0.91 g/L.
Inside the reactor the average of TSS and VSS was 5.92±1.62 g/L and 5.46±1.32 g/L, respectively. Through Figure 3.8, it is possible to see that there was a stable concentration of acidogenic biomass, and the increase on day 85, 87, 92 and 99 of TSS (8.9±1.59 g/L) and VSS (7.81±1.16 g/L) was probably due to the presence of more solids in the influent (Figure 3.7).
0 50 100 150 200 250
1 6 11 16 21 26 31 36 41 46 51 56 61 66 71 76 81 86 91 96
A
mm
o
n
ium
mg
/L
Time (d)
Ammonium in Ammonium out
0 50 100 150 200 250
1 6 11 16 21 26 31 36 41 46 51 56 61 66 71 76 81 86 91 96
P
h
o
sph
o
ru
s
mg
/L
Time (d)
26
Figure 3.7 - Influent profile in terms of total suspended solids and volatile suspended solids along acidogenic performance with apple pulp waste.
Figure 3.8 - Total suspended solids and volatile suspended solids of acidogenic reactor along acidogenic
performance with apple pulp waste: blue bar (period I)- HRT of 2 days with temperature of 30ᵒC; orange bar (period II)- HRT of 1 day with temperature of 30ºC; green bar (period III)- HRT of 1 day with temperature of 37ᵒC; yellow bar (period IV)- HRT of 1 day with temperature of 37ᵒC and micronutrients solution added; purple bar (period V)- HRT of 1 day, without micronutrients solution and temperature of 30ᵒC.
3.1.4 Gas composition
Carbon dioxide was the major gas detected with an average of 83.25±6.44%. This was expected since acidogenic bacteria produce carbon dioxide from sugars, VFAs and ethanol. Nitrogen and oxygen were also detected, with an average of 4.99±4.75% and 1.19±0.55%, respectively. Their presence may have resulted from the sampling technique. Hydrogen was detected on days 28 (18.32%), 43 (4.16%), 87 (14.06%) and 98 (15.79%). Its detection did not occur during all operational time may be due to hydrogen being very fleeting or maybe due to consumption of hydrogen by the acidogenic population. No methane detection is probable indication that there was no methanogenic activity in the acidogenic reactor during operational time.
0 2 4 6 8 10 12 1 6
11 16 21 26 31 36 41 46 51 56 61 66 71 76 81 86 91 96
T S S , V S S ( g /L) Time (d)
TSS influent VSS influent
0 2 4 6 8 10 12 1 6
11 16 21 26 31 36 41 46 51 56 61 66 71 76 81 86 91 96
T S S , V S S ( g /L) Time (d)
27
3.2 Methanogenic reactor with apple pulp waste
3.2.1 Organic matter conversion
The feed profile for the methanogenic reactor is presented in Figure 3.9. The main compounds were acetate (12.25±4.14% of CODsoluble_in), propionate (18.54±7.12% of CODsoluble_in), ethanol (38.08±16.34% of CODsoluble_in), butyrate (15.61±7.43% of CODsoluble_in) and valerate (9.33±4.05% of
CODsoluble_in). From day 83 onwards, lactate (0.16±6.62% of CODsoluble_in) was detected. Its presence
started to occur when the OLR increased in the acidogenic phase, resulting in more lactate production. Parawira et al. (2004) also observed that increasing the OLR, lactate started to be produced from solid potato acidification. VFAs (g COD/L) were the major part of CODsoluble in the influent (Figure 3.9) which indicates that there was no sugar present in the methanogenic influent. Throughout the operation, the concentration of VFAs in the influent did not change significantly.
28
Figure 3.9 - Methanogenic influent composition and concentration of its CODsoluble during the operational time with
apple pulp waste: blue bar (period I) - HRT 5 days with temperature of 30ºC, pH of 7.5 and influent of peach pulp; orange bar (period II) - HRT 5 days with temperature of 30ºC, pH of 7.5 and influent of apple pulp; green bar (period III) - HRT 2.5 days with temperature of 30ºC and pH of 7.5; yellow bar (period IV) - HRT 2.5 days with temperature of 37ºC; grey bar (period V)- HRT 2.5 days with temperature of 37ºC and pH of 8; purple bar (period VI)- HRT 2.5 days with temperature of 30ºC and pH of 8; black bar (period VII)- HRT 5 days with temperature of 30ºC and pH 8.
Figure 3.10 –Effluent composition of methanogenic phase with apple pulp waste and its CODsoluble concentration:
blue bar (period I) - HRT 5 days with temperature of 30ºC, pH of 7.5 and influent of peach pulp; orange bar (period II) - HRT 5 days with temperature of 30ºC, pH of 7.5 and influent of apple pulp; green bar (period III) - HRT 2.5 days with temperature of 30ºC and pH of 7.5; yellow bar (period IV) - HRT 2.5 days with temperature of 37ºC; grey bar (period V)- HRT 2.5 days with temperature of 37ºC and pH of 8; purple bar (period VI)- HRT 2.5 days with temperature of 30ºC and pH of 8; black bar (period VII)- HRT 5 days with temperature of 30ºC and pH 8; red bar (period VIII)- batch mode with temperature of 30ºC and pH of 8.
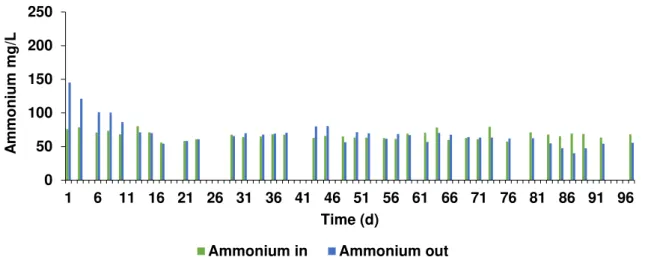
3.2.2 Ammonium and phosphorus
Ammonium and phosphorus were present in the influent (Figure 3.11 and Figure 3.12), and since both nutrients were present in the effluent, there was no nutrient limitation. However, during the
0 5 10 15 20 25 30 35
1 6 11 16 21 26 31 36 41 46 51 56 61 66 71 76 81 86 91 96
Inf luen t prof ile ( g CO Dsol /L) Time (d)
Lactate Acetate Propionate Ethanol
Butyrate Valerate COD Soluble
0 5 10 15 20 25 30 35
1 6 11 16 21 26 31 36 41 46 51 56 61 66 71 76 81 86 91 96
E ff luen t com p o sitio n (g CO Dsol /L) Time (d)
Lactate Acetate Propionate Ethanol
29 start up, the concentration of both nutrients was higher in the reactor (out) than in the influent (in) due to substrate acclimatization period where lysis of biomass (e.g acidogenic bacteria) may have occurred.
Figure 3.11- Ammonium concentration in the influent (in) and inside the reactor (out) of methanogenic phase with
apple pulp waste during the operational time.
Figure 3.12- Phosphorus concentration in the influent (in) and inside the reactor (out) of methanogenic phase with
apple pulp waste during the operational time.
3.2.3 Total suspended solids and Volatile suspended solids
The concentration of TSS and VSS in the influent of the methanogenic reactor presented an average 3.12±1.08 g COD/L and 2.74±1.06 g COD/L, respectively (Figure 3.13). These variations may have occurred due to less settable solids present in the effluent of the acidogenic reactor which in turn may have been influenced by the solids content of the waste apple pulp. Figure 3.14 presents the VSS profile for each height, and as expected, the VSS concentration was higher in height h0 (42.43±6.62 g/L), followed by height h1 (3.29±1.36 g/L), h2 (1.59±1.12 g/L) and h3 (1.76±0.78 g/L). The average of VSS was calculated and it is possible to see that the concentration of VSS in the reactor did not vary
0 50 100 150 200 250
1 6 11 16 21 26 31 36 41 46 51 56 61 66 71 76 81 86 91 96
A
mm
o
n
ium
mg
/L
Time (d)
Ammonium in Ammonium out
0 50 100 150 200 250
1 6 11 16 21 26 31 36 41 46 51 56 61 66 71 76 81 86 91 96
P
h
o
sph
o
ru
s
mg
/L
Time (d)
30 (Figure 3.14), except on days 85 and 87 which was probably caused by the OLR increase. These results indicate that methanogenic biomass was stable during the operational time.
Figure 3.13- Influent profile in terms of total suspended solids and volatile suspended solids along methanogenic
performance with apple pulp waste.
Figure 3.14- Profile of volatile suspended solids in each height and the average of volatile suspended solids inside
the methanogenic reactor with apple pulp waste throughout the operational time.
3.2.4 Biogas composition
The biogas composition during first 43 days was analysed. Already on day two of operational time, methane was detected (75.21%) which provided a good sign of methanogenic activity (Figure 3.15). On days 2, 28, 37 and 43 the percentages of methane and carbon dioxide were similar, 75.25±2.02% and 18.96±0.90%, respectively. From day 55 onwards, the biogas composition was determined online (Figure 3.16). The composition of methane increased on day 59 and can be related with the start of pH control at 8. On day 87, the highest methane percentage, 93.64%, was achieved and, consequently, the lowest percentage of carbon dioxide (7.76%).
0 2 4 6 8 10 12 1 6
11 16 21 26 31 36 41 46 51 56 61 66 71 76 81 86 91
T S S , V S S ( g /L) Time (d)
TSS influent VSS influent
0 10 20 30 40 50
1 6 11 16 21 26 31 36 41 46 51 56 61 66 71 76 81 86 91 96
V S S o f heig h ts, V S S av er age (g /L) Time (d)
31
Figure 3.15-Biogas composition in terms of oxygen, nitrogen, methane and carbon dioxide of acidogenic phase
with apple pulp waste.
Figure 3.16- Methane and carbon dioxide percentages of methanogenic phase with apple pulp waste.
3.2.5 Yield and productivity
The yield, productivity and biogas flowrate are presented in Figure 3.17. The average of yield and productivity along the operational time were 0.31±0.07 L CH4/g COD and 0.09±0.02 L CH4/L.h, respectively. The maximum biogas flowrate was 16.62 L/day on period IV.
Regarding the conditions imposed (Table 3.2), period IV presented the best values of yield and of productivity (period III only had one value, so it is difficult to assure that the yield of period III was higher
than the yield of period IV). Even the period IV being the best, the rise of temperature didn’t improve
the yield and productivity significantly. Increasing the pH to 8 (period V) resulted in a decrease of the yield and productivity. Controlling the pH at 8 may have increased the methane content (see section 3.2.4) but it did not improve the methanogenic reactor performance in terms of yield and productivity, only adding cost at the process due to a necessity of adding NaOH (5 M) solution. On the other periods (VI and VII), flowrate, yield and productivity decreased and that decline may have been influenced by the OLR increase in period VI, and consequently influenced the period VII. On period I there was no
0% 10% 20% 30% 40% 50% 60% 70% 80% 90% 100%
2 28 37 43
Time (d)
Oxygen Nitrogen Methane Carbon dioxide
0 10 20 30 40 50 60 70 80 90 100
55 57 59 61 63 65 67 69 71 73 75 77 79 81 83 85 87 89 91 93 95 97 99
%
Time (d)
32 yield and productivity values because methane percentage was not measured, and on period VII because biogas flow rate was not measured.
Figure 3.17- Biogas yield, productivity and flow rate of methanogenic phase with apple pulp waste along the
operational time: blue bar (period I) - HRT 5 days with temperature of 30ºC, pH of 7.5 and Influent of peach pulp; orange bar (period II) - HRT 5 days with temperature of 30ºC, pH of 7.5 and influent of apple pulp; green bar (period III) - HRT 2.5 days with temperature of 30ºC and pH of 7.5; yellow bar (period IV) - HRT 2.5 days with temperature of 37ºC; grey bar (period V)- HRT 2.5 days with temperature of 37ºC and pH of 8; purple bar (period VI)- HRT 2.5 days with temperature of 30ºC and pH of 8; black bar (period VII)- HRT 5 days with temperature of 30ºC and pH 8.
Table 3.2- Averages of yield and productivity of methanogenic phase with apple pulp waste for each operational period. 0 2 4 6 8 10 12 14 16 18 0 0,1 0,2 0,3 0,4 0,5 0,6 0,7
0 4 8 12 16 20 24 28 32 36 40 44 48 52 56 60 64 68 72 76 80 84 88 92 96 100
Biog a s flo w rate (L/ da y ) Biog a s y ie ld (L CH 4 /g CO D), bi og a s p rodu tiv ity (L/ (L. h)) Time (d)
Produtivity Yield Biogas flowrate
Period Conditions Yield L CH4/g COD
Productivity L CH4/(L.h)
I VFAs from peach pulp; T 30ºC;
HRT 5 days; pH at 7.5
-a -a
II VFAS from acidogenic; Tº 30ºC; HRT 5 days; pH at 7.5
0.28±0.08 0.05±0.00c
III HRT 2.5 days; Tº 30ºC; pH at 7.5 0.34b 0.05b
IV HRT 2.5 days; Tº 37ºC; pH at 7.5 0.32±0.03 0.09±0.01
V HRT 2.5 days; Tº 37ºC; pH at 8 0.30±0.03 0.08±0.01
VI HRT 2.5 days; Tº 30ºC; pH at 8 0.26±0.00C 0.06±0.01
VII HRT 5 days; Tº 30ºC; pH at 8 0.29 0.05±0.05
VIII In batch; Tº 30ºC; pH at 8 -a -a