Sara Alexandra Anacleto Mateus
Bachelor Degree in Biomedical Sciences
From fruit pulp wastes to biomethane: assessment of
substrate shifts on the performance of a two-stage
anaerobic
system
and
biogas
upgrading
studies
Dissertation to obtain Master Degree in Biotechnology
Supervisor: Joana Cassidy, Post-doctoral researcher, FCT/UNL
Co-supervisor: Mónica Carvalheira, Post-doctoral researcher, FCT/UNL
Jury:
President: Prof. Dr. Ana Cecília Afonso Roque Examiner: Prof. Dr. Ana Luísa Almaça da Cruz Fernando
Supervisor: Dr. Joana Sofia Cassidy
Faculty of Sciences and Technology
NOVA University of Lisbon
From fruit pulp wastes to biomethane: assessment of substrate shifts on the performance of
a two-stage anaerobic system and biogas upgrading studies
Copyright © Sara Mateus, Faculdade de Ciências e Tecnologia, Universidade Nova de
Lisboa
Agradecimentos
O presente trabalho representa a conclusão de um ciclo. Uma caminhada enriquecedora, não só pelos conhecimentos que adquiri como pelas pessoas que tive oportunidade de conhecer e que me apoiaram na realização deste trabalho.
Em primeiro lugar, gostaria de agradecer à Professora Maria Ascensão Reis pela oportunidade de integrar no excelente grupo de investigação BIOENG, o que me permitiu adquirir valiosos conhecimentos e competências.
Agradeço à empresa Sumol+Compal por ter gentilmente fornecido os resíduos de polpa de fruta usados neste trabalho.
Às minhas orientadoras, Joana e Mónica, mil obrigadas. No que toca às duas pessoas que mais me ensinaram e apoiaram durante a realização deste trabalho, quaisquer palavras parecem ficar aquém. Agradeço-vos pela disponibilidade e dedicação, pela preciosa partilha de conhecimentos, infinita paciência e amizade. À Joana, um especial agradecimento pela motivação nos momentos mais difíceis e por fomentar o rigor e espírito crítico que me tornarão numa melhor profissional. À Mónica, um especial agradecimento pelo carinho e constante preocupação e pela total disponibilidade e apoio no trabalho laboratorial ao longo deste ano.
Agradeço à Luísa Neves por me abrir as portas para conhecer um pouco do mundo das membranas, pela disponibilidade e simpatia. Agradeço também à Doutora Cláudia Pereira, pela ajuda na síntese e caracterização do MOF. À Rita Nabais, agradeço o apoio e paciência durante o tempo passado no laboratório 515. Agradeço à Ana Patrícia e à Inês por estarem sempre disponíveis para me ajudar. Gostaria também de agradecer às pessoas integrantes do grupo BIOENG com as quais partilhei o meu dia-a-dia no último ano. Obrigada pelos momentos de boa disposição, de partilha de experiências e de entreajuda. Em especial, ao Bruno e à Cláudia, agradeço a amizade, os sorrisos e o apoio durante este ano. Agradeço à Anouk todo o apoio e partilha de conhecimentos.
À Elsa Mora, Mónica Centeio e Nuno Costa, agradeço por arranjarem sempre um espacinho para as minhas amostras e pela disponibilidade para esclarecer todas as minhas dúvidas. Muito obrigada à Elisabete pela valiosa ajuda na realização do FISH.
Aos meus colegas e amigos do mestrado, muito obrigada pelas conversas, brincadeiras, desabafos e apoio durante os últimos 2 anos. Um especial agradecimento às melhores pessoas que o mestrado em Biotecnologia me trouxe: ao Bernardo, Eliana, Gonçalo A., Gonçalo T., Juliana, Rita e Vânia. Por fazerem sempre parte desta caminhada, mesmo que à distância, quero agradecer às 7 melhores amigas que Aveiro me deu. Aos meus amigos de Benavente, agradeço por continuarem perto mesmo quando estão longe. À Joana e à Inês, agradeço a amizade e carinho durante os últimos 17 anos. Aos meus companheiros de casa e grandes amigos, Liane e Mário, muito obrigada pelos bons momentos que passámos, por estarem sempre presentes e pela vossa amizade.
Abstract
Wastes with high organic content, such as food waste, are produced worldwide and can cause serious pollution problems when poorly managed. Thus, there is the need for the implementation of environmental friendly treatment systems for organic wastes. Anaerobic digestion has the potential to contribute for the sustainable treatment of these wastes while producing biogas which provides a renewable energy source, methane (CH4).
In this study, a two-stage anaerobic system was operated treating three different fruit pulp wastes (peach, raspberry and white guava) in a sequential operation. The effect of substrate shifts and different operational conditions, such as hydraulic retention time (HRT), organic loading rate (OLR) and pH on the system’s performance was assessed. The shift of substrates caused no long-term instability issues. The differences observed in the acidogenic performance in terms of gas production between substrates were considerable. Conversely, only slight differences were observed in fermentation products (FP) concentration and profiles. No evident association was found between pH and HRT/OLR changes on FP concentration and profiles in the range studied. Overall, the sugar removal efficiencies obtained were between 93.8 – 97.8% and the acidification degree varied between 53.7% – 76.4%. In regard to the methanogenic reactor, biogas production (3.6 – 12.8 L d-1) increased as OLR increased up to 7.4 g COD L-1,while CH4 yield (0.30 – 0.37 L CH4 g
-1
COD) and content (75.9 – 80.6%) remained approximately constant. Maximal chemical oxygen demand (COD) removal efficiency (around 93%) was achieved at HRTs of 8.6 and 5 days (OLR of 1.9 – 3.7 g COD L-1 d-1). Currently, there is the need to develop effective and economical viable solutions for biogas upgrading. Thus, gas permeation studies using mixed-matrix membranes (MMMs) with two different metal organic frameworks (MOFs) - MIL-53 and MOF-5 - were carried out in other to assess the potential for CH4
and carbon dioxide (CO2) separation. Matrimid®5218 with 10% (w/w) MIL-53 membrane showed the
best performance among the membranes tested.
Resumo
Os resíduos ricos em matéria orgânica, como resíduos alimentares, são constantemente produzidos mundialmente e podem causar graves problemas de poluição se não forem devidamente tratados. Assim, existe a necessidade de implementar sistemas de tratamento viáveis do ponto de vista ambiental e económico para os resíduos orgânicos. A digestão anaeróbia pode contribuir para o tratamento sustentável destes resíduos, fornecendo uma fonte de energia renovável, o metano, através da produção de biogás.
Neste estudo, três resíduos de polpa de fruta (pêssego, framboesa e goiaba branca) foram sequencialmente tratados num sistema de digestão anaeróbia de duas fases. Foi avaliado o efeito de mudanças de substrato e de condições operacionais como o tempo hidráulico de retenção, a carga orgânica e pH no desempenho do sistema. A mudança de substrato não causou instabilidade no sistema a longo prazo. Em relação ao reator acidogénico, foram detetadas diferenças consideráveis na produção de gás entre substratos. No entanto, apenas foram detetas diferenças ligeiras na produção e perfil dos produtos de fermentação. Na gama estudada, não foi encontrada uma associação evidente entre o pH ou o TRH/carga orgânica e a produção e perfil dos produtos de fermentação. Foram obtidas remoções de açúcar entre 93.8 – 97.8% e graus de acidificação entre 53.7% – 76.4%. Em relação ao reator metanogénico, a produção de biogás (3.6 – 12.8 L d-1) aumentou com o aumento da carga orgânica até 7.4 g CQO L-1 enquanto que o rendimento em metano (0.30 – 0.37 L CH4 g
-1
CQO) e a sua percentagem se manteve aproximadamente constante (75.9 – 80.6%). A remoção de carência química de oxigénio (CQO) foi máxima (aproximadamente 93%) operando a TRHs de 8.6 e 5 dias (carga orgânica de 1.9 – 3.7 g CQO L-1 d-1).
Atualmente, existe a necessidade de desenvolver soluções eficazes e economicamente viáveis para o processo de purificação de biogás. Como tal, estudos de permeação gasosa usando membranas de matriz mista com diferentes metal organic frameworks (MIL-53 e MOF-5) foram conduzidos de forma a avaliar o seu potencial para a separação de metano e dióxido de carbono. A membrana Matrimid®5218 com 10% (m/m) MIL-53 foi a que demostrou um desempenho superior.
List of contents
Introduction ... 1
1.1
Problem statement ... 3
1.2
Anaerobic digestion process ... 4
1.2.1
Microbiological aspects and main pathways of anaerobic digestion ... 5
1.2.2
Two–stage anaerobic digestion system ... 6
1.2.3
Environmental and operational conditions ... 8
1.3
Biogas upgrading ... 10
1.3.1
Membrane-based processes ... 11
1.4
Scope of the thesis ... 11
2
Materials and methods ... 13
2.1
Operation of a two-stage anaerobic digestion system ... 15
2.1.1
Substrate and inoculum ... 15
2.1.2
Experimental setup and operation ... 15
2.1.3
Analytical methods ... 17
2.1.4
Microbial community analysis by FISH ... 20
2.1.5
Calculations ... 20
2.2
Biogas upgrading using mixed matrix membranes with MOFs ... 21
2.2.1
MOF-5 synthesis and characterisation ... 21
2.2.2
Membrane preparation ... 21
2.2.3
Membrane characterisation ... 22
2.2.4
Gas permeation experiments ... 22
2.2.5
Calculations ... 23
3
Results and discussion ... 25
3.1
Fruit pulp waste characterisation ... 27
3.2
Acidogenic fermentation – The effect of pH and HRT/OLR changes when
treating different substrates ... 28
3.2.1
Sugar and protein removal ... 30
3.2.2
FP concentration and profiles ... 32
3.2.3
Gas production and composition ... 36
3.2.4
Substrate shifts – The effect on FP composition and reactor stability ... 40
3.3
Methanogenic operation – Biogas production and overall process efficiency . 42
3.3.1
FP removal and COD removal efficiencies ... 43
3.3.2
Biogas production and composition ... 46
3.3.3
Nutrients concentration and biomass composition ... 50
3.4
Biogas upgrading – Performance assessment of MMMs with MOFs on CH
4and
CO
2separation ... 53
3.4.1
MOF-5 characterisation ... 53
3.4.2
MMMs characterisation and performance on single gas permeation studies ... 53
4
Conclusions ... 58
5
Future work ... 62
List of figures
Figure 1.1 Main stages and the microorganisms involved in the anaerobic digestion process. ... 5
Figure 2.1 Schematic representation of the two-stage anaerobic system ... 16
Figure 2.2 Schematic representation of the single gas permeation instalation. ... 22
Figure 3.1 FISH image of the abundance of Archaea targeted by ARC915 ... 28
Figure 3.2 Average FP (●), total sugar (Tsugar) (▲) and total protein (Tprotein) (✕) concentrations in the influent in every condition tested in the acidogenic reactor. ... 29
Figure 3.3 (A) Phosphorus and (B) ammonium concentrations in the influent (▲) and in the fermentation broth (●) during the 285 days of operation under different operational contidions. ... 31
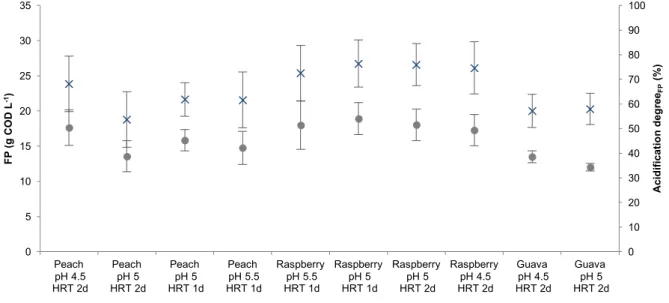
Figure 3.4 Average FP concentration in the fermentation broth (●) and acidification degree (✕) in every condition tested in the acidogenic reactor ... 33
Figure 3.5 Average influent (A) and average fermentation broth (B) composition in terms of FP profiles obtained for each condition tested in the acidogenic reactor. ... 35
Figure 3.6 Average acidogenic gas production in each condition tested, in chronological order.. 37
Figure 3.7 Average acidogenic gas composition in each condition tested, in chronological order. ... 38
Figure 3.8 FISH image of the abundance of Firmicutes targeted by LGC0355 ... 39
Figure 3.9 Influent (A) and fermentation broth composition (B) in terms of FP and sugar concentration and profiles regarding the first substrate shift: peach to raspberry. ... 41
Figure 3.10 Influent (A) and fermentation broth composition (B) in terms of FP and sugar concentration and profiles regarding the second substrate shift: raspberry to white guava. .. 41
Figure 3.11 Fermentation broth (A) and effluent (B) FP concentration and profiles in the methanogenic reactor during the 178 days of operation under different operational contidions ... 44
Figure 3.12 COD variation in the fermentation broth (▲) and reactor (●) and COD removal efficiency (✕) during 178 days of operation under different operational contidions ... 45
Figure 3.13 Biogas production parameters in each condition tested: Gas production (●), CH4 yield (✕), CH4 productivity (▲) and energy recovery (■). ... 47
Figure 3.14 Average biogas composition produced in the methanogenic reactor in each condition tested, in chronological order.. ... 48
Figure 3.15 (A) Phosphorus and (B) ammonium concentrations in the fermentation broth (▲) and in the effluent (●) during the 178 days of operation under different operational contidions. .. 50
Figure 3.16 VSS concentration in the methanogenic reactor at different heights from the bottom of the reactor: h0 (0 cm); h1 (10 cm); h2 (17 cm) and h3 (25 cm). ... 51
Figure 3.17 XRD pattern of the synthesised MOF-5. ... 53
Figure 3.18 Contact angles of the membranes (A) Matrimid®5218+MIL-53 (B) Matrimid®5218+MOF-5. ... 54
Figure 3.19 CO2 (▲) and CH4 (●) permeabilities in membranes with increasing MOF loadings, at 30 ºC. (A) Results regarding Matrimid® 5128+MIL-53 membranes; (B) Results regarding Matrimid® 5128+MOF-5 membranes. ... 55
List of tables
Table 1.1 Examples of microorganisms responsible for each stage of AD ... 6
Table 2.1 Operational conditions used in the acidogenic reactor ... 17
Table 2.2 Operational conditions used in the methanogenic reactor ... 17
Table 3.1 Characterisation of the different fruit pulp wastes treated in the two-stage AD system. 27
Table 3.2 Acidogenic influent characterisation for each fruit pulp waste. ... 29
Table 3.3 Acidogenic reactor's performance in different operational conditions after biomass acclimatisation. ... 30
Table 3.4 Microbial community in the acidogenic reactor – qualitative analysis based on FISH. . 39
Table 3.5 Methanogenic reactor’s performance (COD removal and biogas parameters) in different operational conditions.. ... 42
Table 3.6 Examples of the use of two-stage anaerobic digestion systems to treat real wastes. .. 49
Table 3.7 Microbial community in the methanogenic reactor – qualitative analysis based on FISH. ... 52
Table 3.8 Permeability and selectivity of the membranes synthesised using different MOF
List of Abbreviations
aCO2/CH4
AD COD CSTR EtOH FISH FP FVW FW GC HAc HBut HLac HOrg HRT HPr HVal MMM MOF OLR PCO2 SCOD TCOD TS TSS VFA VS VSS
Ideal selectivity of CO2 over CH4
Anaerobic digestion Chemical oxygen demand Continuous stirred-tank reactor Ethanol
Fluorescence in situ hybridisation Fermentation products
Fruit and vegetable waste Food waste
Gas chromatography Acetic acid
Butyric acid Lactic acid Organic acid
Hydraulic retention time Propionic acid
Valeric acid
Mixed matrix membrane Metal organic framework Organic loading rate CO2 permeability
Soluble chemical oxygen demand Total chemical oxygen demand Total solids
Total suspended solids Volatile fatty acid Volatile solids
1.1 Problem statement
Population growth and subsequent industrialisation leads to the generation of enormous amounts of different types of waste which contribute to water and air pollution when unduly treated and discharged (Chan et al., 2009). According to Eurostat, 891 million tonnes of waste, excluding mineral waste, were generated in the European Union during 2014 (Eurostat, 2017).These wastes originated from diverse sectors, such as water and waste services, households and manufacturing activities. Conventional treatments such as incineration or landfills lead to the emission of greenhouse gases (GHG) and to the production of leachate (in the case of landfills) (Jiang et al., 2013 and references therein; Li et al., 2017 and references therein; Sen et al., 2016). On the other hand, most wastewaters are treated in centralised plants which implies not only transportation costs but also the consumption of water and energy (Paudel et al., 2017). The waste and wastewater generated from food industries, including fruit juice industries, usually have low pH and contain high amounts of organic matter, dissolved and suspended solids, oil and grease (El-Kamah et al., 2010; Ozbas et al., 2006). Hence, the generated waste needs appropriate treatment in order to meet the legislation for discharge in water or for reuse for agricultural application (El-Kamah et al., 2010). In this sense, taking into account the problems associated with current treatment strategies, there is a need to develop economic and environmental sustainable treatment technologies to be applied in industry facilities. The need to implement these treatment processes has been recognised since 1997 when incentives were created under the Kyoto Protocol to reward the companies that develop and use on-site treatment systems (Chan et al., 2009).
In this context, the importance of circular economy and biorefineries is increasing. Circular economy is slowly substituting the present linear economic model of “take-make-consume-dispose” with a sustainable approach which is meant to maintain and retain the value of materials and products (EEA, 2016). Thus, an integrated system for the treatment of wastewaters and other wastes with resources recovery or production is an essential contribution for a global sustainable development (Batstone and Virdis, 2014; Puyol et al., 2017). Examples of integrated systems include the production of biopolymers, the recovery of nutrients such as nitrogen and phosphorus and the generation of bioenergy as biohydrogen and biogas through photo and dark fermentation and anaerobic digestion (AD), respectively (Puyol et al., 2017).
Among the examples referred above, biogas production can contribute to overcome the current energy crisis. Presently, energy demands are met relying mostly on exhaustible fossil fuels’ combustion which releases GHG, such as carbon dioxide (CO2), thus actively contributing to air
the EU in 2014 showing an important increase when comparing to the 3% obtained in 2000 (Eurostat, 2016).
Taking into account the problems exposed, the present work aimed at achieving the concomitant treatment of fruit juice industry wastes and the production of biogas through AD at laboratory scale. Furthermore, as the removal of CO2 from biogas is an essential and current limiting step for its
commercial application, the development of membranes for biogas upgrading was also performed. When applied at industrial scale, this AD system would enable the on-site treatment of wastes reducing the amount of wastes discarded to municipal treatment facilities and related costs. Moreover, the biogas produced could be directly used on-site to provide energy for the AD system itself, for heating and electricity or as vehicle fuel and natural gas after upgrading.
1.2 Anaerobic digestion process
AD is a complex synergetic biological process that occurs in the absence of oxygen. In AD, a consortium of facultative and strict anaerobic microorganisms converts organic matter into biogas (Chiu and Lo, 2016; Tauseef et al., 2013). Biogas is mainly composed of methane (CH4) (60 – 70 %)
and CO2 (30 – 40 %), with trace amounts of hydrogen sulphide (H2S), ammonia (NH3), hydrogen (H2),
nitrogen (N2) and carbon monoxide (CO) (Sun et al., 2015). AD occurs naturally in environments such
as watercourses, swamps and ponds (Christy et al., 2014). However, human activities as petroleum and natural gas production, landfills, animal husbandry and waste management are responsible for around 90% of global CH4 emissions (Zhou et al., 2017 and references therein). The uncontrolled
release of CH4 constitutes an environmental concern since it is a GHG whose greenhouse warming
potential (GWP) is 23 times higher than CO2 (van Lier, 2008). However, its controlled production
al., 1995; Wu et al., 2016) waste vegetable oil and pig manure (Hidalgo et al., 2014), dairy (Ince, 1998) and agricultural residues (Parawira et al., 2008).
1.2.1 Microbiological aspects and main pathways of anaerobic digestion
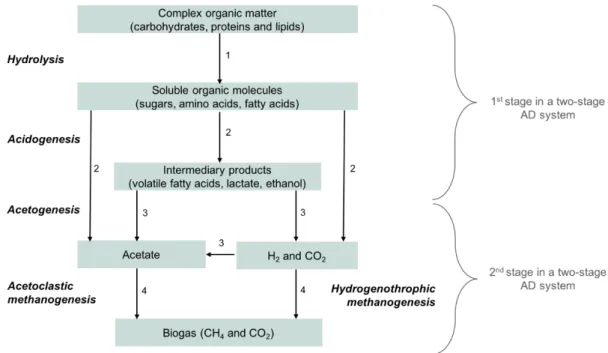
The AD process involves four main steps, where organic matter is converted to biogas: hydrolysis, acidogenesis, acetogenesis and methanogenesis (Figure 1.1). The inherent biochemical transformations occur due to the presence of different groups of microorganisms (Table 1.1).
During hydrolysis, complex polymers are digested into soluble molecules by hydrolytic exoenzymes (such as cellulases, lipases, proteases) which are secreted by hydrolytic bacteria (van Lier et al., 2008). Degradation of recalcitrant substances namely cellulose and lignin is relatively slow, possibly being a rate limiting step (Amani et al., 2010). However, when the substrates have low cellulose content such as in FVW, methanogenesis is the rate limiting step (Bouallagui et al., 2005). Acidogenic bacteria convert the hydrolysis products in various organic acids (HOrgs) (e.g. lactic, acetic, butyric, propionic and valeric acids), alcohols, CO2 and H2. Acidogenesis is usually the fastest stage of AD as
acidogenic microorganisms present thirty to fortyfold higher growth rates when compared to methanogenic microorganisms. Moreover, acidogens are able to resist extreme conditions like high temperature, low pH and high organic loading rates (OLRs) (Amani et al., 2010).
Figure 1.1 Main stages and the microorganisms involved in the anaerobic digestion process. 1. Hydrolytic bacteria; 2. Acidogenic bacteria; 3. Acetogenic bacteria; 4. Methanogens (Adapted from Cassidy, 2014 and Gerardi, 2003)
The third step of AD, acetogenesis, is characterised by the conversion of organic acids and alcohols into acetate, H2 and CO2 (Cazier et al., 2015). Between 25 – 55ºC, the free energy associated with the
conversion of propionate and butyrate to acetate and H2 is positive (∆G > 0), i.e., these conversions
are unfavourable reactions. Low H2 concentration, i.e, less than 10 -4
pressure is maintained by the syntrophic relationships between H2-producers and H2-consumers,
termed as interspecies hydrogen transfer, where hydrogenotrophic methanogens consume the H2
produced by acidogens and acetogens (Metcalf&Eddy, 2003 and references therein).
Hydrogenotrophic and acetoclastic methanogens are the two main groups of methanogenic archaea responsible for the production of CH4 (and CO2, H2 and other residual gases) during methanogenesis
(Gonzalez-Martinez et al., 2016; Goswami et al., 2016). Hydrogenotrophic methanogens produce CH4
using H2 as the electron donor and CO2 as electron acceptor, while acetoclastic methanogens convert
acetate into CH4 through decarboxylation (Metcalf & Eddy, 2003). Acetate degradation is usually
responsible for 65% to 95%of CH4 production when there is a limited supply of H2 in the reactor
(Amani et al., 2010 and references therein).
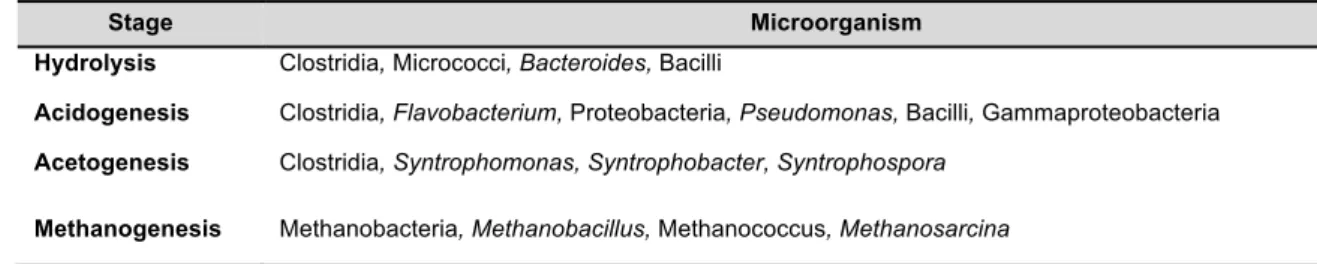
Table 1.1 Examples of microorganisms responsible for each stage of AD (Christy et al., 2014; Divya et al., 2015)
1.2.2 Two–stage anaerobic digestion system
AD is typically conducted in a single reactor system. However, the microorganisms involved in AD are distinct in terms of physiology, growth kinetics, nutritional needs and sensibility to environmental conditions (Demirel and Yenigün, 2002). Thus, in a single reactor, the microorganisms are not subjected to their growth and activity optimum conditions (temperature, pH, OLR), which can cause stability and control issues throughout the operation (Khan et al., 2016). In order to provide the optimal conditions for each group of microorganisms, a two-stage anaerobic digestion system was proposed by Pohland and Ghosh (1979) in which the hydrolysis and acidogenesis stages are physically separated from the methanogenesis stage using two reactors (Figure 1.1) (Lindner et al., 2016 and references therein).
In a two-stage AD system, organic matter is hydrolysed and converted to HOrgs in the first reactor by hydrolytic and acidogenic bacteria while methanogenic archaea produce CH4 from acetate (converted
from HOrgs by acetogenic bacteria) and H2 in the second reactor (Gonzalez-Martinez et al., 2016).
Both reactors can be inoculated with the same anaerobic biomass, coming from one-stage AD systems. However, as each reactor is operated in specific conditions for the microbial community of interest, there is an enrichment of each community in its respective stage (Solera et al., 2002). For instance, the low pH and shorter hydraulic retention time (HRT) and, consequently, higher OLR normally imposed in the acidogenic reactor prevents methanogens’ survival in this stage. Likewise, as the substrate for acidogens is almost completely consumed in the acidogenic reactor, these bacteria are not able to thrive in the methanogenic reactor (Dareioti et al., 2009).
Stage Microorganism
Hydrolysis Clostridia, Micrococci, Bacteroides, Bacilli
Acidogenesis Clostridia, Flavobacterium, Proteobacteria, Pseudomonas, Bacilli, Gammaproteobacteria
Acetogenesis Clostridia, Syntrophomonas, Syntrophobacter, Syntrophospora
In a single reactor, the increase of OLR causes kinetic imbalances since methanogens grow considerably slower than acidogens (Ghosh et al., 1985). The fast production of volatile fatty acids (VFAs) by acidogens can result in the accumulation of VFAs at inhibitory levels for methanogens also leading to pH decrease and ultimately to process failure (Xiao et al., 2013; Zuo et al., 2015). In two-stage systems, the first phase works as a buffer of varying OLRs providing a more homogeneous influent for the second reactor (Demirel and Yenigün, 2002; Voelklein et al., 2016; Xiao et al., 2013). This configuration allows the treatment of higher OLRs, achieving higher COD removal efficiencies and CH4 production (Khan et al., 2016; Shen et al., 2013; Xiao et al., 2013). Although two-stage
systems involve higher initial building and maintenance costs, this configuration is still economically competitive with single stage systems (Ghosh et al., 1985; Ward et al., 2008). Two-stage systems are especially advantageous when treating easily hydrolysable substrates with a high sugar content and overall wastes with high organic content such FW (Grimberg et al., 2015; Lindner et al., 2016).
The separation of the acidogenic and methanogenic phase results in different contents of CO2, H2 and
CH4 in each phase. CO2 and H2 are the main gases produced in the first stage whereas CH4
production is minimised and in some cases not produced. The production of CO2 in the acidogenic
phase leads to the achievement of higher CH4 content in the biogas produced in the methanogenic
reactor, compared to single stage systems. Consequently, the costs and energy demand of the upgrading system for CO2 removal in two-stage systems is lower when compared to single-stage
systems, which is an important advantage since biogas upgrading can represent up to 30% of the costs of the whole system (Voelklein et al., 2016 and references there in).
Two-stage anaerobic systems have been successfully applied in the treatment of several wastes such as municipal solid wastes, agroindustrial and food residues (Dareioti et al., 2009 and references there in). Fu et al., (2017) compared the performance of single stage vs two-stage systems treating vinasses, an easily degradable waste. The two-stage operation presented a higher performance in terms of CH4 yield (10.8% higher), volatile solids (VS) removal efficiency (10.4% higher) and energy
recovery (12.9% higher). Moreover, the lag-phase was 9.1 days shorter in the two-stage system than in the one stage system. In another study, treating synthetic FW, the two-stage system showed higher tolerance to organic loading shocks and higher CH4 production than the one stage system
1.2.3 Environmental and operational conditions
The success of AD depends on several factors, such as the reactor configuration, mixing strategy and biomass growth systems. Furthermore, in order to assure process stability, some key parameters must be carefully controlled since microorganisms, especially methanogens, are very susceptible to environmental changes. These parameters include temperature, pH, nutrients, HRT and OLR.
1.2.3.1 Reactor configuration and mixing
AD systems can be categorised into “low rate” and “high rate” systems. Low rate systems are operated with long HRTs and are mainly used for the treatment of slurries and solid waste. Examples of this type of system include batch operation, accumulation, plug flow and continuous stirred-tank reactor (CSTR). High rate systems are operated at shorter HRTs including contact process, anaerobic filter, fluidised bed, upflow anaerobic sludge blanket (UASB) and expanded granular sludge bed (EGSB), which are mainly applied in wastewater treatment (De Mes et al., 2003). A key factor for high rate AD systems success is the separation of the HRT from the solids retention time (SRT) accomplished through sludge retention (e.g. sedimentation, granulation) or the separation of bacterial sludge from the effluent for posterior recirculation to the reactor (Van Lier, 2008).
In order to facilitate the transfer of organic material and its contact with the active biomass, a mixing strategy, either continuous or intermittent, is advisable. Mixing also promotes the release of gas bubbles trapped in the broth and prevents sedimentation of particulate material (Ward et al., 2008). Mixing can be accomplished by mechanical mixers or by recirculation of the digestate or the produced gas (Rittmann and McCarty, 2001; Ward et al., 2008).
1.2.3.2 Anaerobic granular biomass
AD can be promoted in suspended growth systems or attached growth systems. In suspended growth systems, the microorganisms are suspended in the liquid (as flocs or granules) through mixing. In the attached growth systems, the microorganisms are attached to an inert material forming a biofilm (Metcalf&Eddy, 2003; van Lier, 2008). Granular sludge is associated to higher biomass retention times and resistance to higher OLRs and toxic shocks (Amani et al., 2010). Park et al (2016) also stated advantages of granular biomass concerning lag time and CH4 yield due to the close proximity of
microorganisms in the granule which improves the substrate mass transfer. Granules are densely aggregated structures formed by the self-immobilisation of microorganisms from different species organised in layers (Park et al., 2016). Some authors defend that acetoclastic methanogens are mainly situated in the inner layer of the anaerobic granules being protected from toxic materials, such as free ammonia and sulphide and also from high H2 concentrations. The second layer includes H2
-producing acetogens and H2-consuming methanogens and the outer layer contains fermentative
bacteria (Fang et al., 1994; Lim and Kim, 2014; Macleod et al., 1990; Park et al., 2016). The close proximity of H2-producing and H2-consuming microorganisms contributes for an efficient propionate
aluminium and ferrous ions) has been proved to improve granulation rates due to the reduction of electrostatic repulsion between negatively charged microorganisms (Amani et al., 2010).
1.2.3.3 Temperature
AD can be operated at mesophilic (35 – 40 ºC) or thermophilic (55 – 60 ºC) temperatures (Rittmann and McCarty, 2001). Temperature influences the enzymes’ activity, CH4 yield and effluent quality.
Slight variations as small as 1 ºC/day can lead to process failure in thermophilic operations (Zhang et al., 2014). On the other hand, temperature changes of +/- 3 ºC have no significant impact on the CH4
production under mesophilic operation (Weiland, 2010). Although thermophilic AD is associated to higher metabolic rates and CH4 productivities, it also requires higher investments and net energy
input, produces effluents with lower quality and is more susceptible to environmental conditions when compared with mesophilic AD (Mao et al., 2015).
1.2.3.4 pH and alkalinity
Microorganisms’ growth rates are greatly affected by pH and the optimal values for acidogens and methanogens are very different. This fact constitutes a main driver for the implementation of two-stage systems. In this configuration, the first reactor is usually operated at a pH of 4 – 6 favouring hydrolysis and acidification while the second reactor is operated at a neutral pH favouring methanogenesis (Voelklein et al., 2016 and references therein). As methanogenesis is considered a rate-limiting step and methanogens are more susceptible to pH changes, a neutral pH (7 – 8) is chosen for single stage operations (Weiland, 2010). At high pH values (> 8), methanogens’ activity can be inhibited due to ammonia toxicity, while at lower pH values, acidogenesis will prevail possibly leading to VFA accumulation which can result in a further pH drop (Khanal, 2008). Nonetheless, a high alkalinity, i.e. buffering capacity is able to protect the system against these rapid pH drops and depends on the equilibrium of gaseous CO2 and bicarbonate ions (Ward et al., 2008). In a properly operating reactor,
alkalinity should vary between 2000 and 4000 mg L-1 of CaCO3 (APHA, 1999). Alkalinity may be
self-generated by the system (natural alkalinity) through the degradation of organic matter, mainly when treating wastes rich in organic nitrogen (e.g. protein). Alternatively, the addition of chemicals (e.g. sodium bicarbonate, hydroxide-based chemicals) contributes for the increase of alkalinity (Khanal, 2008).
1.2.3.5 Nutrients
1.2.3.6 HRT and OLR
HRT corresponds to the time that a soluble component remains in the reactor and should be optimised in order to allow the complete degradation of the organic matter. This parameter is mathematically defined by the equation HRT = V/Q, where V is the reactor volume and Q represents the influent flow rate (Abdelgadir et al., 2014; Mao et al., 2015). The optimal HRT value depends on influent composition, process details and temperature (Amani et al., 2010). OLR depends on the HRT and on the chemical oxygen demand (COD) concentration of the substrate (Paudel et al., 2017) and is commonly considered as the COD concentration of the influent entering the reactor per day under continuous feeding (Mao et al., 2015). Fluctuations in loading rates can negatively impact the balance between acidogenesis and methanogenesis in single stage reactors. Acidogens are able to operate at high loading rates producing an amount of VFAs which methanogens may not be able to consume given their slower growth rates (Metcalf&Eddy, 2003). A low OLR and high HRT may be a safe strategy to obtain constant and maximal CH4 yields (Mao et al., 2015). However, it is desirable to
achieve a short HRT reducing the reactor volume and the capital costs which will allow the treatment of higher amounts of waste (Speece, 1983).
1.3 Biogas upgrading
Biogas must be cleaned and upgraded to biomethane in order to be used as natural gas or achieve vehicle fuel standards. For instance, it is necessary to obtain concentrations of CH4 >80 – 96%, CO2
<2 – 3%, O2 <0.2 – 0.5%, H2S <5 mg m –3
, NH3 <3 – 20 mg m –3
to be used as vehicle fuel (Chaemchuen et al., 2016). Biogas purification aims the removal of trace compounds and biogas upgrading is focused on the separation of CH4 and CO2 in order to enhance the calorific value
improving the combustion efficiency (Andriani et al., 2014; Ryckebosch et al., 2011). Although CH4 is
the compound of interest for energy production, CO2 can also be used in industrial applications such
as enhanced oil recovery and sodium bicarbonate production (Sun et al., 2015). Indeed, the revalorisation of CO2 is also important to further reduce GHG emissions, since most of CO2 is still
released into the atmosphere. Hence, some biogenic carbon sequestration methods are being investigated, such as CO2 enrichment of anaerobic processes for further CH4 production
(Alimahmoodi and Mulligan, 2008; Fernández et al., 2015) and CO2 uptake by microalgae (Bahr et al.,
2014; Meier et al., 2015; Yan et al., 2016).
Several upgrading technologies, such as physical and chemical CO2-absorption, Pressure Swing
Adsorption (PSA), cryogenic separation and membrane processes are used for CO2 removal. The
selection of the technology to be implemented relies not only on the highest achievable CH4 content
1.3.1 Membrane-based processes
Membrane-based gas separation processes are based on the faster selective permeation of certain gases present in a mixture through a barrier under an external driving force (e.g. partial pressure, concentration or chemical potential gradient). In biogas upgrading using membranes, CO2 permeates
through the membranes while CH4 is retained. In this type of separations, contaminants such as water
vapour and N2 are also eliminated (Zhou et al., 2017). Membranes can be classified as polymeric (e.g.
polyacetylenes, polyimides) or inorganic membranes (e.g. zeolite, sol-gel derived, zirconia). Although the latter usually offers superior selectivities and permeabilities, polymeric membranes are the most used industrially as they are cheaper, easier to produce, easily scalable and present an excellent mechanical stability (Andriani et al., 2014; Scholz et al., 2013; Zhou et al., 2017). The main drawback of polymeric membranes is the trade-off between permeability and selectivity, as shown by Robeson (2008). In order to improve the characteristics of polymeric membranes, mixed matrix membranes (MMMs) are currently being investigated and are still not available commercially (Scholz et al., 2013). In MMMs, inorganic fillers are dispersed in the form of micro/nano-particles in a polymeric matrix (Zhou et al., 2017). In this way, MMMs combine the ease of fabrication of polymeric membranes and the superior transport properties of inorganic materials (Basu et al., 2011). Metal-organic frameworks (MOFs), which are crystalline and porous organic-inorganic hybrids formed by the coordination of metal ions with organic linkers, can be used as fillers for MMMs preparation (Chen et al., 2012 and references therein; Perez et al., 2009; Zhou et al., 2017). MOFs have large surface areas, controlled porosities and affinity for certain gases. Additionally, specific functional groups may be added to the MOF framework, optimising the pore size for extra affinity. MOFs have also showed promising results for size exclusion based gas adsorption (Dong et al., 2013 and references therein).
1.4 Scope of the thesis
This research focused on the operation of a two-stage anaerobic system at laboratorial scale treating different fruit pulp wastes from a juice industry in a sequential operation. As different fruits are harvested in specific seasons, it is almost impossible to operate the reactor for long periods of time using the same substrate. Therefore, it is important to study the effect of substrate shifts on the reactors performance and stability. Furthermore, gas permeation studies using MMMs were performed as preliminary steps for biogas upgrading.
2
2.1 Operation of a two-stage anaerobic digestion system
2.1.1 Substrate and inoculum
Fruit pulp waste (peach, raspberry and white guava) provided by Sumol+Compal Marcas S.A. (Almeirim, Portugal) was used as substrate in this study. Each fruit pulp waste was collected from the industry in a different season. The wastes were characterised (See Results and discussion section) and stored at -20 ºC until needed to prepare the influent. The influent was prepared three times per week diluting the fruit pulp waste with tap water (final concentration of 24 g COD L-1).Nitrogen (as ammonium chloride, NH4Cl) and phosphorus (as potassium di-hydrogen phosphate, KH2PO4) were
supplemented to the influent at a mg COD: mg N: mg P ratio of 100:0.5:0.1 or 100:1:0.2, depending on the fruit pulp waste. The prepared influent was kept at 4 ºC with constant mixing.
The acidogenic reactor was inoculated with flocular anaerobic sludge (1:3) obtained from an acidogenic bioreactor treating a mixture of winery wastewater and grape concentrate (day 0). Due to the low biomass concentration observed, non-acclimatised anaerobic sludge from an anaerobic digester of a local municipal wastewater treatment plant (Beirolas - Sacavém, Portugal) was added to the reactor (1:3) on day 15. The methanogenic reactor was inoculated with a mixture of granular (1:6) and flocular sludge (1:6), since the granules were mainly constituted by hydrogenotrophic microorganisms, which can lead to acetate accumulation. The granular sludge was collected from a Biobed Expanded Granular Sludge Blanket (EGSB) reactor treating brewery wastewater from a beer industry and the flocular anaerobic sludge was collected from an anaerobic digester of Mutela wastewater treatment plant (Almada, Portugal).
2.1.2 Experimental setup and operation
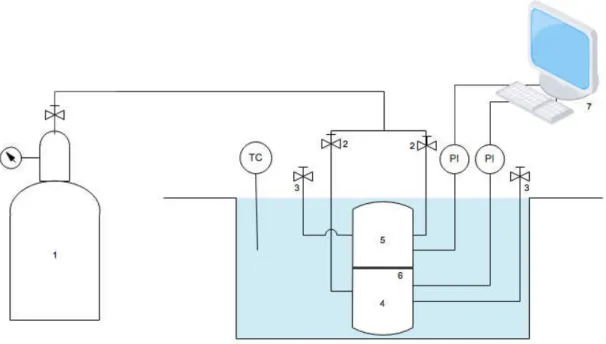
A two-stage CSTR-CSTR system (CSTR-5S, Bioprocess Control, Sweden) was operated in continuous mode at lab-scale with 5 L of working volume in each reactor. The first reactor corresponded to the acidogenic phase and the second reactor corresponded to the methanogenic phase. The overall system configuration is presented in Figure 2.1. Control parameters such as pH, temperature, biogas flow rate and biogas volume were continuously monitored online (Bioprocess Control software). The CH4 and CO2 content in the biogas produced in the methanogenic phase was
also monitored in real time (BenchOne Biogas, BlueSens, Germany). Both reactors were maintained at 30 ºC (mesophilic conditions) using a water bath system (CW-05G, Lab.companion, Jeio Tech, Korea). The pH was automatically controlled by the automatic addition of NaOH 5M.
Figure 2.1 Schematic representation of the two-stage anaerobic system: (1) Acidogenic influent container; (2) Acidogenic reactor; (3) Acidogenic settler; (4) NaOH solution bolttle; (5) Gas flowmeter; (6) Acidogenic clarified fermentation broth container; (7) Methanogenic influent container (i.e. acidogenic clarified fermentation broth); (8) Methanogenic reactor; (9) Methanogenic settler; (10) Gas analyser (CH4 and CO2); (11) Methanogenic effluent
container. Components not shown: computer for data acquisition; pH controller; water bath system.
Table 2.1 Operational conditions used in the acidogenic reactor
Substrate Period Time (d) pH HRT (d) (g COD LOLR -1 d-1)
Peach pulp waste
I 0-26
5.5 4 7.0 ± 0.9
II 27-35
2
11.9 ± 1.5
III 36-51 4.5 11.9 ± 1.1
IV 52-68
5.0 12.9 ± 2.4
V 69-82
1
25.7 ± 0.9
VI 83-110
5.5 24.1 ± 1.3
Raspberry pulp waste
VII 111-174 24.5 ± 4.2
VIII 175-208
5.0 23.7 ± 3.1
IX 209-234
2
11.9 ± 0.8
X 235-256
4.5 11.6 ± 0.5
White guava pulp waste
XI 257-271 11.9 ± 0.9
XII 272-285 5.0 10.7 ± 1.0
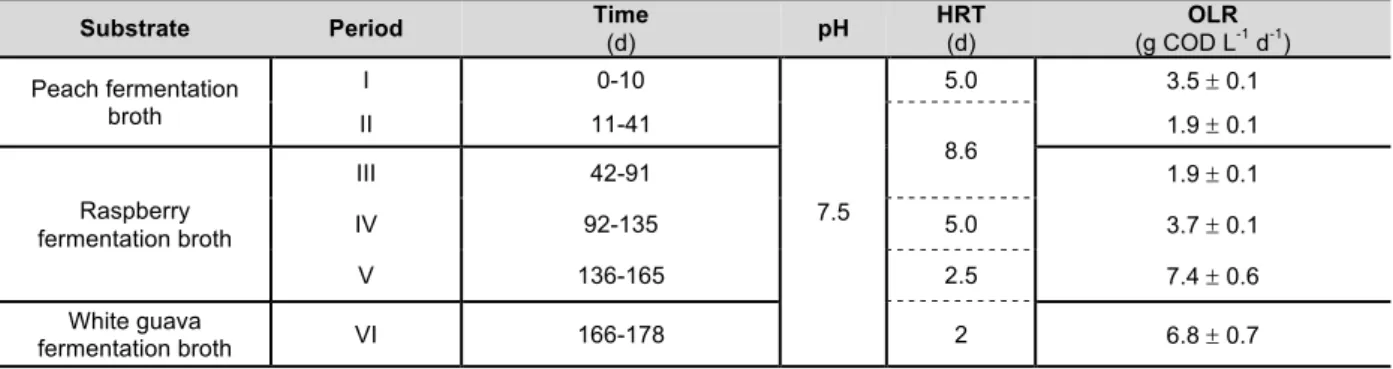
Table 2.2 Operational conditions used in the methanogenic reactor
Substrate Period Time
(d) pH
HRT (d)
OLR (g COD L-1 d-1)
Peach fermentation broth
I 0-10
7.5
5.0 3.5 ± 0.1
II 11-41
8.6
1.9 ± 0.1 Raspberry
fermentation broth
III 42-91 1.9 ± 0.1
IV 92-135 5.0 3.7 ± 0.1
V 136-165 2.5 7.4 ± 0.6
White guava
fermentation broth VI 166-178 2 6.8 ± 0.7
2.1.3 Analytical methods
Standard control parameters regarding AD experiments were monitored and quantified in order to assess reactor stability including the quantification of sugars, proteins, HOrgs and ethanol (EtOH), COD, ammonium nitrogen (NH4-N), orthophosphate (PO4-P), total suspended solids (TSS) and
2.1.3.1 Total and volatile solids and suspended solids
Total and volatile solids concentrations (TS and VS) were calculated for waste characterisation according to standard methods (APHA, 1999). In this analysis, TS was calculated after each well-mixed sample was placed in a weighed (Sartorius analytical scale) crucible and dried in the oven at 103 – 105 ºC overnight. For VS calculation, the crucible was further heated at 550 ºC for 2 hours and weighed again. TSS and VSS were also determined according to the standard methods (APHA, 1999) in order to monitor solids and biomass concentration. TSS and VSS analysis of the influents, reactors broth and clarified effluents was performed weekly and in duplicate. After weighing the glass fibre filters (1.2 µm, 47 mm), each well-mixed sample was filtered allowing the separation of TSS from total dissolved solids (TDS). After filtration, the filters were placed in aluminium dishes and dried at 103 – 105 ºC overnight. Filters were then weighed again for TSS determination and ignited at 550 ºC for 2 hours. At this temperature, the material that can be volatilised and burned off is mainly organic matter. Finally, a last weighing was performed and VSS concentration was determined. Due to the stratification of granular sludge in the second reactor, samples were collected at different heights, 0, 10, 17 and 25 cm from the bottom (h0, h1, h2 and h3, respectively). The average value for TSS and VSS in the methanogenic reactor was calculated following the trapezium rule.
2.1.3.2 COD
The Chemical Oxygen Demand (COD) measurement allows the quantification of the amount of organic matter present in the sample (De Mes et al., 2003). It takes into account the consumed amount of a certain oxidant when it reacts with the sample, being expressed in terms of its oxygen equivalence (APHA, 1999). COD concentration was measured by a colorimetric method using Hach Lange kits of the following concentration ranges: 5 – 60 g L-1 O2 and 50 – 300 mg L
-1
O2. Sample
preparation included filtration with a 0,2 µm syringe filter for soluble COD (SCOD) analysis and dilution according to the kit range. For total COD (TCOD) analysis, samples were not filtered. Samples were digested (Hach Lange HT 200S) at 170 ºC for 15 minutes. Finally, after cooling, COD concentration was measured using a spectrophotometer (Hach Lange DR 2800).
2.1.3.3 Organic acids and ethanol
Concentrations of acetic acid (HAc), butyric acid (HBut), lactic acid (HLac), valeric acid (HVal), propionic acid (HPr) and EtOH were determined by high performance liquid chromatography (HPLC), as described by Wang et al., (2017). A VWR Hitachi Chromaster chromatographer with an RI detector, a Biorad Aminex HPX-87H column (300 x 7.8 mm) and a Biorad pre-column (125-0129 30 x 4.6 mm) was used. The analysis was conducted at 30 ºC with sulphuric acid (H2SO4 0.005 M) as eluent at a 0.5
2.1.3.4 Sugars
Total sugar concentration was determined by Dubois method (Dubois et al., 1956), a colorimetric method based in a phenol-sulphuric acid reaction. A glucose solution was used as standard (3 – 100 mg L-1) (results in equivalents of glucose). All samples, except the acidogenic influent, were filtered (0.2 µm pore size filter). All samples were diluted according their range of sugar content. Phenol 5% (0.5 mL) and H2SO4 98% (2.5 mL) were added to 0.5 mL of sample and then placed in the dark for 10
minutes. After this time, the samples were mixed in a vortex and placed again in the dark for 30 minutes after which the colour was stable. Finally, the absorbance was measured at 490 nm in the Hach Lange DR 2800 spectrophotometer.
2.1.3.5 Nutrients
The nutrients (NH4-N and PO4-P) concentrations were determined by a colorimetric method
implemented in a continuous flow analyser (Skalar San ++, Skalar Analytical, The Netherlands), as described by Carvalheira et al., (2014). NH4-N and PO4-P concentrations were calculated using a
standard calibration curve of 4 – 20 mg L-1 of N or P. Sample preparation included centrifugation of the samples and the dilution of the supernatant with Milli-Q water.
2.1.3.6 Proteins
Protein concentration was determined using a modified Lowry protein assay (Lowry et al., 1951). This colorimetric method is based on two main reactions: reaction of protein with copper in alkaline solution and the reduction of the phosphomolybdic-phosphotungstic reagent by the copper-treated protein. The reagents used were: solution A (10 g Na2CO3 + 0.1 g C4H4KNaO6.4H2O + 500 mL NaOH 0.1 M);
solution B (0.5 g CuSO4.5H2O + 1 drop H2SO4 + 100 mL H2O); solution C (solution A + solution B in a
proportion of 50:1); solution D (Folin 50% (v/v)). A bovine serum albumin (BSA) solution was used as standard in the range of 6 – 200 mg L-1. Firstly, 1.5 mL of solution C was added to 500 µL of the diluted samples followed by mixture in the vortex and incubation in the dark for 10 minutes at room temperature. Next, 150 µL of solution D was added, mixed in the vortex and incubated in the dark for 30 minutes at room temperature. Finally, the absorbance was measured at 750 nm in the Hach Lange DR 2800 spectrophotometer.
2.1.3.7 Gas analysis
Gas chromatography (GC) was performed to evaluate the composition of the gas produced in both reactors in terms of CH4, CO2, O2, N2 and H2 content. The GC (Trace GC Ultra, ThermoFisher
2.1.4 Microbial community analysis by FISH
FISH was performed according to Amann (1995) aiming the identification of the microbial population in each reactor and possible variations associated with operational conditions’ changes. In this method, specific labelled probes are applied in the biomass samples allowing the observation and identification of the communities through fluorescence microscopy. Fresh biomass samples were fixed with paraformaldehyde (4%) and stored at -20ºC. The fluorescently labelled oligonucletotide probes used were: Fluorescein isothiocyanate (FITC)-labelled EUB338mix (Bacteria), Cyanine 3 (Cy3)-labelled ARC915 (Archaea), ALF968 (Alphaproteobacteria), BET42a (Betaproteobacteria), GAM42a (Gammaproteobacteria), DELTA495a (Deltaproteobacteria), CF319a (Cytophaga, Flavobacteria), LGC0355 (Firmicutes), BAC303 (Bacteroidaceae, Prevotellaceae), MX825 (Methanosaeta), MB1174 (Methanobacteriales), MG1200b (Methanomicrobiales), MS821 (Methanosarcina). Details about each probe are found at probeBase (Greuter et al., 2016). Samples were observed using an epifluorescence microscope Imager D2 (Zeiss, Germany), at 1000X.
2.1.5 Calculations
To assess the acidogenic reactor performance, some parameters were calculated namely acidification degree, sugar and protein removal. Acidification degree may be calculated through Equation 1 where [FP] is the sum of all FP concentrations in the reactor and [TCODin] is the total COD concentration in
the influent or by Equation 2 where [VFA] is the sum of all VFA concentrations. Sugar and protein removal was also determined following the general Equation 3 where X represents either sugar or protein.
Acidification degreeFP = [FP] [TCODin]
× 100, in % (Equation 1)
ºAcidification degreeVFA = [VFA]
[TCODin] × 100, in % (Equation 2)
RemovalX =[Xin] – [Xout]
[Xin ] × 100, in % (Equation 3)
COD removal, CH4 productivity and CH4 yield were determined in order to assess the performance of
the methanogenic reactor. The removal of organic matter in the methanogenic phase was calculated using Equation 4 which relates the soluble COD in the fermentation broth (SCODin) and in the effluent
(SCODout).
COD removal = SCODin - [SCODout] [SCODin]
CH4 productivity depends on the percentage of CH4 in the produced biogas, the biogas flow rate and
the reactor volume, as indicated in Equation 5. The CH4 yield calculation (Equation 6) takes into
account the same parameters as productivity but also the HRT and the difference between the SCOD in the fermentation broth and in the effluent (∆ COD ). Finally, energy recovery was calculated considering the energy value of CH4 as 37.38 kJ L
-1
(Fu et al., 2017), as indicated in Equation 7.
CH4 productivity = %CH4
100 × flow rate
Vreactor
, in L CH4 L-1d-1 (Equation 5)
CH4 yield = %CH4
100 × flow rate ∆ SCOD × Vreactor
× HRT, in L CH4 g-1 COD (Equation 6)
Energy recovery = CH4 yield × 37.38, in kJ g-1 COD (Equation 7)
2.2 Biogas upgrading using mixed matrix membranes with MOFs
2.2.1 MOF-5 synthesis and characterisation
MOF-5 (Zn4O(BDC)3) was synthesised according to Chen et al., (2010). Zinc nitrate hydrate,
Zn(NO3)2.xH2O (Sigma-Aldrich, USA, purity 99.999%) was mixed with terephthalic acid, H2BDC
(Sigma-Aldrich, USA, purity 98%) in N,N-Dimethylformamide, DMF (Honeywell, Germany, purity ≥ 99.8%) and distilled water. The molar ratio of Zn(NO3)2 : H2BDC : DMF : H2O was 1.0 : 0.76 : 175 :
12.8. The mixture was stirred to dissolve completely and transferred to Teflon-lined autoclaves which were heated at 120 ºC for 48h. After cooling to room temperature, the crystals were washed three times with DMF and dried at 150 ºC for 24h.
XRD patterns for MOF-5 characterisation were obtained using a MiniFlex II benchtop diffractometer (Rigaku Corportation, Japan) with CuKα radiation operating at 30 kV and 15 mA.
2.2.2 Membrane preparation
Mixed matrix membranes were prepared by the solvent evaporation method. Two MOFs were used as additives: MIL-53(Al) (Basolite® A100, Sigma-Aldrich) and MOF-5. Different additive loadings were tested namely 10%, 20% and 30 % (w/w). In general terms, a certain amount of Matrimid® 5218 (Huntsman Advance Materials, USA) was dissolved in a certain volume of dicloromethane (CH2Cl2).
2.2.3 Membrane characterisation
2.2.3.1 Contact angle
Contact angles measurements were carried out by the sensible drop method using a goniometer, as described by Couto et al., (2013), in order to evaluate the hydrophilic character of the membranes prepared. A drop of water was deposited on the membrane’s surface using a syringe. Images of the drop were acquired and processed by the software Cam2008 (KSV instruments, Finland) calculating the angles both on the right and left side of the drop. Each measurement contemplates a total of 10 frames with 1 second interval between them. Multiple replicates were performed for each membrane.
2.2.4 Gas permeation experiments
2.2.4.1 Single gas permeability
The pure gas permeability of the mixed matrix membranes for CO2 and CH4 was assessed using the
equipment described by Neves et al., (2010) and schematised in Figure 2.2. These gases were chosen for permeation studies since these are the most important in biogas upgrading. The apparatus is composed of a stainless cell with two identical compartments separated by the membrane to be tested. In order to measure the pure gas permeability, both compartments (feed and permeate) were initially pressurised with the gas. Then, the permeate outlet was open until a driving force of approximately 0.7 bar between the compartments was established. The pressure change in both compartments was recorded over time using two pressure indicators (Druck PCDR 910 models 99166 and 991675, UK) and the software LabVIEW (National Instruments, USA). Experiments were performed at a constant temperature of 30 ºC, maintained by a thermostatic water bath (Julabo, Model EH, Germany).
2.2.5 Calculations
Permeability is calculated according to Equation 8, where
∆p
0 and∆p
correspond to the difference between the pressure in the feed and permeate compartments (bar) at the initial instant (t0) and overtime, respectively, P is the membrane permeability (m2 s-1) and l is the membrane thickness (m). β is the geometric parameter and is calculated following Equation 9, where A is the membrane area (m2) and Vfeed and Vperm correspond to the volumes of feed and permeate compartments (m
3
), respectively. Permeability was obtained from the slope of the representation 1/ β ln (∆p0/∆p) versus t/l.
1 β
ln
∆p0
∆p
= P
t
l
(
Equation 8)β = A × 1
Vfeed
+
1Vperm , in m
-1 (Equation 9)
The ratio of the permeabilities of two pure gases, in this case CO2 and CH4, corresponds to the ideal
selectivity (α) as shown in Equation 10.
α
CO2/CH4=
PCO2PCH4 (Equation 10)
3
3.1 Fruit pulp waste characterisation
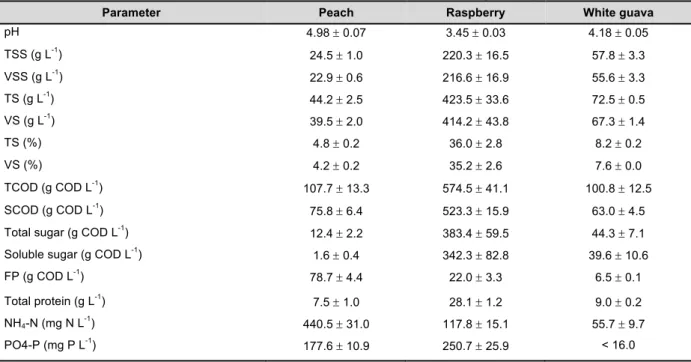
Peach, raspberry and white guava pulp wastes were used as substrate in this study. Substrate characterisation was essential for the adjustment of parameters such as influent dilution. The physiochemical composition of the fruit pulp wastes used in this work is presented in Table 3.1.
Table 3.1 Characterisation of the different fruit pulp wastes treated in the two-stage AD system.
Parameter Peach Raspberry White guava
pH 4.98 ± 0.07 3.45 ± 0.03 4.18 ± 0.05
TSS (g L-1) 24.5 ± 1.0 220.3 ± 16.5 57.8 ± 3.3
VSS (g L-1) 22.9 ± 0.6 216.6 ± 16.9 55.6 ± 3.3
TS (g L-1) 44.2 ± 2.5 423.5 ± 33.6 72.5 ± 0.5
VS (g L-1) 39.5 ± 2.0 414.2 ± 43.8 67.3 ± 1.4
TS (%) 4.8 ± 0.2 36.0 ± 2.8 8.2 ± 0.2
VS (%) 4.2 ± 0.2 35.2 ± 2.6 7.6 ± 0.0
TCOD (g COD L-1) 107.7 ± 13.3 574.5 ± 41.1 100.8 ± 12.5
SCOD (g COD L-1) 75.8 ± 6.4 523.3 ± 15.9 63.0 ± 4.5
Total sugar (g COD L-1) 12.4 ± 2.2 383.4 ± 59.5 44.3 ± 7.1
Soluble sugar (g COD L-1) 1.6 ± 0.4 342.3 ± 82.8 39.6 ± 10.6
FP (g COD L-1) 78.7 ± 4.4 22.0 ± 3.3 6.5 ± 0.1
Total protein (g L-1) 7.5 ± 1.0 28.1 ± 1.2 9.0 ± 0.2
NH4-N (mg N L-1) 440.5 ± 31.0 117.8 ± 15.1 55.7 ± 9.7
PO4-P (mg P L-1) 177.6 ± 10.9 250.7 ± 25.9 < 16.0
Although all substrates were fruit pulp wastes, their composition was different (Table 3.1). The amount of organic matter, in terms of COD, present in the raspberry pulp waste was approximately 5 times higher compared to the peach and white guava pulp wastes. Hence, considering that the influent concentration was maintained at a constant concentration of around 24 g COD L-1, a higher dilution was needed for the raspberry pulp waste, so a longer time was needed to treat the same amount of waste. The portion of SCOD in each pulp was also different. The SCOD/TCOD ratios were of around 70% for peach, 91% for raspberry and 63% for white guava. As soluble organic components are readily available for acidogenic microorganisms (Bouallagui et al., 2005), higher SCOD/TCOD ratios may contribute positively for the process. The wastes presented high VS/TS ratios of around 91%, 98% and 93% for peach, raspberry and white guava pulp waste, respectively. These high VS/TS ratios indicate a high organic matter content, making these wastes and FW, in general, suitable substrates for AD (Zhao et al., 2016).
Nutrients concentrations (PO4-P and NH4-N) were substantially different between wastes. For all pulp
differences could be related with the composition of the different fruits but also with the different pulp degradation stages. A higher degradation state was associated with high HOrgs content and low sugar content. Thus, as raspberry pulp waste was mainly composed by sugars it was considered to be in a low degradation state while peach pulp waste was mostly composed by HOrgs, suggesting a high degradation state.
3.2 Acidogenic fermentation – The effect of pH and HRT/OLR changes
when treating different substrates
In the present study, different pH values (4.5, 5.0, 5.5) and HRTs (1 and 2 days) were tested when treating different fruit pulp wastes in the acidogenic reactor in order to study the effect of the operational conditions on the reactor’s performance. OLR variations were associated with HRT changes since influent COD concentration was maintained at 24.5 ± 3.2 g COD L-1.
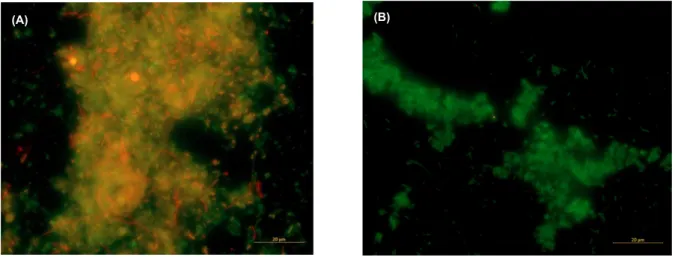
Due to the partial re-inoculation on the 15th day of operation, an increase in CH4 production was
observed in the acidogenic reactor. The latter was due to the visible presence of methanogens as confirmed by FISH analysis (Figure 3.1 A). CH4 content remained high during the start-up (pH of 5.5
and HRT of 4 days) and the second condition tested (pH of 5.5 and HRT of 2 days). The selection of fermentative bacteria in the first reactor is essential in two-stage anaerobic systems (Gonzalez-Martinez et al., 2016) thus, the pH was further decreased to 4.5. After twelve days, the CH4 content in
the produced gas decreased from 80.1% to 27.4%. The reduction of methanogenic population was also confirmed by FISH analysis (Table 3.4 and Figure 3.1). This reduction might also be associated with the longer time of operation and not uniquely with the change of conditions.
Figure 3.1 FISH image of the abundance of Archaea targeted by ARC915 on (A) day 16 (the day after the partial re-inoculation using peach pulp waste at pH 5.0 and HRT of 4 d) and on (B) day 42 (middle of the condition using peach pulp waste at pH 4.5 and HRT of 2 d). Archaea are shown in red and bacteria in green. Bar = 20 µm.
It is important to point out that after thawing and preparation of the influent, the latter (especially for raspberry) suffered a continuous degradation by feed-associated microorganisms. This degradation was observable by a reduction of sugar content and an increase of FP concentrations (mainly HLac and EtOH) present in the influent. Hence, the acidogenic reactor’s influent composition was not stable throughout the reactor operation as shown in Figure 3.2. The instability in the influent composition also occurs in an industrial setting, thus the present lab-scale work mimics a real full-scale situation. The characterisation of each fruit pulp waste influent is presented in Table 3.2.
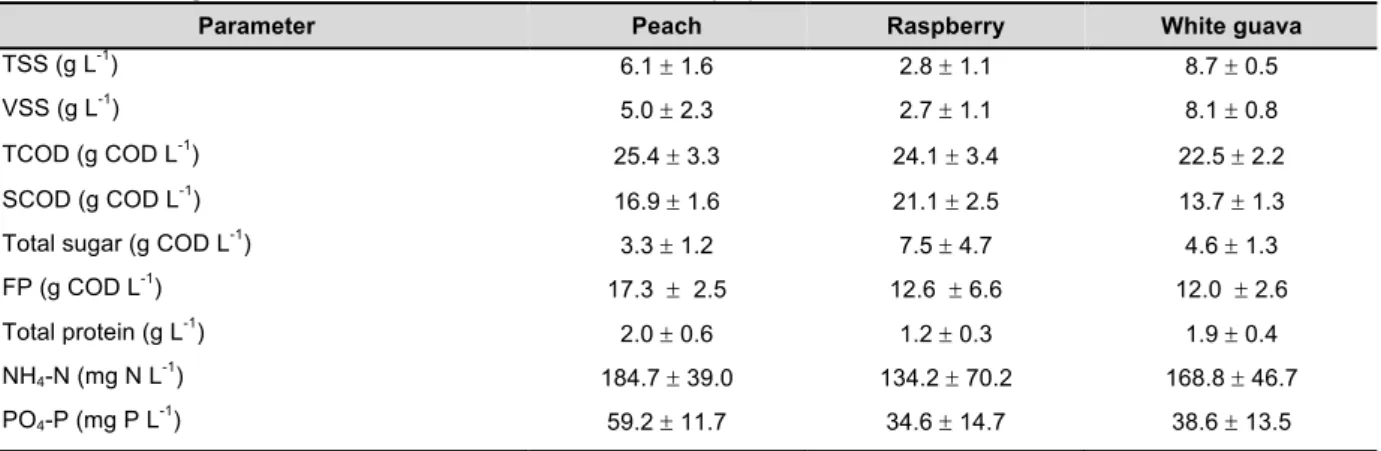
Table 3.2 Acidogenic influent characterisation for each fruit pulp waste.
Parameter Peach Raspberry White guava
TSS (g L-1)
6.1 ± 1.6 2.8 ± 1.1 8.7 ± 0.5
VSS (g L-1)
5.0 ± 2.3 2.7 ± 1.1 8.1 ± 0.8
TCOD (g COD L-1)
25.4 ± 3.3 24.1 ± 3.4 22.5 ± 2.2
SCOD (g COD L-1) 16.9 ± 1.6 21.1 ± 2.5 13.7 ± 1.3
Total sugar (g COD L-1) 3.3 ± 1.2 7.5 ± 4.7 4.6 ± 1.3
FP (g COD L-1) 17.3 ± 2.5 12.6 ± 6.6 12.0 ± 2.6
Total protein (g L-1)
2.0 ± 0.6 1.2 ± 0.3 1.9 ± 0.4
NH4-N (mg N L-1) 184.7 ± 39.0 134.2 ± 70.2 168.8 ± 46.7
PO4-P (mg P L-1) 59.2 ± 11.7 34.6 ± 14.7 38.6 ± 13.5
Figure 3.2 Average FP (●), total sugar (Tsugar) (▲) and total protein (Tprotein) (✕)concentrations in the influent in every condition tested in the acidogenic reactor (conditions presented in chronological order). Error bars represent one standard deviation.
After biomass acclimatisation, four conditions were tested for the treatment of peach and raspberry pulp wastes: (1) pH 4.5 and HRT of 2 days; (2) pH 5 and HRT of 2 days; (3) pH 5 and HRT of 1 day and (4) pH 5.5 and HRT of 1 day. White guava pulp waste treatment was tested under conditions (1) and (2). Results regarding the acidification degree, sugar and protein removal and gas production are summarised in Table 3.3.