Rizza Ardiyanti
Graduated in Environmental Engineering
Design and Characterization of
Chitin-Glucan Polymeric Structures for Wound
Dressing Materials
Dissertation for obtaining the Master degree in Membrane Engineering Erasmus Mundus Master in Membrane Engineering
Advisor : Luísa Neves, Post-Doctoral Researcher, FCT-UNL Co-advisors : Isabel Coelhoso, Professor, FCT-UNL
João Crespo, Professor, FCT-UNL
Jury:
President : João Crespo, Professor, FCT-UNL
Members : Vitor Alves, Associate Professor, ISA-Universidade de Lisboa Damien Quemener, Associate Professor, Montpellier University II Vlastimil Fila, Associate Professor, ICT-Prague
Page | ii
Rizza Ardiyanti
Graduated in Environmental Engineering
Design and Characterization of
Chitin-Glucan Polymeric Structures for Wound
Dressing Materials
Dissertation presented to Faculdade de Ciências e Tecnologia, Universidade Nova de Lisboa for obtaining the master degree in Membrane Engineering
Page | iii
Design and Characterization of Chitin-Glucan Polymeric Structures for Wound
Dressing Materials
The EM3E Master is an Education Programme supported by the European Commission, the European Membrane Society (EMS), the European Membrane House (EMH), and a large international network of industrial companies, research centers and universities (http://www.em3e.eu).
Copyright @ Rizza Ardiyanti, FCT/UNL
A Faculdade de Ciências e Tecnologia e a Universidade Nova de Lisboa têm o direito, perpétuo e sem limites geográficos, de arquivar e publicar esta dissertação através de exemplares impressos reproduzidos em papel ou de forma digital, ou por qualquer outro meio conhecido ou que venha a ser inventado, e de a divulgar através de repositórios científicos e de admitir a sua cópia e distribuição com objectivos educacionais ou de investigação, não comerciais, desde que seja dado crédito ao autor e editor.
Acknowledgments
This report is the outcome of my master thesis work, and conducted to finalize my master program of Membrane Engineering. The research work is supported and executed in the lab of Chemical and Biochemical Engineering Department at Faculdade de Ciências e Tecnologia, Universidade Nova de Lisboa.
During this thesis, I have acquired precious experience as a researcher but also I had the opportunity to deepen in the knowledge I got during my studies. These accomplishments could not have been completed without the support of my supervisor: Dr. Luisa Neves for her motivation, encouragement, critical judgement and moral support throughout this project.
I would like to express my sincere thanks to my co - supervisors, Prof. Isabel Coelhoso and Prof. João Crespo for the opportunity they have provided me to be part of this project and this group. Thank you very much for for your keen observations and invaluable advice.
I would like to thank Carla Rodrigues, for teaching me to use the DSC equipment and helping me doing the DSC analysis. Also, Nuno Costa, for all the work in HPLC analyzes.
For Vitor Alves, I sincerely want to thank you for teaching me and for your assistance during the rheology measurement. You even did the last measurement of my two samples during weekend. Thank you very much.
I am thankful to Diana Araujo and Ines Farinha for having supervised me during the laboratory tests, performed the CGC characterization and for all the help and kindliness shown in the clarification of my very common questions. Special thanks also to all people in the BPEG group that welcome me with open arms, always available to help me in whatever way I need. I want to highlight; Usman Syed, Hugo Andrade, Rita Ferreira, Carla Martins, Carla Daniel and Silvia Antunes for helping me with the experiments and giving me useful practical advice and on the whole making my work highly enjoyable.
I would like to sincerely thank Dr. Elena Vallejo, Chargée de Projets, UM2, France for being so kind and helping us above and beyond her capacity on many occasions, and to the coordinator of the EM3E Program, Prof. André Ayral, for his support and guidance throughout the entire master course. I am also very grateful to all the professors in the EM3E program, research and administrative staff of UM2-France, ICT-Prague and UNL-Portugal for the support and guidance throughout the entire master course.
I would like to thank the European Union and the European Commission for organizing the Erasmus Mundus scholarship program.
Lastly, I would like to thank my family for their patience and everlasting support throughout the duration of this course. It would not have been possible without their love, consideration and understanding.
Page | 5
Abstract
The main objective of this work was the development of polymeric structures, gel and films, generated from the dissolution of the Chitin-Glucan Complex (CGC) in biocompatible ionic liquids for biomedical applications. Similar as chitin, CGC is only soluble in some special solvents which are toxic and corrosive. Due to this fact and the urgent development of biomedical applications, the need to use biocompatible ionic liquids to dissolve the CGC is indispensable. For the dissolution of CGC, the biocompatible ionic liquid used was Choline acetate.
Two different CGC’s, KiOnutrime from KitoZyme and biologically produced CGC from Faculdade de Ciencias e Tecnologia (FCT) - Universidade Nova de Lisboa, were characterized in order to develop biocompatible wound dressing materials. The similar result is shown in term of the ratio of chitin:glucan, which is 1:1.72 for CGC-FCT and 1:1.69 for CGC-Commercial. For the analysis of metal element content, water and inorganic salts content and protein content, both polymers showed some discrepancies, where the content in CGC-FCT is always higher compared to the commercial one. The different characterization results between CGC-FCT and CGC-Commercial could be addressed to differences in the purification method, and the difference of its original strain yeast, whereas CGC-FCT is derived from P.pastoris and the commercial CGC is from A.niger.
This work also investigated the effect of biopolymers, temperature dissolution, non-solvent composition on the characteristics of generated polymeric structure with biocompatible ionic liquid. The films were prepared by casting a polymer mixture, immersion in a non-solvent, followed by drying at ambient temperature. Three different non-solvents were tested in phase inversion method, i.e. water, methanol, and glycerol. The results indicate that the composition of non-solvent in the coagulation bath has great influence in generated polymeric structure. Water was found to be the best coagulant for producing a CGC polymeric film structure.
The characterizations that have been done include the analysis of viscosity and viscoelasticity measurement, as well as sugar composition in the membrane and total sugar that was released during the phase inversion method. The rheology test showed that both polymer mixtures exhibit a non-Newtonian shear thinning behaviour. Where the viscosity and viscoelasticity test reveal that FCT mixture has a typical behaviour of a viscous solution with entangled polymer chains and CGC-Commercial mixture has true gel behaviour. The experimental results show us that the generated CGC solution from choline acetate could be used to develop both polymeric film structure and gel. The generated structures are thermally stable at 100° C, and are hydrophilic. The produced films have dense structure and mechanical stabilities against puncture up to 60 kPa.
Page | 6
Table of contents
Acknowledgments ... 4
Abstract ... 5
Table of contents ... 6
List of Tables ... 8
List of Figures ... 9
Abbreviations ... 10
1. Introduction ... 11
1.1. Chitin ... 11
1.2. Chitin and Chitosan ... 12
1.3. Chitin Glucan Complex (CGC) ... 13
1.4. Biocompatible Ionic Liquid ... 15
1.5. Dissolution of CGC in Ionic Liquid ... 16
1.6. Wound Dressing Materials ... 17
1.7. Objective of this thesis ... 18
2. Material and Methods ... 19
2.1. CGC-Commercial (KiOnutrime) data ... 19
2.2. CGC Extraction from P. pastoris biomass ... 20
2.3. CGC chemical analysis ... 21
2.3.1. Metal element analysis ... 21
2.3.2. Water and Inorganic salts ... 22
2.3.3. Sugar constituents ... 22
2.3.4. Protein content ... 23
2.4. Thermal Properties ... 24
2.5. Film preparation ... 25
2.6. Rheology Test... 26
2.7. Sugar content in coagulation bath ... 27
Page | 7
2.8.1. Puncture Test ... 27
2.8.2. Contact Angle Analysis ... 28
2.8.3. Scanning Electron Microscopy (SEM) Analysis ... 29
3. Results and Discussion ... 31
3.1. CGC Polymer ... 31
3.1.1. Metal element analysis ... 31
3.1.2. Water and inorganic salts content in CGC ... 32
3.1.3. Sugar constituents in CGC ... 32
3.1.4. Protein content in CGC ... 33
3.1.5. Thermal properties of CGC polymer ... 34
3.2. Polymeric structures produced from CGC ... 35
3.2.1. Rheology of CGC Mixtures... 39
3.2.2. Thermal properties of polymer mixtures and films ... 41
3.2.3. Sugar constituents in CGC films ... 44
3.2.4. Total sugar analysis in coagulation bath... 45
3.2.5. Contact Angle Analysis ... 46
3.2.6. Puncture Test ... 47
3.2.7. SEM Analysis ... 49
4. Conclusions ... 51
5. Future Work ... 52
6. References ... 53
Page | 8
List of Tables
Table 1.1: Polymeric product from Chitin-Glucan derivative in the market ... 14
Table 1.2: Chitin regeneration with Ionic Liquid ... 16
Table 3.1: Composition of metal element in CGC polymers ... 31
Table 3.2: Water and inorganic salts content in CGC polymers ... 32
Table 3.3: Sugar constituents in CGC polymers ... 32
Table 3.4: Protein content in CGC polymers ... 33
Table 3.5: Glass transition temperature (Tg) of polymer mixtures ... 41
Table 3.6: Melting temperature and decomposition temperature of polymer mixtures ... 44
Table 3.7: Sugar composition in produced films and gel ... 45
Table 3.8: Total sugar content in coagulation bath ... 46
Table 3.9: Result of puncture test strain on CGC films ... 47
Page | 9
List of Figures
Fig.1.1: Molecular structure and hydrogen bonding in (a) α-chitin and (b) β-chitin [5] ... 11
Fig.1.2: Structure of chitin and chitosan [5] ... 12
Fig.1.3: Schematic representation on the possibilities of processing chitin and chitosan [5] ... 13
Fig.1.4: Molecular structure of yeast β-glucan and chitin [9] ... 14
Fig. 1.5: Structure of choline based ionic liquids synthesize [17] ... 15
Fig. 1.6: Schematic representation of the required properties of wound dressing material [5] ... 17
Fig. 2.1: Molecular structure of Choline acetate ionic liquid [15] ... 19
Fig. 2.2: KiOnutrime®, KitoZyme SA, Belgium. ... 20
Fig. 2.3: Scheme of CGC extraction from P. pastoris cell wall ... 21
Fig. 2.4: ICP-AES, Ultima mode, Horiba Jobin-Yvon, France. ... 22
Fig. 2.5: Ion Chromatography – DIONEX, model ICS-3000 ... 23
Fig. 2.6: Spectrophotometer - Thermo Spectronic, Heλios α, Germany ... 24
Fig. 2.7: Differential Scanning Calorimeter - Setaram, France, model DCS 131 ... 24
Fig. 2.8: Dissolution of CGC polymers ... 25
Fig. 2.9: Rheometer Haake RS-75 ... 26
Fig. 2.10: TA-Xt plus texture analyser ... 27
Fig. 2.11: Puncture test scheme ... 28
Fig. 2.12: Schematic of a sessile drop, contact angle and the three interfacial tension [29] ... 28
Fig. 2.13: Goniometer for a sessile drop, contact angle and the three interfacial tension [29] ... 29
Fig. 2.14: Scanning Electron Microscopy, Jeol JSM-7001F ... 30
Fig. 3.1: DSC Result for temperature below 100 oC (Cryo-DSC) ... 34
Fig. 3.2: DSC Result for high temperature measurement ... 35
Fig. 3.3: Schematic film casting process ... 36
Fig. 3.4: Polymeric structures, produced from CGC polymers in different non-solvents ... 37
Fig. 3.5: Produced CGC films with different dissolution temperature ... 38
Fig. 3.6: Produced CGC films with different evaporation condition ... 38
Fig. 3.7: Flow curve of CGC mixtures and choline acetate ... 39
Fig. 3.8: Mechanical Spectrum of CGC-FCT film forming mixtures ... 40
Fig. 3.9: Mechanical Spectrum of CGC-Commercial film forming mixtures ... 40
Fig. 3.10: DSC Result on dope solution and choline acetate (Cryo-DSC) ... 42
Fig. 3.11: DSC Result on dope solution and choline acetate (T>Ambient temperature) ... 42
Fig. 3.12: DSC Result on produced membranes (Cryo-DSC) ... 43
Fig. 3.13: DSC Result on produced membranes (T>Ambient temperature) ... 43
Fig. 3.14: Molecular structure of non-solvents ... 45
Fig. 3.15: Contact angle of CGC films produced in different non-solvents ... 46
Page | 10
Abbreviations
AIM Alkali Insoluble Material BDL Below Detection Limit
BPEG Biochemical and Process Engineering Group
BSM Basal Salts Medium
CA Choline Acetate
CGC Chitin Glucan Complex
CMA Concomitant Metals Analyser
Comm. Commercial
DA Degree of Acetylation
DSC Differential Scanning Colorimetry
DO Dissolved Oxygen
EFSA European Food Safety Authority
EPS Exopolysaccharide
f Frequency
FCT Faculdade de Ciências e Tecnologia
G’ Elastic modulus
G’’ Viscosity modulus
HPLC High Performance Liquid Chromatography
Hz Hertz
ICP-AES Inductively Coupled Plasma-Atomic Emission Spectroscopy ICP-MS Inductively Coupled Plasma-Mass Spectrometry
IL Ionic Liquid
ILs Ionic Liquids
MeOH Methanol
ND Not Determined
Pa Pascal
RH Relative Humidity
rpm Rotation per minute
SEM Scanning Electron Microscopy
s Second
TGA Thermogravimetry
Tg Glass transition Temperature Tc Crystallisation Temperature
Tm Melting Temperature
UNL Universidade Nova de Lisboa
Page | 11
1.
Introduction
1.1.
Chitin
Chitin is a non-toxic, biodegradable and biocompatible polysaccharide. It is the second most abundant polysaccharide in nature after cellulose [1], found mainly as the exoskeleton material of arthropods and crustaceans, and the cell wall of fungi. Chitin is a homopolymer of 1-4 linked 2-acetamido-2-deoxy-β-D-glucopyranose [2]. It presents a wide diversity of structures and properties that allows several possible chemical and mechanical modifications in order to create novel materials with specific functionalities and properties.
Chitin exists in three different polymorphic forms (α, β and γ). The polymorphic forms of chitin differ in the packing and polarities of adjacent chains in successive sheets; in the β-form, all chains are arranged in a parallel way, which is not the case in α-chitin [4]. The molecular structure of α-chitin and β-chitin is presented in Fig. 1.1.
Fig.1.1: Molecular structure and hydrogen bonding in (a) α-chitin and (b) β-chitin [5]
Page | 12
hydrogen bonds are distributed in two sets with half occupancy in each set. These aspects make evident the insolubility and intractability of chitin.
1.2.
Chitin and Chitosan
Basically, chitin and chitosan are two points on a continuum of materials that share the same basic structure and differ only in their degree of acetylation. Chitin and Chitosan are interesting polysaccharides because of the presence of the amino functionality, which could be suitably modified to convey desired properties and distinctive biological functions including solubility. Apart from the amino groups, they have two hydroxyl functionalities for effecting appropriate chemical modifications to enhance solubility. The structure of chitin and chitosan is shown in Fig.1.2.
Fig.1.2: Structure of chitin and chitosan [5]
Page | 13
Fig.1.3: Schematic representation on the possibilities of processing chitin and chitosan [5]
Derived from chitin, chitosan is a unique biopolymer that exhibits preeminent properties, beside biocompatibility and biodegradability [32]. These particular properties arise from the presence of primary amines along the chitosan backbone. As a result, this polysaccharide can be a relevant candidate in the field of biomaterials for tissue engineering. The possibilities usage of processing chitin and chitosan is depicted in Fig.1.3.
1.3.
Chitin Glucan Complex (CGC)
One material that has shown promise as a component of wound dressings is β-glucan, a polysaccharide comprised of β-linked D-glucose molecules. A variety of β-glucans have been isolated from various sources, such as fungi, baker’s yeast, barley, and seaweed. The physicochemical properties of β-glucans differ depending on characteristics of their primary structure, as well as the linkage type, degree of branching, molecular weight, and conformation. β-glucans have been reported to be biocompatible, biodegradable and bio-absorbable, and also expected to promote the therapeutic efficacy of the dressing by increasing the wound healing response [7].
Page | 14
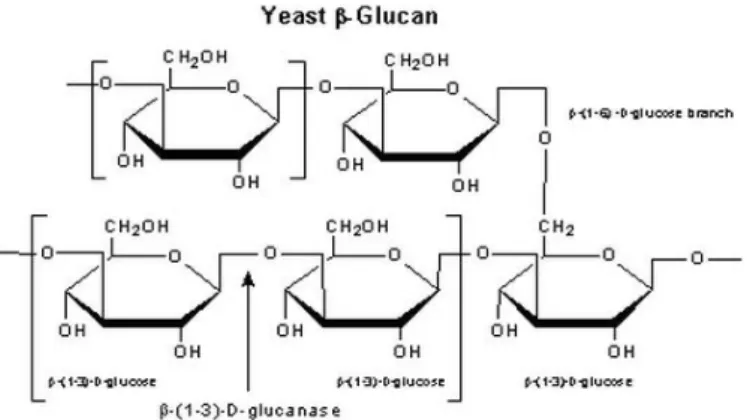
Fig.1.4: Molecular structure of yeast β-glucan and chitin [9]
From the Sigma-Aldrich data, it is reported that in yeast, the cell wall comprises about 30 % of the dry weight of the cell. The yeast cell wall is made of approximately; 25% helical β(1-3) and β(1 -6)-D-glucans and 25% oligo-mannans, 20 % protein, 10% lipids, and some chitin. The protein component exists mostly as a mannoprotein complex [9]. Covalent linkages are proclaimed to exist as β(1-4)-linkages between the reducing ends of chitin and the non-reducing end of b(1-3)-glucans1 as well as among glycoproteins, β(1-6)-glucans, and β(1-3)-glucans [9]. The examples of polymeric products that are produced from chitin glucan derivatives are presented in Table 1.1.
Table 1.1: Polymeric product from Chitin-Glucan derivative in the market
Producer Market name Usage
KitoZyme, Belgium
KiOnutrime®-CG Cardiovascular health
KiOnutrime®-CsG Weight management
KiOtransine® Digestive health
KiOfine®-B Wine production (cure contamination)
KiOfine®-CG Wine production (clarification)
Clariant Co., USA Vitipure™ Skin repair and anti-aging
Page | 15
1.4.
Biocompatible Ionic Liquid
In recent years, natural renewable resources have been successfully used to produce biomaterials that are biodegradable under certain temperature and humidity conditions. Unfortunately, most biodegradable materials are synthesized by chemical processes using volatile organic solvents, and their emissions and disposal are a large source of pollution worldwide. Alternative solvents such as ionic liquids (ILs) have emerged as a solvents that can be used as templates for porous polymers, components of polymeric matrices and solvents for a wide variety of organic and inorganic compounds [3].
Ionic liquids (ILs) are structurally similar to salts that are a relatively new class of solvents, with potential applications in various fields such as; synthesis, catalysis and electrochemistry, protein stability, polymers conformation and gas separation [13]. Besides, these ILs gained honour as neoteric solvents due to their unique chemical and physical properties such as stability on exposure to air and moisture, extremely low vapour pressure, and high solubility power [11]. The key attraction of ILs is their possibility to be tuned by varying the nature of cations and anions present in their structure.
Recently, ILs have also provided a new processing platform for the dissolution of some natural macromolecules (e.g. cellulose, chitin, starch and lignin) that are otherwise difficult to dissolve due to their inter- and intramolecular hydrogen bonds [1]. In the IL platform, macromolecules can be dissolved, regenerated, derived and functionalized, increasing their potential for exploitation [3].
Fig. 1.5: Structure of choline based ionic liquids synthesize [17]
Page | 16
possibilities of ionic liquids, we selected the choline acetate due to its biocompatibility which allows it to be the best candidate for biomedical application, where acetate anions were known due to its ability in disrupting the inter- and intramolecular hydrogen bonding in the biopolymer [37]. Choline acetate is also recognized to be much more biodegradable than dialkylimidazolium-based ILs [14].
1.5.
Dissolution of CGC in Ionic Liquid
Chitin is relatively difficult to process, and due to its insolubility in aqueous solution, has become less accessible to biological laboratories. The use of chitin has been limited due its intractability and insolubility in water and common organic solvents [2] due to its rigid crystalline structure. The structural similarity of chitin to cellulose has induced many authors to try the solvents used for cellulose [12]. As in the case of cellulose, the existence of both intra- and intermolecular hydrogen bonds for chitin in the solid state strongly resists dissolution. But, many of these solvents are corrosive, degradative and toxic. Hence, they cannot be used in medical application and also rise difficulties in scaling up for industrial production.
On the other hand, ILs emerged as a good solvent and can dissolve various substances including biomass i.e. cellulose, lignin and directly wood as well as other renewable polymers such as starch and chitin [12]. Therefore, the dissolution of chitin in ILs has significantly broadened the number of tailored derivatives from this polysaccharide, and consequently enhances its potential use in a number of applications, including in the biomedical field [3]. Using these hydrogels it is possible to develop scaffolds and membranes for the variety of biomedical applications such as tissue engineering and wound dressing. During the last few years vigorous research effort in processing chitin utilizing IL’s has been carried out, summarized in Table 1.2.
Table 1.2: Chitin regeneration with Ionic Liquid
Ionic Liquid Dissolution Processing Ref.
1-ethyl-3-methylimidazolium acetate
(EAc) Soluble 100 °C, 12 h [35]
1-butyl-3-methylimidazolium acetate (BmimAc)
Partly soluble 100 °C, 2 h [36], [37]
Soluble 95 °C, 5 h [41]
1-butyl-3-methylimidazolium chloride (BmimCl)
Partly soluble 110 °C, 2 h [36]
Soluble 100 °C, 24 h [39]
1-allyl-3-methylimidazolium bromide
(AmimBr) Soluble
2h soaked, 100 °C, 48 h [38]
100 °C, 24 h [39],[40]
1-ethyl-3-methylimidazolium acetate
Page | 17
From Table 1.2, it can be seen that several works for dissolution chitin in IL have been carried out before. This fact motivates us to develop a research on the dissolution of chitin derivative polymer, CGC, to use more biocompatible IL such as Choline acetate.
Dissolution of CGC with ionic liquids allows the comprehensive utilization of CGC by combining two major green chemistry principles: using environmentally preferable solvents and bio-renewable feed-stocks. Having the same behaviour as chitin, CGC is not easily dissolved in common un-toxic solvent, e.g. water. No research concerning the influence of IL traces in CGC membranes has been reported yet.
1.6.
Wound Dressing Materials
Wound management and skin repair are an important area of biomedicine and tissue engineering, wherein intensive research is carried out for the development of advanced wound care systems and promoting satisfying skin regeneration. Chitin and chitosan polymers are amongst the most promising materials for wound dressing materials [5]. They are not antigenic and are perfectly biocompatible. Furthermore, they are biodegradable by enzymatic hydrolysis, for instance in the presence of lysozymes. Due to their anti-thrombogenic and haemostatic character they can be used in all fields of medicine [28]. They might be used to prevent the fibrin bits formation in wounds, to support cell regeneration and to prevent the scar formation.
Fig. 1.6: Schematic representation of the required properties of wound dressing material [5]
Page | 18
They can support cellular regeneration while protecting tissues from microbial aggressions. Different derivatives of chitin and chitosan have been prepared for this purpose in the form of fibers, hydrogels, membranes, sponges and scaffolds [5]. One of promising biomaterials based on chitin is Chitin Glucan Complex (CGC).
The high biocompatibility of chitin-based films has been demonstrated for human, chick and mouse fibroblasts by various methods [5, 22].
1.7.
Objective of this thesis
This thesis focuses on the development of polymeric structures, namely, hydrogels and films, based on chitin-glucan complex (CGC) for wound dressing materials. Two different CGC, the commercial one from KitoZyme and biologically produced CGC from FCT - Universidade Nova de Lisboa, were characterized in order to develop biocompatible wound dressing materials. The characterization of these biopolymers would include; metal element content, water and inorganic salts content, sugar constituents, protein content and thermal properties analysis.
The CGC dissolution in the biocompatible ionic liquid would be studied in term of viscosity and viscoelasticity in order to understand its influence in the development of the polymeric structure, and also its thermal stability.
The effect of several non-solvents used during phase inversion method would be investigated directly by examining the physical and chemical properties of produced films and gels. The analysis would comprise the thermal stability and sugar composition study of films and gels, and the analysis of total sugar released during the immersion precipitation.
Page | 19
2.
Material and Methods
In this work, two different CGC polymers were studied. One is produced by BPEG (Biochemical and Process Engineering Group) team of FCT-UNL, Portugal, using P. pastoris and the commercial one is KiOnutrime from KitoZyme SA, Belgium.
The solvent tested for the dissolution of CGC polymers is Choline acetate (C7H17NO3) ionic liquid, supplied by Faculdade de Farmacia, Universidade de Lisboa. Its molecular weight is 163 g·mol-1. The synthetic name of Choline acetate is 2-Hydroxy-N,N,N-trimethylethanaminium acetate [7].
Fig. 2.1: Molecular structure of Choline acetate ionic liquid [15]
The materials and reagents used during the experiment, are described as following:
2.1.
CGC-Commercial (KiOnutrime) data
KiOnutrime is chitin-glucan purified ingredient, presented in a powder form, which is composed mainly of two polysaccharides:
- Chitin, composed of repeating units of N-acetyl-D-glucosamine (CAS number 1398-61- 4); - β(1,3)-glucan, composed of repeating units of D-glucose (CAS number 9041-22-9).
The chitin-glucan component harvested from the cell walls of the mycelium of a fungus from the Ascomycetes family: Aspergillus niger (A. niger). The two polymers are linked covalently and form a three-dimensional network [20].
Page | 20
Fig. 2.2: KiOnutrime®, KitoZyme SA, Belgium.
The brief specification of KiOnutrime® is presented in Appendix I.
2.2.
CGC Extraction from
P. pastoris
biomass
The production of CGC is attained by cultivating P. pastoris yeast in a bioreactor containing crude glycerol as carbon source. P. pastoris is a methylotrophic yeast commonly used in the pharmaceutical industry as a host for the production of various recombinant heterologous proteins [8]. CGC is developed in P. pastoris cell walls to maintain its integrity and, therefore, relatively high amount of CGC can be extracted after biomass production to directly harvest CGC from the cell biomass. Inoculum for bioreactor experiments were prepared by incubating P. pastoris strain DSM 70877 in basal salts medium (BSM) [8], containing crude glycerol. Cultivation was carried out in a 2 L bioreactor with an initial working volume of 1.4 L. The bioreactor was operated with controlled temperature and pH of 30°C and 5, respectively. The DO concentration was controlled by the automatic variation of a stirring rate and supplementation of an air stream with pure oxygen. CGC content in P. pastoris cells was evaluated along the cultivation assay. Chitin–glucan content in yeast cells is an indication of its cell age.
Page | 21
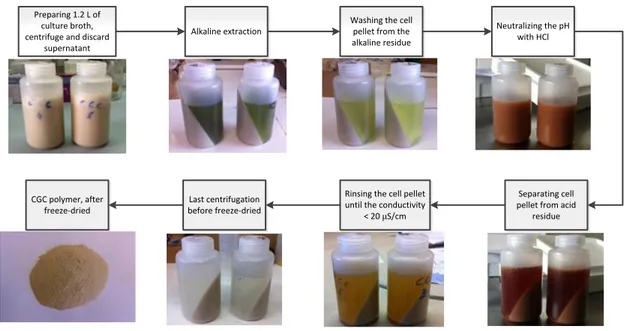
20µS/cm. pH was adjusted in the range of 6.5 – 7.5 by adding NaOH or HCl. The resulting polymer was freeze dried. The CGC extraction scheme of P. pastoris is presented in Fig.2.3.
Preparing 1.2 L of culture broth, centrifuge and discard
supernatant
Alkaline extraction
Washing the cell pellet from the alkaline residue
Neutralizing the pH with HCl
Separating cell pellet from acid
residue Rinsing the cell pellet
until the conductivity < 20 μS/cm Last centrifugation
before freeze-dried CGC polymer, after
freeze-dried
Fig. 2.3: Scheme of CGC extraction from P. pastoris cell wall
2.3.
CGC chemical analysis
Both biopolymers were characterized in terms of its composition, which include metal element analysis, water and inorganic salts content, quantification of sugar constituents, protein content, and thermal properties analysis.
Duplicates of each measurement were performed in order to obtain reliable data.
2.3.1. Metal element analysis
To analyse chemical elements by ICP-AES (Inductively Coupled Plasma-Atomic Emission Spectroscopy), 5 mg of the CGC samples was treated with 20 mL of H2SO4 20% (v/v) from Pancreac, Spain. The tubes were mixed and kept in an oven at 70°C for one hour. The standard was prepared from the same acid solution 20 mL of H2SO4 20% (v/v) without polymer.
Page | 22
elements in a single sample. The quantity of each metal element was corrected based on the standard. The instrument is presented in Fig.2.4.
Fig. 2.4: ICP-AES, Ultima mode, Horiba Jobin-Yvon, France.
2.3.2. Water and Inorganic salts
To determine the water content in the polymer, 30 mg of CGC polymers on the glass fiber filter (pore size 1.2 µm, VWR Belgium) that was previously weighed were subjected in the oven at 100 °C during overnight. The filter and sample were withdrawn from the oven and weighed for quantification of water content.
The inorganic salts content of the samples was evaluated by subjecting them to pyrolysis at a temperature of 550 °C for 24 h. The set sample and filter were weighed for determination of inorganic salts.
2.3.3. Sugar constituents
Page | 23
The analysis was performed at 30 °C, with sodium hydroxide (NaOH 4 mM) as eluent, at a flow rate of 0.9 mL·min−1. Glucose Aldrich), mannose Aldrich) and glucosamine (Sigma-Aldrich) were used as standards, and being subjected to the same hydrolysis procedures as the polymer samples.
Fig. 2.5: Ion Chromatography – DIONEX, model ICS-3000
For HPLC system employed, identification and quantification of the major sugars present in the samples were achieved by comparing each peak retention time and area with those of the standard. Data of the area is used for the calibration curve. The quantity of each sugar was corrected based on the recovery ratio of the internal standard.
2.3.4. Protein content
Page | 24
Fig. 2.6: Spectrophotometer - Thermo Spectronic, Heλios α, Germany
The spectrophotometer used is Thermo Spectronic, Heλios α, Germany. Fig.2.6 represents the spectrophotometer utilized for the measurements of absorbance.
2.4.
Thermal Properties
To understand the thermal properties and stability of CGC polymers, a differential scanning calorimeter (Setaram, model DSC 131, France) is utilized at a scanning rate for both heating and cooling of 10°C·min−1 in the temperature range -130°C to 100°C and 30°C to 400°C. The sample was placed and hermetically sealed in an aluminium crucible while an empty crucible was used as the reference. The sample was heated under a nitrogen stream.
The DSC instrument is presented in Fig. 2.7.
Fig. 2.7: Differential Scanning Calorimeter - Setaram, France, model DCS 131
Page | 25
2.5.
Film preparation
To dissolve the polymer for film preparation, CGC powder (5 wt. %) was added in Choline Acetate in a 50 mL beaker glass under continuous agitation (200 rpm) using a magnetic stirrer. During dissolution, the temperature of the solution was well controlled in the oil bath at 80 oC for FCT-CGC and 110 oC for the commercial CGC for 24 h.
The beaker glass was placed in the thermostat oil bath. The sample was heated very slowly with continuous stirring. The temperature control of the water bath was governed by using a digital thermo-regulator connected to the heating magnetic stirrer from Velp Scientific, Italy. The dissolution process is depicted in Fig. 2.8.
Fig. 2.8: Dissolution of CGC polymers
The CGC solution was later casted onto a metal plate and instantly immersed in a coagulation bath at room temperature for 24 h. The compositions of non-solvent used in coagulation bath were;
1. Demineralized water
2. 50% (v/v) Methanol (MeOH) solution 3. 30% (v/v) Glycerol solution
The membranes were dried in an open space at an ambient room temperature 26±2°C and relative humidity of 35±1% for 72 h, and 5-7 days if desiccator was used.
Page | 26
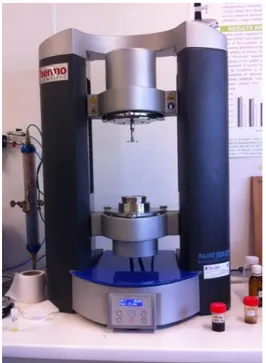
2.6.
Rheology Test
To understand the viscosity and viscoelastic properties of the CGC mixtures, a controlled stress rheometer (Haake RS-75, Thermo Scientific, Germany) is used. The rheometer is equipped with Peltier liquid temperature control unit. A cone and plate geometry of diameter 3.5 cm and 2° angle were used for the measurement. The rheometer is presented in Fig. 2.9.
The rheology measurement of ionic liquid was done at temperature 25 °C, whereas for polymer mixtures were at temperature 80 °C and 110 °C in order to mimic the dissolution temperature of both polymers.
Fig. 2.9: Rheometer Haake RS-75
Flow curves for choline acetate and two CGC mixtures were determined using a steady state flow ramp in the range of shear rate from 0.001 to 1000 s-1.
Page | 27
2.7.
Sugar content in coagulation bath
For the analysis of total sugar in the coagulation bath, Dubois method was employed. This method is mainly useful for the determination of small quantities of sugars.
Total sugar content (CHO) was analysed using the phenol-sulphuric method modified to be measured at 490 nm using an absorbance spectrophotometer (Thermo Spectronic, Heλios α, Germany) as presented in Fig. 2.6. Simple sugars, oligosaccharides, polysaccharides, and their derivatives, including the methyl ethers with free or potentially free reducing groups, give an orange-yellow colour when treated with phenol and concentrated sulphuric acid [18]. The reaction is sensitive and the colour is stable.
0.5 mL of sample was mixed with 0.5 mL Phenol (5% wt.) and 2.5 mL of concentrated H2SO4. After 10 minutes, each samples were mix in a cortex-mixer for few seconds. The samples were placed in a dark place for 30 minutes prior to measurement at 490 nm using an absorbance spectrophotometer. Glucose (Sigma Aldrich) was used as standard. The absorbance value of the standards at different concentrations was used to build a calibration curve.
2.8.
Membrane Characterization
2.8.1. Puncture Test
To know the mechanical resistance of the film against puncture, a TA-Xt plus texture analyser (Stable Micro Systems, Surrey, England) was used for puncture stress measurement. All mechanical tests were performed at ambient conditions, at room temperature of 22±2 °C. Triplicates of each film were analysed. The measuring instrument is presented in Fig. 2.10.
Fig. 2.10: TA-Xt plus texture analyser
Page | 28
and punctured through the hole with a cylindrical probe (2 mm diameter). The puncture stress (
τ
P) was expressed as the ratio of the puncture force and the probe contact area as per equation below (Eq. 2.1).(Eq. 2.1)
Where
τ
P is a puncture stress in Pa; FP is the force to the films in N; and AP is the probe cross sectional area in m2. This test allows the determination of the strain by the following equation;
(Eq. 2.2)
Where εP is a puncture elongation; Lf is the final length in meter; and Li is the initial length in meter.
Fig. 2.11: Puncture test scheme
The parameter Lf refers to the film elongation and it is calculated with base in the elongation measured by the probe, d(Eq. 2.3). Fig. 2.11 shows a representation of the test calculation.
√ (Eq. 2.3)
2.8.2. Contact Angle Analysis
To have information regarding the hydrophilicity of the polymeric structure, the contact angle measurement was employed. The contact angle (θ) of the liquid drop on a solid surface is defined by the mechanical equilibrium of the drop under the action of three interfacial tension; solid liquid (γSL), solid vapour (γSV) and liquid vapour (γLV), Fig. 2.12.
Page | 29
The equilibrium spreading coefficient (Ws) is defined by equation and can only be negative or zero (Eq. 2.4):
Ws = Wa – Wc = γSV - γLV - γSL (Eq. 2.4)
Wa and Wc are the work of adhesion and work of cohesion respectively, and can be defined as: Wa = γSV + γLV - γSL (Eq. 2.5)
Wc = 2· γLV (Eq. 2.6)
γSV = γLV ∙cos (θ) + γSL (Eq. 2.7)
The contact angle was measured by sessile drop method. A drop of distilled water was deposited manually on the membrane surface by a syringe. 50 images were acquired by the software and the tangent was determined by fitting the drop shape to known mathematical function. The measurements were executed immediately after the drop fell on the surface. Multiple replicates were performed, and the mean contact angle was reported with its standard deviation. The instrument is presented in Fig.2.13.
Fig. 2.13: Goniometer for a sessile drop, contact angle and the three interfacial tension [29]
2.8.3. Scanning Electron Microscopy (SEM) Analysis
Page | 30
Fig. 2.14: Scanning Electron Microscopy, Jeol JSM-7001F
The principle of SEM involved the incidence of an electron beam on the sample surface producing secondary electrons, back scattered electrons or retro-diffused x-rays which can be analysed to obtain an image which is magnified over 200,000 times. In our case, the signal consists of secondary electrons from which the surface image is constructed instantly. The primary electron beam is mobile and scans the samples surface obtaining a complete image.
Sample preparation is an important part of this process as the material has to be clean cut surfaces and must be conductor. In order to achieve this, 2 cm2 pieces of the sample was dipped in a liquid
Page | 31
3. Results and Discussion
3.1.
CGC Polymer
3.1.1. Metal element analysis
The metal element analysis was measured by ICP-AES. The measurements for the CGC-FCT and CGC-Commercial were executed based on the method described in section 2.3.1. The results are presented in Table 3.1.
Table 3.1: Composition of metal element in CGC polymers
Metal Element Wavelength (nm) Concentration of the element (mg/L)
CGC-FCT CGC-Commercial
Boron (B) 249.773 0.013 BDL
Calcium (Ca) 393.366 BDL 0.278
Cadmium (Cd) 226.502 ND ND
Cobalt (Co) 228.616 ND ND
Copper (Cu) 224.700 0.046 BDL
Iron (Fe) 259.940 0.201 BDL
Mercury (Hg) 194.164 ND ND
Potassium (K) 766.490 ND ND
Magnesium (Mg) 279.553 0.003 0.072
Manganese (Mn) 257.610 ND ND
Molybdenum (Mo) 202.030 ND ND
Sodium (Na) 589.592 BDL 0.397
Phosphorus (P) 214.914 0.004 BDL
Zinc (Zn) 213.856 0.118 0.033
*ND = Not Determined *BDL = Below Detection Limit
From the results obtained, it can be observed that CGC-FCT polymer contains more metal elements compared with CGC-Commercial, namely for the elements of Boron, Copper, Iron, Phosphorus and Zinc. However, for Calcium, Magnesium and Sodium are found in higher amount in the commercial CGC.
Page | 32
The result of our measurement is below the reported value by European Food Safety Authority (EFSA) in literature [20] and in the specification product from Kitozyme (Appendix I). This discrepancy could be addressed to the sensitivity and detection limit of the instruments. It is known that the ICP-MS is more sensitive and accurate compared to ICP-AES [26].
3.1.2. Water and inorganic salts content in CGC
The characterization of water and inorganic salts content in both polymers was carried out based on the method described in section 2.3.2. The result is outlined in Table 3.2.
Table 3.2: Water and inorganic salts content in CGC polymers
Polymer Water content (wt. %) Inorganic salts (wt. %)
CGC-FCT 12.51 1.95
CGC-Commercial 7.35 0.98
CGC-FCT contains more water and more inorganic salts, compared to the commercial one.
The inorganic salts content in the CGC-FCT polymer in this experiment is less compared to the previous CGC-FCT result from Henrique Marcal’s experiment which was 5.5 % [16]. This could be due to low conductivity set-up value during the polymer extraction, which is 20 µS·cm-1 in this experiment and 500 µS·cm-1 in the previous one.
The difference observed from CGC-FCT and CGC-Commercial could be addressed to differences on the purification method of the polymers. The values obtained for water and inorganic salts of CGC-FCT are also less compared with the CGC described in literature [8].
3.1.3. Sugar constituents in CGC
For the determination of sugar composition in two biopolymer samples, CGC were hydrolysed and analysed by HPLC as described in chapter 2.3.3. The composition of glucosamine and glucan in the CGC polymers tested are summarized in Table 3.3.
Table 3.3: Sugar constituents in CGC polymers
Polymer Glucosamine
Conc. (ppm) Glucan Conc. (ppm) Mannose Conc. (ppm) Ratio Glucosamine and Glucan
CGC-FCT 424.93 732.84 37.49 1:1.72
Page | 33
The ratio of chitin and glucan amount in the polymers is represented by the ratio of glucosamine and glucan. The result shows that there is a concurrency between two polymers in term of the ratio of chitin and glucan which is 1:1.72 for CGC-FCT and 1:1.69 for CGC-Commercial. The result of CGC-FCT is different with literature [8]. This difference could be addressed to the dissimilarity in feeding and operating strategy of the bioreactor during the P. pastoris production.
The result of sugar constituents in CGC-Commercial also shows a congruity with the result obtained by the literature [20]. The amount of chitin in chitin-glucan copolymers is defined by the organism from which it is extracted. In the case of mycelium of Aspergillus niger used in the method according to the invention by Kitozyme, and chitin-glucan copolymers extracted from the mycelium of A. niger comprise between 30 and 50% (w/w) of chitin and between 50 to 70% of β-glucan [20].
The calibration curve of the concentration of sugar as a function of absorbance of the standards by HPLC is presented in Appendix II.
3.1.4. Protein content in CGC
Determination of protein content was made between other treatments, hydrolysis and subsequently a measurement of absorbance at 750 nm, as previously described in section 2.3.4. The values of absorbance, protein concentration and percentage of protein in two CGC polymers are presented in Table 3.4.
Table 3.4: Protein content in CGC polymers
Polymer Mass of
sample (mg) Absorbance
Protein content (mg/mL)
Avg. of protein content (mg/mL) Protein content (%) Avg. of protein content (%)
CGC-FCT 7.28 0.681 0.38 0.40 5.22 5.57
7.26 0.748 0.43 5.92
CGC-Commercial
7.21 0.120 0.12
0.12 1.66 1.67
7.17 0.081 0.12 1.67
From the obtained results, it can be observed that CGC-FCT polymer contains more protein compared with CGC-Commercial. Protein is characterized by amino group as well as glucosamine which known as an amino sugar part in chitin and chitosan structure. Hence, this result could be linked to the sugar constituent analysis in section 3.1.3., where it was observed as well that the CGC-FCT contains more glucosamine than the commercial one.
Page | 34
chitin-glucan from the mycelium is expected to denature or partly hydrolyse any protein component from the source, as it stated in the literature [20].
As additional information, it is reported by European Food Safety Authority (EFSA) that protein content in KiOnutrime is ≤ 6% [20]. The method used for protein determination was based on colorimetry after reaction with ninhydrin and UV-absorption at 564 nm.
The calibration curve depicting the concentration of protein as a function of absorbance of the standards is presented in Appendix III.
3.1.5. Thermal properties of CGC polymer
The analysis using differential scanning calorimetry (DSC) to evaluate CGC polymer helps to explore and understand the intrinsic property, as well as to verify and monitor the thermal properties and phase transitions of the polymer.
However, during the DSC measurement, the glass transition temperature (Tg) of both polymers could not be observed due to the limitation of the instrument. The measurement from low temperature to high temperature could not be conducted continuously. This problem leads to the difficulty in interpreting the DSC results.
The DSC result for CGC measurement in low temperature is presented in Fig. 3.1.
Page | 35
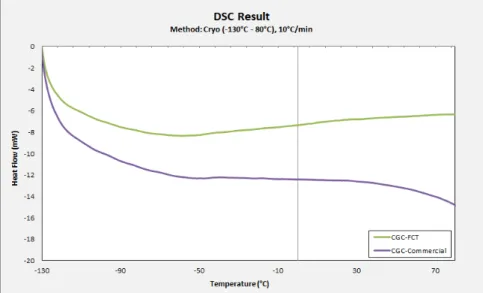
Fig. 3.2: DSC Result for high temperature measurement
By analysing Fig. 3.2, it can be seen that both samples undergo a process of dehydration following by decomposition of biopolymer. The curve between temperature 80°C and 130 °C corresponds to zone of water evaporation.
The first curve of commercial CGC, between temperatures ranges of 80°C–130°C, represents thermal degradation with an endothermic enthalpy change, corresponds to thermal degradation of moisture content present in polymer material. The second curve, between temperatures ranges of 250°C– 280°C, has shown an exothermic enthalpy change. This could be addressed to the thermal decomposition of polymer.
As well as the CGC-FCT, it underwent thermal degradation with endothermic enthalpy changes between temperatures ranges of 80°–130°C and 320°C–350°C. The first curve could be addressed to the thermal dehydration and the second one is due to the thermal decomposition. However, these results have to be confirmed by another measurement, TGA analysis, in order to provide us an exact value.
3.2.
Polymeric structures produced from CGC
Page | 36
As mentioned previously, choline acetate was selected for this work due to its CH3COO- anion. These anions tend to create more stable bond with the hemiacetal group from CGC. The hydrogen bonds are disrupted by seizing proton from hydroxyl group or amino group from the polymer. The cleavage of the hydrogen bond will demolish the compact crystalline structure of chitin and lead to the dissolution of CGC. Previous studies on dissolving cellulose by ILs have suggested that the solvation mainly involved the interaction of the hydroxyl protons of the CGC polymer with the strong hydrogen bonding and coordinating anions, in particular CH3COO- [35].
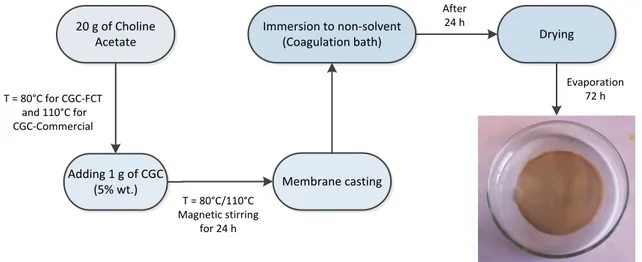
Biopolymer, such as CGC, is found to be soluble at 80°C in ionic liquids choline acetate, in concentrations up to 12% (w/w). [16]. Higher concentrations of biopolymers in IL resulted in solutions with too high viscosity to cast. In the present work, 5% (w/w) CGC concentration in IL is considered as a good composition. The dissolution of CGC polymer in choline acetate and the casting process are presented in Fig.3.3.
20 g of Choline Acetate
Adding 1 g of CGC
(5% wt.) Membrane casting
T = 80°C for CGC-FCT and 110°C for CGC-Commercial
T = 80°C/110°C Magnetic stirring
for 24 h
Immersion to non-solvent
(Coagulation bath) Drying
Evaporation 72 h After
24 h
Fig. 3.3: Schematic film casting process
Page | 37
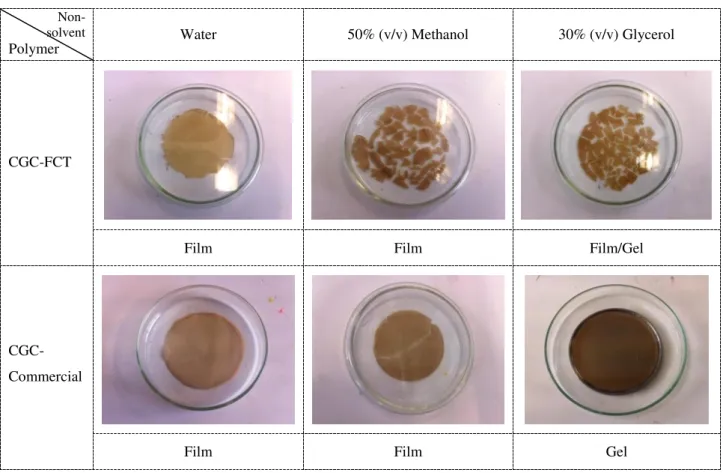
Several non-solvents were used to understand its influence in developing polymeric structure by regeneration of CGC polymer in biocompatible ionic liquid, Choline acetate. The different polymeric structures produced from CGC polymers are presented in Fig.3.4.
Non- solvent
Polymer Water 50% (v/v) Methanol 30% (v/v) Glycerol
CGC-FCT
Film Film Film/Gel
CGC-Commercial
Film Film Gel
Fig. 3.4: Polymeric structures, produced from CGC polymers in different non-solvents
Page | 38 Effect of dissolution temperature
Fig. 3.5: Produced CGC films with different dissolution temperature
The commercial CGC polymer is difficult to be dissolved in temperature below 100°C. When the polymer is not completely dissolved in the solvent, it leads to faster demixing of solvent and non-solvent. The required higher temperature for dissolving the commercial CGC could be due to the fact that CGC-Commercial contains more glucosamine, if we consider it in term of the ratio of glucosamine and glucan as observed in chapter 3.1.3, whereas hydrogen bond in glucosamine is more difficult to be disrupted by IL. The images of CGC films generated from different dissolution temperature are presented in Fig.3.5.
Effect of evaporation condition
Fig. 3.6: Produced CGC films with different evaporation condition
During the experiment, it was confirmed that the evaporation process is one of the most important parameters in developing CGC film structure. It can be observed from Fig. 3.6. that the crack creation upon drying occurred on the CGC-FCT dried in an open space (35±1% RH at 24°C). This problem can be prevented by smooth solidification process. This can be done by controlling the evaporation condition by means of a desiccator.
CGC-FCT, 50% MeOH, 57.7% RH at 25°C CGC-FCT, 50% MeOH, Normal drying
Page | 39
The characterizations, after the dissolution of CGC polymer and generation of polymeric structure, comprise the viscosity and viscoelasticity test followed by thermal property analysis. Sugar composition study of films and gels, and the analysis of total sugar released during the immersion precipitation were also analysed.
3.2.1. Rheology of CGC Mixtures
From the rheology study, it was observed that Choline acetate exhibits Newtonian liquid behaviour, with apparent viscosity stable at 0.13 Pa·s in room temperature (25°C), see Fig. 3.7.
The rheology study was carried out in temperature 80°C for FCT mixture and 110°C for CGC-Commercial mixture in order to mimic the processing temperature of both polymers. Interesting result was found in both mixtures, where both solutions exhibit a non-Newtonian shear thinning behaviour. It is discovered that the mixture of CGC-commercial shows stronger shear thinning effect compared to CGC-FCT mixture. It is recognized from the stiffer flow curve of its apparent viscosity when the shear rate was applied, as presented in Fig. 3.7.
Fig. 3.7: Flow curve of CGC mixtures and choline acetate
Page | 40
Fig. 3.8: Mechanical Spectrum of CGC-FCT film forming mixtures
Regarding the viscoelastic property, it can be observed from Fig.3.8 that the viscous modulus (G’’) higher than the elastic modulus (G’). Both G’ and G’’ values gradually increase but they do not crossover in the entire frequency range. Such frequency dependence nature in this measurement is the signature of the typical behaviour of a viscous solution with entangled polymer chains.
Fig. 3.9: Mechanical Spectrum of CGC-Commercial film forming mixtures
Page | 41
Additionally, for a strong gel, elastic modulus (G’) is typically 10 times larger than the viscous modulus (G’’) in plateau region. However, for a soft gel or a physical gel,G’ is often almost the same or less than G’’. As shown inFig.3.8,G’’ is 3-4 times higher thanG’ which also reveals that this sample behaves as soft gel.
3.2.2. Thermal properties of polymer mixtures and films
Thermal effects are distinct from the more or less straight line DSC curve. They are caused by the sample undergoing physical transitions or chemical reactions. Glass transition temperature (Tg) was taken at half-height of heat capacity increment. Crystallization (Tc) and melting (Tm) temperatures were taken at the peak maximum of the corresponding exotherm and endotherm. The glass transition temperature of polymer mixtures and generated polymeric structure is presented in Table 3.5.
Table 3.5: Glass transition temperature (Tg) of polymer mixtures and generated polymeric structure
Samples Glass transition temp. (Tg)
CGC FCT ND
CGC Commercial ND
Choline Acetate -88.34 °C
CGC FCT+Choline acetate 80 °C -85.27 °C
CGC Comm.+Choline acetate 110 °C -83.61 °C
CGC FCT film in Water -97.72 °C
CGC FCT film in MeOH -106.33 °C
CGC FCT film in Glycerol -90.99 °C
CGC Comm. film in Water -97.14 °C
CGC Comm. film in MeOH -97.37 °C
CGC Comm. film in Glycerol -92.50 °C
Page | 42
Fig. 3.10: DSC Result on dope solution and choline acetate (Cryo-DSC)
The transition from amorphous solid to crystalline solid is an exothermic process, and results in a peak in the DSC curve. Due to the continuous heating, the sample eventually reaches its melting temperature (Tm). The melting process results in an endothermic peak in the DSC curve. These Tc and
Tm can only be seen in the mixture of commercial CGC and choline acetate, which is 5.52 °C and 26.21 °C respectively.
The result shows that the Tg of choline acetate is higher than the previous measurement [16]. This could be the reason why the DSC result of the CGC polymer and Choline acetate mixture for both polymer also gives higher Tg values compared with the result reported by Henrique Marçal [16].
Page | 43
From Fig. 3.11, it can be noticed as well that both polymer mixtures have similar thermogram behaviours as Choline acetate. This could be addressed to the fact that Choline acetate is the used solvent in both mixtures. Even though the chemical reaction might be happened during the dissolution, however it can be identified that its composition is still dominating the mixture properties.
From Fig. 3.12 and Fig. 3.13, it can be observed that the polymer mixtures and choline acetate underwent dehydration between temperature 80 °C and 150 °C. They were decomposed at temperature close to 230 °C. The precise value of dehydration and decomposition temperature is shown in Table 3.6.
Fig. 3.12: DSC Result on produced membranes (Cryo-DSC)
Page | 44
Membranes that are produced by immersion in the same non-solvent show the same thermogram behaviour. From Fig. 3.13, it can be observed that all membranes underwent dehydration between temperature 80°C and 150°C. CGC-FCT and CGC-Commercial membranes immersed in glycerol have higher degradation and decomposition temperature compared with the produced membranes immersed in water and methanol. The difference is that the membrane produced with the commercial CGC has higher transition enthalpy compared to CGC-FCT membranes.
Table 3.6: Melting temperature and decomposition temperature of polymer mixtures and membranes
Samples
1st degradation (dehydration)
temperature
2nd degradation (decomposition)
temperature
Choline Acetate 156.68 °C 227.24 °C
CGC FCT+Choline acetate 80 °C 158.46 °C 222.99 °C
CGC Comm.+Choline acetate 110 °C 145.68 °C 190.81 °C
CGC FCT film in Water 131.49 °C 241.28 °C
CGC FCT film in MeOH 136.35 °C 224.45 °C
CGC FCT film in Glycerol 136.16 °C 292.60 °C
CGC Comm. film in Water 145.85 °C 248.25 °C
CGC Comm. film in MeOH 132.07 °C 243.44 °C
CGC Comm. film in Glycerol 148.16 °C 300.66 °C
All membranes encountered melting with decomposition behaviour. It can be recognized by the appearance of the second endothermic curve. These phenomena occurred due to the presence of impurities [29].
3.2.3. Sugar constituents in CGC films
Page | 45
Table 3.7: Sugar composition in produced films and gel
Polymer Glucosamine
Conc. (ppm) Glucan Conc. (ppm) Mannose Conc. (ppm) Ratio Glucosamine and Glucan
CGC-FCT Water 19.09 223.48 16.05 1:11.68
CGC-FCT MeOH 12.07 126.79 10.50 1:10.50
CGC-FCT Glycerol 5.34 73.08 9.70 1:13.68
CGC-Comm. Water 36.64 202.77 19.81 1: 5.53
CGC-Comm. MeOH 12.98 205.50 20.26 1:15.83
CGC-Comm. Glycerol 7.12 59.74 7.72 1:8.39
In general, the sugar composition is found higher in the membrane immersed in water as non-solvent, followed by methanol and glycerol. This phenomenon could be explained from the fact that the membrane is organic and water is an aqueous solvent where methanol and glycerol are an organic solvent. Hence, during the phase inversion, water will dissolve less sugar, followed by methanol because methanol only has one OH group. The non-solvent that could attract and interrupt most with our polysaccharide is glycerol because glycerol has three OH group, known as tri-hydroxyl alcohol. Hence, the sugar composition was found in small amount in the produced polymeric structures. The molecular structure of water, methanol and glycerol is presented in Fig. 3.14.
Water Methanol Glycerol
Fig. 3.14: Molecular structure of non-solvents
The ratio of glucosamine and glucan is reduced a lot compared with its ratio when is still in the polymer form. This could be due to the different solubility between glucan and glucosamine in ionic liquid. Glucosamine is known to be more difficult to dissolve than Glucan. As the consequence, glucosamine is easier to be washed out during the immersion precipitation process where glucan is able to maintain its composition in the casted polymer. Hence, in the end the composition of glucan in the membrane is much higher compared with glucosamine.
3.2.4. Total sugar analysis in coagulation bath
Page | 46
permanent and stable, thus it is used for quantification. The result of the measurement is presented in Table. 3.8
Table 3.8: Total sugar content in coagulation bath
Polymer Total Sugar (mg/L)
CGC-FCT Water 45.28
CGC-FCT MeOH 193.08
CGC-FCT Glycerol 52.05
CGC-Commercial Water 81.99
CGC-Commercial MeOH 74.88
CGC-Commercial Glycerol 149.29
The measurement was done two times. It was observed that CGC-FCT mixture precipitated more sugar when it was immersed in methanol compared to other non-solvent, namely water and glycerol.In the case of CGC-Commercial, it was observed that this mixture released most sugar when it was immersed in glycerol followed by other non-solvent, which are water and methanol respectively.
3.2.5. Contact Angle Analysis
Water contact angle measurement is the most common method for determining a material wettability. If the solid surface is hydrophilic, the contact angle will be less than 90°. The contact angle for produced films is presented in Fig. 3.15.
Fig. 3.15: Contact angle of CGC films produced in different non-solvents
Page | 47
The result reveals the hydrophilic nature of CGC films. The hydrophilicity is one of the most important factors that affect the cytocompatibility of biomaterials. The cell adhesion and growth are directly influenced by the wettability of the surfaces, once a major part of the cells prefers to anchor in hydrophilic surfaces [31]. However, for CGC-Commercial polymer immersed in glycerol is not possible to measure the contact angle because its polymeric structure is gel.
It is important to understand that in this experiment the associated gross error is significant. In each trial, several samples replicates were used to have a stable measurement. The concluding result recorded was for the trial considered by the operator to be the best. For best results the contact angle recorded in the first 100 ms was considered.
The characterization in the next phase would only involve the mechanical properties in term of puncture resistance and morphological study by SEM (Scanning Electron Microscopy) of the chosen films which are CGC-FCT and CGC-Commercial films generated with water as the non-solvent.
3.2.6. Puncture Test
Puncture helps to determine the stress at which the membrane will break. The puncture force (N) and the deformation (mm) of the probe at break were determined from the force deformation curves with the help of the TA-xT texture analyser software. Thickness of the membrane is measured using a micrometre. All experiments were performed in triplicate and the average values were calculated and given in Table 3.9.
For this measurement, only two types of films that were measured; FCT water and CGC-Commercial water. The stress strain data for the produced films in the present work is presented.
Table 3.9: Result of puncture test strain on CGC films
Sample Thickness (μm) Force at
break (N) τpuncture (kPa)
Normalisation, τpuncture (kPa)
per thickness (μm)
CGC-FCT film 230±15 0.162 51.66 0.225
CGC-Commercial film 124±3 0.189 60.08 0.484
The force needed to puncture the CGC-FCT membranes and CGC-Commercial membranes is nearly the same. In average, 51 kPa is needed to puncture CGC-FCT membranes until it breaks and 60 kPa for CGC-Commercial ones. From the result in Table 3.9, it can be seen that CGC-Commercial can sustain more puncture stress (τpuncture) compared to CGC-FCT. However, from the behaviour of force
Page | 48
The puncture stress and elongation at break are dependent on the membrane thickness. Hence, the membrane thickness can be used to normalise the puncture measurement in order to provide better correlation. Refer to the normalisation data, it can be concluded that with the same thickness, the film produced from Commercial is able to sustain forces two times higher compared to CGC-FCT film.
Table 3.10: Comparison of puncture stress with other polymers from the literature
Polymer Thickness (μm) τpuncture (kPa) (kPa) per thickness (Normalisation, τpuncture μm) Ref.
CGC-FCT 230 51.7 0.225 Present study
CGC (KiOnutrime®) 124 60.1 0.484 Present study
Chitosan 35 3.7 0.106 [45]
Chitosan 39.9 520.7 13.01 [49]
85% (v/v) Chitosan+
15% (v/v) Guar Gum 35 11.0 0.314 [45]
Kefiran 74 678.5 9.17 [46]
Kefiran+Glycerol 64 636.6 9.95 [47]
Guar Gum+Glycerol 16.6 732.1 44.1 [48]
Whey Protein Isolate 50 3,676 73.59 [50]
Page | 49
3.2.7. SEM Analysis
CGC-FCT CGC-Commercial
Fig. 3.16: SEM images of CGC films
The SEM analysis, in Fig.3.16, provides an adequate examination of film surface. It is clear from the images that distinctive film structures were formed on the surface. CGC-commercial has random pattern where CGC-FCT has smoother surface. From its cross section images, it is shown that both
T
op sur
fa
ce
C
ros
s s
ec
ti
on
B
ot
to
m
sur
fac
Page | 50
membranes have dense polymeric structures. The bottom surface of both films seems more flat and has fingerprint of the mould.
Having some roughness on the surface could be a positive influence to promote dermal fibroblast adhesion as a strong basis for future healing on skin regeneration, whereas the dense structure could prevent the wound from secondary infection [51]. However, small free volumes in polymeric structure will be needed to enable gaseous exchange of O2 and CO2.
Refer to the result of viscoelasticity test in chapter 3.2.1, CGC-FCT mixture exhibits a typical behaviour of a viscous solution with entangled polymer chains, where it is reported by Prasad et al. that the entanglement of polymer chains in the case of casting solutions will result in dense resulting membranes [38]. Hence, this rheology data shows a good agreement with the dense CGC-FCT film structure observed by SEM.
During the phase inversion process, precipitation kinetics provides important fundamental information regarding the membrane formation process. Delayed demixing is the term commonly used in membrane preparation to refer to a low precipitation rate, whereas instantaneous demixing refers to a high precipitation rate lead to film formation immediately after immersion.
In this experiment, when the cast polymer mixture was contacted with the non-solvent, liquid–liquid demixing occurs in low precipitation rate. It was observed that the film structure was not formed within finite period of time after immersion. Based on the literature [39], delayed demixing will result in a relatively dense film as it is confirmed by the SEM analysis.
![Fig. 1.5: Structure of choline based ionic liquids synthesize [17]](https://thumb-eu.123doks.com/thumbv2/123dok_br/16489705.733105/15.892.177.678.706.1014/fig-structure-choline-based-ionic-liquids-synthesize.webp)
![Fig. 1.6: Schematic representation of the required properties of wound dressing material [5]](https://thumb-eu.123doks.com/thumbv2/123dok_br/16489705.733105/17.892.278.609.677.987/fig-schematic-representation-required-properties-wound-dressing-material.webp)

![Fig. 2.13: Goniometer for a sessile drop, contact angle and the three interfacial tension [29]](https://thumb-eu.123doks.com/thumbv2/123dok_br/16489705.733105/29.892.313.581.550.766/fig-goniometer-sessile-drop-contact-angle-interfacial-tension.webp)