Ana Filipa Morgado Gaspar
Decision Support Methodology when
Entering New Markets for a
Semi-Finished Bronze Products Foundry
Dissertação para obtenção do Grau de Mestre em Mestrado Integrado em Engenharia e Gestão Industrial
Orientador:
Professor Doutor António Bárbara Grilo
Composição do Júri:
Presidente:
Professora Doutora Isabel Maria do
Nascimento Lopes Nunes
Vogais:
Professor Doutor Izunildo Fernandes Cabral;
Professor Doutor António Bárbara Grilo
Decision Support Methodology When Entering New Markets for a Semi-Finished
Products Bronze Foundry
Copyright©: Ana Filipa Morgado Gaspar, Universidade Nova de Lisboa – Faculdade de Ciências e Tecnologia.
ii
iii
Acknowledgements
Thank you to Professor Doctor Antonio Grilo, my supervisor, for all the encouragement, motivation, availability, suggestions and text review that contributed to the success of this dissertation.
Thank you to my closest friends and especially to my beloved Tobias for pushing me to go further and encourage me through this journey.
v
Resumo
O mundo e sociedade em que vivemos, desenvolve-se cada vez mais a uma velocidade crescente. De forma a que as empresas se mantenham competitivas, estas têm, cada vez mais, de optar por decisões estratégicas de forma a serem bem-sucedidas. Quando o momento de estudar novos mercados e clientes se avizinha, há que avaliar a situação e perceber estrategicamente qual o caminho a seguir. No contexto das fundições de semielaborados de bronze, fábricas que se englobam num ambiente business-to-business, é fundamental entender que se atua num mercado competitivo pela tecnologia utilizada, standards de qualidade e preços praticados. De forma a fazer frente a empresas rivais que também têm em vista o potencial alargamento de mercado, faz com que cada vez mais empresas apostem em modelos de decisão, para as auxiliar a tomar medidas fundamentadas e estudadas para ter sucesso. Nesta dissertação é sugerido uma metodologia que engloba o cruzamento de várias ferramentas. PESTLE, SWOT e modelos de decisão multicritério cruzam resultados para que possa ser possível apoiar os gestores destas fundições a tomar decisões competitivas. A secção correspondente a modelos de decisão multicritério, foi baseada no Analytic Network Process. A dissertação foi desenvolvida dentro de uma fundição de semielaborados de bronze localizada na Alemanha, que tem como ambição explorar os mercados do Brasil, Argentina, Chile e Mexico.
Palavras-Chave: Business-to-Business, PESTLE, SWOT, Modelos de Decisão Multicritério,
vii
Abstract
The world and society that we live in nowadays, develops itself with an astonishing speed. In order for companies to keep themselves competitive, they have, more and more, to choose strategic decisions to be successful. When the moment to study new markets and new clients arrive, it is important to evaluate the situation and understand, in a tactical way, which choice is the best to go. In the context of semi-finished bronze products foundry, factories that are within a business-to-business environment, it is fundamental to understand that they are playing in a very competitive market in terms of technology, quality standards and prices. To deal with competitors that also aim to extend their market, enterprises are betting in decision models to help them to make better decisions and to succeed. In this dissertation, a decision support methodology is suggested that crosses several tools. PESTLE, SWOT and multi-criteria decision-making matchmake results to help decision makers and managers to make competitive decisions. The section that explains the decision-making process was based on the Analytic Network Process. This dissertation was developed within a semi-finished bronze products foundry, located in Germany. This company has the will to expand to Brazil, Argentina, Chile and Mexico.
ix
Index
Acknowledgements ... iii
Resumo ... v
Abstract ... vii
Index ... ix
Figure Index ... xi
Table Index ... xiii
List of Abbreviations ... xvi
1. Introduction ... 1
1.1 Context ... 1
1.2 Objectives ... 2
1.3 Research Methodology ... 3
1.4 Research Contribution of this Study ... 5
1.5 Dissertation Structure ... 6
2. Strategic Tools ... 7
2.1 Business to Business – B2B ... 7
2.2 PESTLE Analysis ... 9
2.3 SWOT Analysis ... 11
3. Decision Making Tool ... 15
3.1.1 Analytic Hierarchy Process ... 16
3.1.2 The Fundamental Scale ... 18
3.1.3 Analytical Network Process ... 22
3.1.3.1 ANP Steps ... 25
3.1.3.2 Supermatrix ... 26
3.1.4 AHP vs ANP ... 29
4. Proposed Methodology ... 33
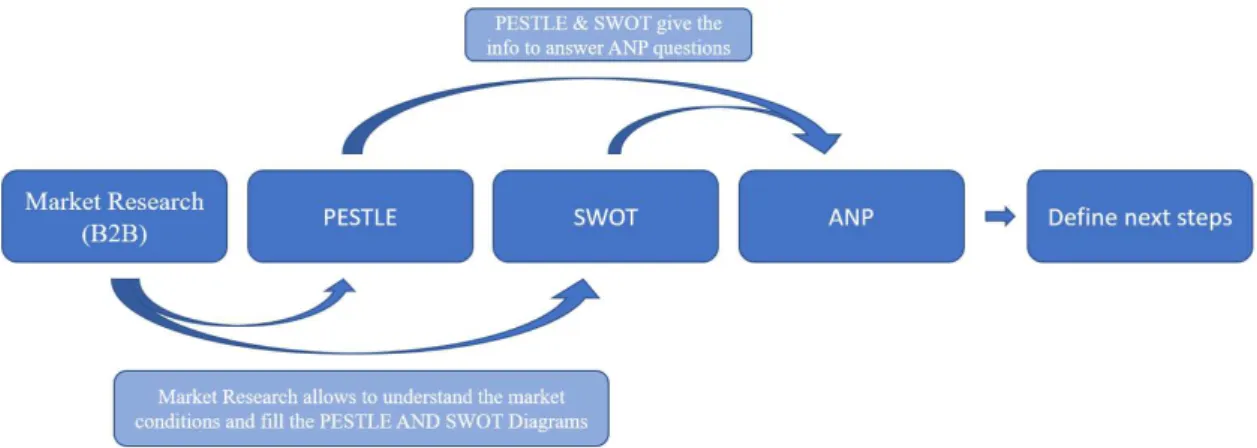
4.1 Strategic Tools Appliance ... 33
x
4.2.1 Proposed ANP Model ... 37
5. Case Study: Company X ... 41
5.1 Data Gathering ... 43
5.2 Decision Support Methodology ... 43
5.2.1 Business to Business – B2B ... 43
5.2.2 PESTLE Analysis ... 45
5.2.3 SWOT Analysis ... 47
5.2.4 Analytic Network Process ... 48
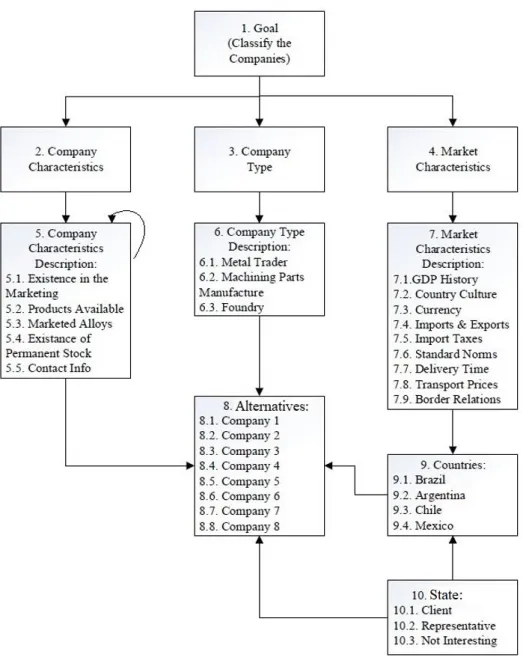
5.2.4.1 ANP Model ... 49
5.2.4.2 Data Gathering and Inquiries ... 50
5.2.4.3 Pairwise Comparison ... 62
5.2.4.4 Super Matrix formulation and Analysis ... 74
6. Results Discussion ... 79
7. Conclusions and Recommended Future Work ... 81
8. References ... 85
xi
Figure Index
Figure 1.1 – Research Methodology Diagram ... 5
Figure 2.1 - SWOT Diagram ... 12
Figure 3.1 – Example of a 3 level Hierarchy ... 18
Figure 3.2 – Hierarchy bs Network ... 23
Figure 3.3 - Overall Goal: Market Share of Competitor Group ... 24
Figure 3.4 Types of Components in a Network ... 27
Figure 3.5 Supermatrix of a Network ... 28
Figure 3.6 Block of the Supermatrix ... 28
Figure 3.7 Structure and Supermatrix of a Hierarchy ... 29
Figure 3.8 Structure and Supermatrix of a Holarchy ... 29
Figure 4.1 Proposed Methodology ... 33
Figure 4.2 ANP Steps ... 37
Figure 4.3 - ANP General Model ... 38
Figure 5.1 – Continous Cast Semi Finished Bronze Products ... 41
Figure 5.2 – Continous Casting Process ... 42
Figure 5.3 – ANP Model ... 49
Figure 5.4 - Priorities ... 75
Figure 5.5 - Weighted Super Matrix ... 76
Figure 9.1 - Comparisons between Company Characteristics node and Company Characteristics Description cluster ... 89
Figure 9.2 - Comparisons between Company Type node and Company Type Description cluster ... 90
Figure 9.3 - Comparisons between Market Characteristics node and Market Characteristics Description cluster ... 90
Figure 9.4 - Comparisons between Existence in the Market node and Alternatives cluster ... 91
Figure 9.5 - Comparisons between Existence in the Market node and Company Characteristics Description cluster ... 91
Figure 9.6 - Comparisons between Products Available node and Alternatives cluster ... 92
Figure 9.7 - Comparisons between Products Available node and Company Characteristics Description cluster ... 92
Figure 9.8 - Comparisons between Marketed Alloys node and Alternatives cluster ... 93
Figure 9.9 - Comparisons between Marketed Alloys node and Company Characteristics Description cluster ... 93
xii Figure 9.11- Comparisons between Permanent Stock node and Company Characteristics
Description ... 95
Figure 9.12 - Comparisons between Contact Info node and Alternatives cluster ... 95
Figure 9.13 - Comparisons between Contact Info node and Company Characteristics Description cluster ... 96
Figure 9.14 - Comparisons between Metal Trader node and Alternatives cluster ... 96
Figure 9.15 - Comparisons between Foundry node and Alternatives cluster ... 96
Figure 9.16 - Comparisons between GDP History node and Countries cluster ... 96
Figure 9.17 - Comparisons between Country Culture node and Countries cluster ... 97
Figure 9.18 - Comparisons between Currency node and Countries cluster ... 97
Figure 9.19 - - Comparisons between Imports and Exports node and Countries cluster ... 97
Figure 9.20 - Comparisons between Import Taxes node and Countries cluster ... 97
Figure 9.21 - Comparisons between Standard Norms node and Countries cluster ... 98
Figure 9.22 - Comparisons between Delivery Time node and Countries cluster ... 98
Figure 9.23 - Comparisons between Transport Prices node and Countries cluster ... 98
Figure 9.24 - Comparisons between Border Relationship node and Countries cluster ... 98
Figure 9.25- Comparisons between Brazil node and Alternatives cluster ... 99
Figure 9.26 - Comparisons between Argentina node and Alternatives cluster ... 99
Figure 9.27 - - Comparisons between Chile node and Alternatives cluster ... 99
Figure 9.28 - Comparisons between Mexico node and Alternatives cluster ... 99
Figure 9.29 - Comparisons between Client node and Alternatives cluster ... 100
Figure 9.30 Comparisons between Client node and Countries cluster ... 100
Figure 9.31 Comparisons between Representative node and Alternatives cluster ... 101
Figure 9.32 Comparisons between Representative node and Countries cluster ... 101
Figure 9.33 - Comparisons between Not Interesting node and Alternatives cluster ... 102
Figure 9.34 - Comparisons between Criteria Cluster ... 102
Figure 9.35 - Comparisons between Company Characteristics Description Cluster and Alternatives cluster ... 102
xiii
Table Index
Table 3.1 The Fundamental Scale ... 19
Table 3.2 – Consumption of Drinks in the USA ... 21
Table 3.3 – Derived Scale ... 21
Table 3.4 – AHP and ANP applications ... 32
Table 5.1 PESTLE Analysis... 46
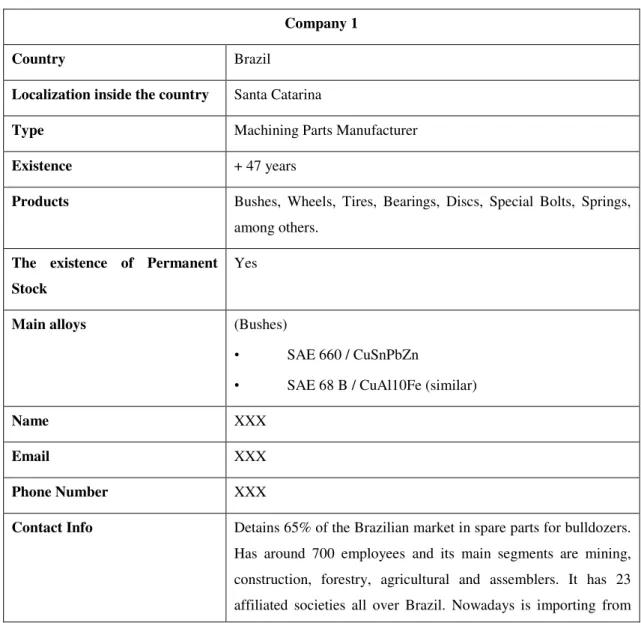
Table 5.2 Company 1 Characteristics ... 51
Table 5.3 Company 2 Characteristics ... 52
Table 5.4 Company 3 Characteristics ... 53
Table 5.5 Company 4 Characteristics ... 54
Table 5.6 Company 5 Characteristics ... 55
Table 5.7 Company 6 Characteristics ... 56
Table 5.8 Company 7 Characteristics ... 57
Table 5.9 Company 8 Characteristics ... 58
Table 5.10 Example of Question 1 ... 61
Table 5.11Example of Question 2 ... 61
Table 5.12 Criteria pairwise comparison with respect to Goal ... 62
Table 5.13 Node Comparisons to Respect to Goal ... 63
Table 5.14 Normalised criteria pairwise comparison ... 64
Table 5.15 Consistency Vector Table ... 64
Table 5.16 Random consistency index (Saaty, Thomas L; Vargas, 2006) ... 65
Table 5.17 Comparisons between Company Characteristics node and Company Characteristics Description cluster ... 65
Table 5.18 Comparisons between Company Type node and Company Type Description cluster ... 66
Table 5.19 Comparisons between Market Characteristics node and Market Characteristics Description cluster ... 66
Table 5.20 Comparisons between Existance in the Market node and Alternatives cluster ... 66
Table 5.21 Comparisons between Existence in the Market node and Company Characteristics Description cluster: ... 66
Table 5.22 Comparisons between Products Available node and Alternatives cluster ... 67
Table 5.23 Comparisons between Products Available node and Company Characteristics Description cluster ... 67
xiv Table 5.25 Comparisons between Marketed Alloys node and Company Characteristics
Description cluster ... 68
Table 5.26 Comparisons between Permanent Stock node and Alternatives cluster ... 68
Table 5.27 Comparisons between Permanent Stock node and Company Characteristics Description ... 68
Table 5.28 Comparisons between Contact Info node and Alternatives cluster ... 68
Table 5.29 Comparisons between Contact Info node and Company Characteristics Description cluster ... 69
Table 5.30 Comparisons between Metal Trader node and Alternatives cluster ... 69
Table 5.31 Comparisons between Foundry node and Alternatives cluster ... 69
Table 5.32 Comparisons between GDP History node and Countries cluster ... 69
Table 5.33 Comparisons between Country Culture node and Countries cluster ... 70
Table 5.34 Comparisons between Currency node and Countries cluster ... 70
Table 5.35 Comparisons between Imports and Exports node and Countries cluster ... 70
Table 5.36 Comparisons between Imports Taxes node and Countries cluster ... 70
Table 5.37 Comparisons between Standard Norms node and Countries cluster ... 71
Table 5.38 Comparisons between Delivery Time node and Countries cluster ... 71
Table 5.39 Comparisons between Transport Prices node and Countries cluster ... 71
Table 5.40 Comparisons between Transport Prices node and Countries cluster ... 71
Table 5.41 Comparisons between Brazil node and Alternatives cluster ... 72
Table 5.42 Comparisons between Argentina node and Alternatives cluster ... 72
Table 5.43 Comparisons between Chile node and Alternatives cluster ... 72
Table 5.44 Comparisons between Mexico node and Alternatives cluster ... 72
Table 5.45 Comparisons between Client node and Alternatives cluster ... 72
Table 5.46 Comparisons between Client node and Countries cluster ... 73
Table 5.47 Comparisons between Representative node and Alternatives cluster ... 73
Table 5.48 Comparisons between Representative node and Countries cluster ... 73
Table 5.49 Comparisons between Not Interesting node and Alternatives cluster ... 73
Table 5.50 Comparisons between Criteria Cluster ... 74
Table 5.51 Comparisons between Company Characteristics Description Cluster and Alternatives cluster ... 74
Table 5.52 Comparisons between State Cluster ... 74
xvi
List of Abbreviations
ANP Analytic Network Process AHP Analytic Hierarchy Process PWCs Pair-Wise Comparisons B2B Business-to-Business B2C Business-to-Consumer CI Consistency Index CR Consistency Ratio
1
1.
Introduction
1.1
ContextDecision making has become one of the most important aspects when significant times arrive. If companies want to become competitive, new approaches must be taken into consideration. Choosing a new market to operate is a strategic choice that businesses deliberate. In order to do that, it is recommended in this thesis to combine strategic analysis tools and decision-making tools to come up with a methodology that helps business managers taking decisions.
One tool that can be used to help taking conclusions is the ANP. This method is a general form of the Analytic Hierarchy Process (AHP) used in multi-criteria decision analysis. The AHP is a method that can be used to measure social and physical domains. In order to feedback networks, it is used the generalization of the AHP model, the ANP. Besides modelling a problem and establishing a hierarchy, it also pairwise comparisons to establish relations within the structure. This way is possible to connect and interact at several levels to reach the best conclusion. (L. Saaty & G. Vargas, 2006). In this dissertation, this network is feed by the results given from the strategic tools PESTLE and SWOT. Like this is possible to evaluate some market variables that are crucial for this study. From the combination of this strategic analysis tools and decision-making tools, results in a methodology that can be used when a business wants to expand to new markets and take an action.
2 Acting within this economic environment is the German Company X This thesis it is written within a real project for this enterprise. Having in consideration the market conditions nowadays, the company decided to explore the South America area and explore the possibility to work there with some of their products. Having some corporate decisions to make and questions to answer, this thesis helps to reach a conclusion. Starting with a study of the South America market using strategic tools and showing a well-defined business plan, becomes easier to identify which conditions are present. Afterwards, the Analytic Network Process (ANP) will be applied, which allows selecting the best option after prioritizing all the possibilities.
Company X is a global supplier to the automotive industry that is remarkably well known for the low emissions, reduced fuel consumption, upgraded performance, reliability, quality, and safety when it comes to product engineering and development. This company operates inside the area with products and component segments related with air supply, emission control and pumps. They also develop, manufacture and market supply of pistons, engine blocks, and plain bearings. Since it is an international company, it operates around the globe.
1.2
ObjectivesThe main objective of this dissertation is to be a strategic model to support semi-finished bronze products foundries making decisions when they want to explore new markets and decide next steps with players from the field. The first approach consists in applying several tools, that allow analysing the different characteristics of the markets. Having in consideration the main tool applied to this methodology, the ANP, it is important to organize all the information, understand the characteristics of the business and discuss the variables, that is going to be used in the decision tool to reach the verdict. Since the topic relates to economic, political, technology applications with benefits, opportunities, costs and risks, and these subjects are dependent on each other, the ANP fits perfectly into this topic. To analyse the different clusters of the decision-making toll, some market research has to be done. It is important to mention, that the markets that are being analysed, are the ones that the businesses want to explore. Political, Economic, Social, Technological, Legal & Environmental analysis (PESTLE) is used to collect and present that relevant data. A complementary tool that is important to use, is the Strengths, Weaknesses, Opportunities and Threats analysis (SWOT). It is possible to compare characteristics from inside the company with the market environment.
3 This info that is gathered by these connections is the one that is used to feed the strategic and decision-making tools.
The model will be applied to Company X within the South America markets, combining strategic and decision methods. The Company X, located in Germany, belongs to a big German company where the main goal is to explore three different Continuous Cast Metal Alloys Products (Basic Programme, Customized and High Precision) and to analyse if it is worth it to enter the South American Market and if yes, which companies invest time first and how. The interest is around four countries, Brazil, Chile, Argentina and Mexico.
1.3
Research MethodologyThis dissertation is essentially motivated by the combination of several scientific papers, books and by the discussion with several professionals of the area. The book Decision Making With The Analytic Network Process written by Thomas L. Saaty and Luis G. Vargas, and two other master thesis from Cabral (2011) and Abreu (2013), where ANP is used in two different ways were essential for the decision marking part. The book gives the theoretical support that is needed and the thesis shows examples of the ANP applied in a real context. For the ANP is fundamental to make pair comparisons, judgements and create criteria. It is an established one network that has several levels of interacting with each other. It is also important to relate that in this method, are the criteria that determine the importance of the alternatives in a network but is also important that the alternatives themselves determine the importance of the criteria in a network. In practice, several conversations with the company experts were held to decide the elements to include on each cluster of the ANP. Then, it was necessary to make questionnaires in order to get the judgments of the Pair-Wise Comparisons. The book Decision Making With The Analytic Network Process written by Thomas L. Saaty and Luis G. Vargas, and two other master thesis from Cabral (2011) and Abreu (2013), where ANP is used in two different ways. were essential for this research. The book gives the theoretical support that is needed, and the thesis shows examples of the ANP applied in a real context. To modelling the ANP network it was used Super Decisions software.
4 strengths, weaknesses opportunities and threats. Like the first step, at this point, it is also important to be informed via journal articles, books and studies. But it is also necessary to get information about the characteristics of the business. Meetings in form of interviews have to be done with experts on the subject.
Since the goal is to explore new markets, having a Macro point if view became very important. Like this, it is possible to see the characteristics in a global way and at the same time revealing marketing activities, processes, institutions and flow of goods and services from a social perspective. Then explore a Micro point of view, where the immediate environment that impacts a business is exposed. Suppliers, customers and stakeholders, including local government agencies or regulatory bodies are analysed. To do that, and to update data, it is necessary to be constantly informed about what is going on. Reading journal articles, books and studies about the markets it shows to be the best way to do it.
Also, to get information about the market conditions and info about the real situation of what was going on in markets that are being studied, it is crucial the communication by phone and phone calls. As said before and, since this business is B2B, it is the relationships with companies in the studied markets that allow getting direct info from the field. Calling and texting with possible clients from the other areas is a crucial source of information.
The research starts with the proposal of realizing the dissertation within the Company X. The German company came up with a problem related to the South America market that needed to be solved. Since the language was a restriction, they were looking for a person that could speak Portuguese or Spanish. After a phone interview and the documents required delivered, the possibility to join the project became settled. The main goal is to answer the question: Is it worth it to act in South America with the German Continuous Cast Product and if yes, where to act? If so, which companies attract and in which way?
With the central tasks defined, the work within the company began. The first visit to all the facilities was provided to better understand how the industries operate. Several questions were made to the experts to figure out if the theoretical background of the dissertation could be implemented into the real problem. It became clear that the primary step is to study the market, identify the important variables of the business and make the final decision on what to do using the ANP method.
5 Figure 1.1 – Research Methodology Diagram
The literature review that follows in Chapter 2, and having in consideration all the methods applied in this thesis, has the main objective to show the importance of these tools combined with each other represent. What is the definition of each method? What is their appliance? What are their individual advantages to using them? And Disadvantages? How can value be created to a business combining strategic and decision tools?
1.4
Research Contribution of this StudyThis study attends to help companies that have or are semi-finished bronze foundries within their businesses, in order to support making decisions when they decide to explore new markets. Although the use of the marketing tools, at the first sight, appears to be simple, is the combination of all the tools and especially with the ANP model, that allows creating this methodology. Analysing companies that have a solid business in the area, there is not one of them that doesn’t need to continuously grow or to improve their strategy. Nowadays the speed of information and
grow is huge and, if the businesses don’t keep up, their competition can rise faster and bring
6 Due to that, this Decision Support Methodology When Entering New Markets for a Semi-Finished Bronze Products Foundry brings already a strategy on how to act when the moment to grow arrives. If there is a chance for the company to explore new markets, there is a methodology that can be followed and that is described in this dissertation.
1.5
Dissertation StructureThis dissertation is organized into six chapters. Each one of them has several sub-chapters which describe several important points related to the main one.
• Chapter 1 makes the introduction of all the document. It is where the context, objectives,
research methodology and research contribution are described. • In Chapter 2, literature review on PESTLE, SWOT
• Chapter 3 is where is written the literature review on Models for Decision Making,
specifically ANP
• Chapter 4 describes the proposed methodology of this thesis
• Chapter 5 presents the case study. After defining the method theoretically, it is applied to
a real case and described in this section.
•
Chapter 6 describes the results discussion. Here are presented the results and comments to the methodology applied to Company X.• Chapter 7 has the conclusions from the proposed methodology and also recommendations
to apply to future work.
7
2.
Strategic Tools
This literature review includes knowledge including substantive findings, as well as theoretical and methodological contributions to the topics related to this thesis. It is a secondary source and does not report new or original experimental work about this methodology. Its main objective is to answer the following questions:
- Which are the tools and models that help to support this methodology?
- How do they differ from each other and what is the most adequate and most up to date tool available?
- How can they contribute to the decision making?
- How should semi-finished products bronze foundry evaluate if it is good to enter in a new market?
This literature review covers the reasons why these tools and models were used instead of others, which is the operational performance that distinguishes them and more importantly, whether these tools and models compete or complement each other.
In this chapter together with Chapter 3, the relevance and review of each topic are handled separately. The main topics are the following: Brief B2B introduction, PESTLE, SWOT and the main focus of the literature review is related with the decision-making models and why ANP is the best fit for this specific case.
Although there are a lot of strategic tools available to use in methodologies like this one, PESTLE and SWOT analysis showed to be the best fit. For the purpose of this methodology, it is necessary to do study some aspects of the market. These tools allow analyzing the importance and significative aspects that are necessary to feed the ANP network. Also, these tools are commonly used in the academic area and already proved a lot of times their value and quality.
2.1
Business to Business – B2BBusiness to Business is when companies focus their on transactions of products produced for consumption by other businesses (industry tools, office provisions and the like) as well as the objects that went into the production process of those other organizations (for example, raw materials like timber or parts, petroleum, other ingredients like bearings, valves, resins and polymers). (Lilien; & Grewal, 2011)
Over the years, the terms have changed. The term ‘industrial marketing’ has changed to the term
8 value-generating relationships (including both products and services) between organizations (which include businesses but also government agencies, non-profit organizations and the like) and the many individuals within them. In contrast Business to Consumer (B2C), businesses are mostly focused on the final transaction between the firm and the consumer. (Lilien; & Grewal, 2011)
More and more attention has been given to relationship over the past few decades as buyers and suppliers seek ways to boost profits through sustained relationships (Graça, Barry, & Doney, 2016). In order to meet the requirements of today’s market, managers are looking for new sources of value creation as well as opportunities and directions for ensuring continuous improvement of processes carried out in supplier-buyer relationships. One of the most important areas that determine the competitiveness of the supply chain is a reliable supplier base. It can be effectively configured by building partnerships based on trust, risk analysis and wide integration. In the face of a great uncertainty of the business conditions, apart from the prevention against different disturbances, it is essential to effectively respond to the changes occurring in the internal and external environment of the supply chain to minimize their negative impact (Wieteska & Christopher, 2016).
In fact, several studies have emphasised the need to build and sustain relationships not just between suppliers and customers, but spanning the entire network of a business market, which involves a vast number of stakeholders (Cayla, Cova, Management, & Maltese, 2013).
A key difference between companies in the process industries and those in other manufacturing
industries is the former’s often long, complex and rigid supply/value chains. Moreover, the context for innovation differs radically; in the process industries, development takes place in laboratories and pilot plants rather than in a design office, and the final quality of products is often strongly related to available raw material properties. As a result, there is an intimate relationship between product and process innovation, summarized in the idea that “the process is theproduct” (Tottie, Lager, & Nordqvist, 2016).
9
2.2
PESTLE AnalysisThere are several definitions for PESTLE analysis. It can be a tool that identifies factors that can affect the organization and it helps to find a way to overcome problems, it can also be seen as a tool to be used to scan the present and the possible external future environment. Having these ideas in mind, it is possible to see PESTLE analysis as a tool that consists with all factors that has in the external organization and it will help the organization to predicts what will happen in the future and then find a way to overcome this factors (Maliki, Ezqhallel, Jahrin, Shairah, & Kamarulzaman, 2012).
Before PESTLE started to be used, it was known as PEST analysis. Then, the legal and environment factor were added in recent times. Since it started to be used for industry analysis, scientific analysis and ethics analysis, it made sense to add those two factors (Kralj, 2009).
PESTLE is a framework that analyses macro-environmental factors. Its letters stand for:
• P – Political Factors, what are the key Political Factors? - these cover various forms of
political lobbying and government interventions activities in an economy.
• E – Economic Factors, what are the important Economic Factors? - these mainly cover
the macroeconomic circumstances of the external environment but can also include seasonal/ weather considerations.
• S – Social Factors, what Cultural Aspects are most important? - these covers social,
people state of mind, demographic and cultural factors of the external environment. • T – Technological Factors, what Technological Innovations are likely to occur? - they
include technological changes that affect the external environment, technology-related activities, technology incentives and technological infrastructures.
• L – Legal Factors, what current and impending Legislation may affect the industry? -
there are certain laws that affect the business environment in a certain country while there are certain policies that companies maintain for themselves.
• E – Environmental Factors, what are the Environmental considerations? - These factors
include all those that influence or are determined by the surrounding environment. This aspect of the PESTLE is crucial for certain industries particularly for example tourism, farming, agriculture etc.
10 cannot be understood without having the data relevant to the specific business environment. The term Business environment can be defined as all relevant physical and social factors outside an organization that are considered in the decision-making process. PESTLE analysis assumes that specific indirect and external conditions that describe the business environment, can influence the organisational capacity to produce value. It can also be said that the PESTLE analysis provides a
“satellite view” to evaluate the external environment (Chao, Peng, & Nunes, 2007).
PESTLE is used when:
• Working in the strategic team • Considering new strategies
• Releasing a new product or service • Entering a new region or country
PESTLE has been traditionally used in several different ways. The two most commons are: first, to examine the situation of a particular organisation or industry sector within a particular business environment; second, to examine the viability of general management solutions in a business environment (Chao et al., 2007). It is also a useful technique to know if you are part of a strategic project team. In all of these instances, there is a need to assess the potential impact of external factors on your organization, from both an operational and a market perspective. It is a company’s environmental factors audit to inform strategic decision-making, marketing planning, organizational change, and product development, etc. (Ho, 2014)
However, PESTLE is far from being a precise and clearly circumscribed analysis framework. There is an almost unlimited number of variables that may emerge from each dimension. Therefore, there is the need to prioritise those variables that have the highest impact on the industry, sector, or country being studied.
In a summary, to maximize the benefit of the PESTLE Analysis it should be used on a regular basis within an organization to enable the identification of any trends. The impact of a certain external factor may have more severe consequences for a particular division or department and the PESTLE technique can help clarify why change is needed and identify potential options. As with all techniques, there are advantages and disadvantages to using it to help organizational strategy:
Advantages:
11 - Helps to decrease the impact and effects of potential threats to the organisation
- Aids and encourages the growth of strategic thinking within your organisation
- Provides a mechanism that allows the organisation to recognise and exploit new opportunities
- Enables the manager to assess implications of entering new markets both nationally and globally. (Kotler & Keller, 2012)
Disadvantages:
- Managers can oversimplify the information that is used for making decisions
- The process has to be led regularly to be effective and often organizations do not make this investment
- Managers must not succumb to “paralysis by analysis” where they gather too much information and forget that the objective of this tool is the identifications of issues so that action can be taken
- Organizations frequently restrict who is involved due to time and cost considerations.
This limits the technique’s efficiency as a key perspective may be missing from the discussions
- Manager’s access to quality information is often restricted because of the cost and time needed to collate it.
- Assumptions often form the basis for most of the data used, making any decision made based on such data subjective. (Kotler & Keller, 2012)
2.3
SWOT AnalysisSWOT analysis has its origins in the 1960s. It is based on the view of the internal resources, capabilities and core competencies of the organization, and advocates building strategies on these foundations to assure the competitiveness of the organization and the attractiveness in the area to further develop the resource-based view arguing that a resource was strategic if it satisfied the criteria for being effective and efficient. (Dyson, 2004)
12 Throughout strategy definition, the outcomes of the external and internal environmental analyses are summarised and combined to examine the situation facing the organisation and identify choices. When defining the business strategy, the aspects outside the management’s control are examined within the context of the organisation and its resources. One of the techniques that may be used to define organisational strategy is SWOT analysis. (Kotler & Keller, 2012)
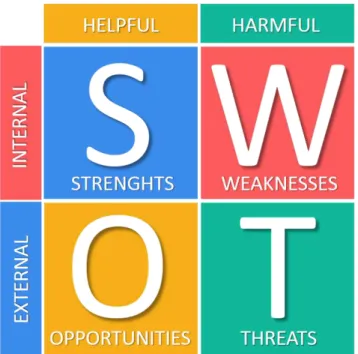
The SWOT analysis is one of the oldest and best-known organizing frameworks in management. This business analysis method allows organisations to analyse their performance for each of its products, services, and markets when deciding on the best way to achieve future development. The procedure includes identifying the strengths and weaknesses of the organization, and opportunities and threats present in the market that it operates in. The first letter of each of these four aspects creates the acronym SWOT. (Cadle, Paul, & Turner, 2010)
Figure 2.1 - SWOT Diagram
• S – Strengths, what do we do well? What resources do we have at our disposal? -
Strengths deliver an area to list everything done right either individually or as an organization. This section contains both strengths within the organization and external strengths, such as client relationships.
• W – Weaknesses, what can we improved or altered?What do we do badly? - Weaknesses
13 • O – Opportunities, Is this market situation a breakthrough? - Opportunities are factors
that represent reasons for the business that are likely to prosper. Such as being able to expand a franchise into a new city, while some others may appear with pure luck, such as another country opening up its market to foreign business.
• T – Threats, Is this new customer behaviour normal? - Threats include external aspects
beyond companies’ control that could place the strategy, or the business itself, at risk.
There is no control over these, but sometimes organisations may benefit by having contingency plans to address them if they should occur.
The completion of a SWOT analysis should help organisations decide which market segments offer the best opportunities for success and profitable growth over the cycle of the product or
service. It helps to identify the companies’ position towards its competitors, identify best future opportunities and highlight current and future threats. (Cadle et al., 2010)
These definitions are exposed to interpretation and a weakness of the SWOT technique is that it can be highly subjective. Some features will always be easy to classify, and the point is that the strength of this method, comes from the fact that it can be applied to many different organizational situations, must be done with clear thinking and good judgment to obtain any real value from using it. The procedures of clearly identifying the business objective and categorizing the SWOT factors are equally important because they are interdependent. (Valentin, 2013)
This interdependence means that the SWOT analysis is frequently an iterative process in which the findings cause the objective to be reset and another analysis made. The output of any analysis is not necessarily definitive. (Chang & Huang, 2006)
Advantages:
- Helps to better understand the business - Shapes organization’s strengths
- Develops business goals and strategies to achieve them - Identifies the core competencies of the firm
- Maximize its response to opportunities - Reverse its weaknesses
- Overcome organization’s threats
- Assists in clarify objectives for strategic planning
14 Disadvantages:
- Can produce a lot of information, but not all of it is useful. - Doesn't deliver solutions or offer alternative decisions - Doesn't prioritise issues
15
3.
Decision Making Tool
Analysis to break down a problem into its essential components to study their behaviour has been the main tool of scientific review to test hypotheses and solve problems. It has confirmed to be tremendously effective in dealing with the world of matter and energy. It has allowed a man to harness the energy of the atom, to land on the moon, to invent the computer, to master global communication, and to produce tens of thousands of useful and not so useful things.
People that work within science whose theories are based on the use of Cartesian axes and on scales of measurement believe that there is only one way to measure things. In their way of thinking, it is needed a physical measurement scale with a zero and a unit to apply to objects. If we based our understanding and judgements, that are the most fundamental determinants of why we want to measure something, we can also derive accurate and reliable relative scales that do not have a zero or a unit.
When someone has the role as a decision maker, generally it assumes that logical thinking is the best and only way to make good decisions. By doing that, it is neglected the observation of our mind in both rational and emotional. The emotional side of each person, is often related to feelings and hunches, while the rational side is related to logical and structured reasoning.
The paradigm of measurement has numerous practical implications. It makes it possible for us to deal with intangible factors together with tangibles used in science and mathematics in a realistic and justifiable way.
Decision makers were always worried, for a long time, with the evaluation of physical and psychological actions. By physical, means what is known as tangibles in so far as they constitute some kind of reality external to the individual conducting the evaluation. In the opposite side, the psychological conclusions used in decision making belong to the subjective ideas, feelings, and beliefs of an individual, of a group working together, and more generally, of society. The question is: Is there an articulate theory that involves both these realities without compromising either? (L. Saaty & G. Vargas, 2006)
16 In fact, there were no operative ways to combine rationality and hunches in a structured and mathematical way. The introduction of the MCDM with two of its theories, the Analytic Hierarchy Process (AHP) and its generalization to dependence and feedback the Analytic Network Process (ANP), came to revolutionize the topic. The AHP/ANP is fundamentally a way to measure crucial aspects by using pairwise comparisons with verdicts that represent the dominance of one element over another, with respect to a characteristic that they share. It is a development of laying out a structure of all the critical characteristics that influence the conclusion of a decision. (Whitaker, 2007)
The MCDM has demonstrated to have a lot of benefits when compared to other methods, such as they:
• Simplifies the evaluation of alternative scenarios, by backing up what if and sensitivity
analysis.
• It shows the relative importance of the factors • Supports group decision-making
• Allows to focus on each detailed part of the problem • Structures the decision-making process
• Includes both quantitative and qualitative factors • Delivers a truthful portrayal of the problem
Decision making has several tools that can be used in order to reach a conclusion. In this dissertation. the ANP is chosen as the main tool since it is identified a need of having feedback networks. It is necessary to establish a hierarchy and pairwise comparisons to establish relations within the structure. This way is possible to connect and interact at several levels to reach the best conclusion.
3.1.1 Analytic Hierarchy Process
In decision-making, the idea of priority is of paramount importance and how priorities are resulting can decide to result in positive or negative. They must be unique and not with several options, they must also salient the order expressed in the decisions of the pairwise comparison matrix.
17 that can be used to create measures in both the physical and social domains. It is a method to derive ratio scales from paired comparisons. (Saaty, 2001)
Introduced by Saaty in 1977 as an aid to help solve amorphous problems in economics, social, and management sciences, the AHP is a decision-making theory that has helped our understanding and approach to decision-making. The AHP turns a complicated problem into a simple hierarchy, where many quantitative and qualitative aspects are evaluated in a logical way under multiple criteria. In other words, AHP deals with MCDM difficulties that consider the distribution of goals amongst the elements that are being compared and, judges the elements that have a bigger influence on the goal (Mourão de Melo e Abreu, 2013).
The AHP is a flexible multi criterion decision making method that can be used to successfully characterise the judgments given by a team of experts to make good decisions in a complex atmosphere, where both tangible and intangible criteria must be considered. The application of the AHP to the complex problem usually involves four major steps:
1 Outline the problem and discover the kind of knowledge required.
2 Build a hierarchy, from the top with the goal of the decision, then the objectives, after the intermediate levels (criteria that the following elements depend) to the lowest level (which usually is a set of the alternatives).
3 Make a set of pairwise comparison matrices. The upper-level elements are used to compare the elements in the level immediately below with respect to it.
18 Figure 3.1 – Example of a 3 level Hierarchy
3.1.2The Fundamental Scale
To make comparisons, we need a scale of numbers that indicates how many times more important or dominant one element is over another element with respect to the criterion or property with respect to which they are compared.
The fundamental scale of values to represent the intensities of judgments is shown in Table 2.1. This scale has been derived through stimulus-response theory and validated for effectiveness, not only in many applications by many people but also through the theoretical justification of what scale one must use in the comparison of homogeneous elements.
When estimating domination while comparing, specially, when the segmentation of the comparisons is impalpable, instead of using two numbers Xi and Xj from a scale (having in mind
that their ratio is Xi/ Xj) we assign a number from 1-9 as shown in the fundamental scale of
absolute numbers, to represent the ratio (Xi/ Xj). The scale will help to reveal what the Xi and Xj
19 Table 3.1 The Fundamental Scale
Intensity of
Importance Definition Explanation
1 Equal Importance Two activities contribute equally to the objective
2 Weak or slight
3 Moderate
importance
Experience and judgment slightly favour one activity over another
4 Moderate plus
5 Strong importance Experience and judgment strongly favour one activity over another
6 Strong plus
7
Very strong or demonstrated
importance
An activity is favoured very strongly over another; its dominance demonstrated in practice
8 Very, very strong
9 Extreme importance The evidence favouring one activity over another is of the highest possible order of affirmation
1.1 – 1.9
When activities are very close a decimal is added to 1 to show
their difference as appropriate
A better alternative way to assigning the small decimals is to compare two close activities with other widely contrasting ones, favouring the larger one a little over the smaller one when using the 1 –
9 values
Reciprocal of
above
If activity i has one of the above nonzero
numbers assigned to it when compared with activity j, then j
has the reciprocal value when compared with i
A logical assumption
Measurements
from ratio
scales
When it is desired to use such numbers in physical applications. Alternatively, often one estimates the
20 In many cases there are elements that are equal or almost equal in measurement and the comparison must be made, not to know how many times one is larger than the other, but what fraction it is larger than the other. There are comparisons to be made between 1 and 2, and what we want is to guess verbally the values such as 1.1, 1.2, ... There is no problem in making the judgements by directly estimating the numbers, indeed Saaty and Vargas proposal is to continue the verbal scale to make these distinctions. Like this, 1.3 indicates moderately more, 1.5 strongly more, 1.7 very strongly more and 1.9 extremely more. This type of classification can be used in any of the intervals from 1 to 9 and for further refinements if one needs them, for example, between 1.1 and 1.2 and so on. It is important to mention that the aspect of paired comparisons is the reciprocal property. When one element is classified to be x times more important than another with respect to a given property, the lesser one is used as the unit and the larger is estimated to be some multiple of that unit. (Saaty, 2008)
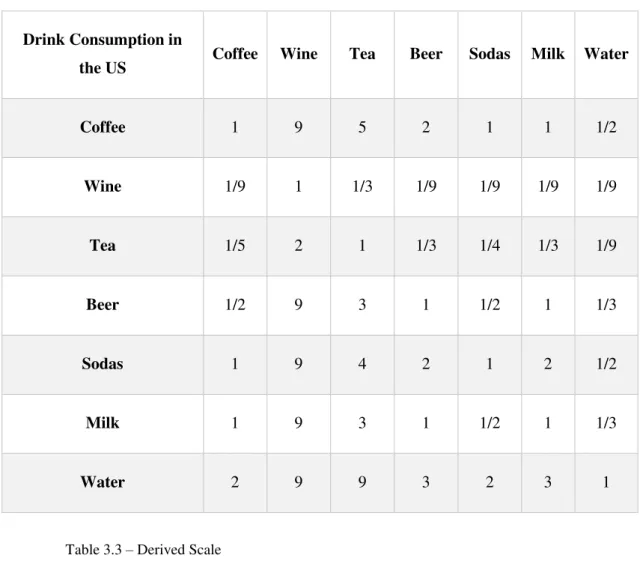
21 Table 3.2 – Consumption of Drinks in the USA
Drink Consumption in
the US Coffee Wine Tea Beer Sodas Milk Water
Coffee 1 9 5 2 1 1 1/2
Wine 1/9 1 1/3 1/9 1/9 1/9 1/9
Tea 1/5 2 1 1/3 1/4 1/3 1/9
Beer 1/2 9 3 1 1/2 1 1/3
Sodas 1 9 4 2 1 2 1/2
Milk 1 9 3 1 1/2 1 1/3
Water 2 9 9 3 2 3 1
Table 3.3 – Derived Scale
The derived scale based on the judgements in the matrix is:
Coffee Wine Tea Beer Sodas Milk Water
0.177 0.019 0.042 0.116 0.190 0.129 0.327
With a consistency ratio of 0.022. The actual consumption is:
0.180 0.010 0.040 0.120 0.180 0.140 0.330
22 To obtain a general ranking of the options, it is necessary to multiply the regularized priorities of the alternatives by the corresponding normalized priorities of the criteria and add. The same procedure is done for the criteria by using the priorities of higher level criteria. This is called the distributive method of the AHP. It is assumed, as often happens in practice that an alternative depends on the number and quality of other alternatives with which it is compared. It is also used when the criteria also depend on the alternatives as in the ANP. This method will be explained further. The ideal mode of the AHP is to require for convenience in practice that the priorities of the alternatives should not be influenced by the number or quality of other alternatives, or if the criteria are not attributes directly related to the alternative. In each criteria, it is divided the priorities of the alternatives by the largest value among them and then multiplied by the corresponding normalized priority of that criterion and add over the criteria. The same thinking is used in the ANP for each control criterion because, the control criteria are needed to make paired comparisons and are not attributes of the alternatives whose priorities depend on the alternatives directly as in the ANP or indirectly (by comparing them with respect to a higher criterion or goal influenced by any existing or ideal alternative) as in the AHP. (Saaty, Thomas L; Vargas, 2006)
3.1.3Analytical Network Process
The ANP is a general theory of comparative measurement used to originate composite priority ratio scales, from individual ratio scales, that mean comparative measurements of the influence of elements that interact with respect to control criteria. Through its super matrix whose elements are themselves matrices of column priorities, the ANP shows the consequence of dependence and response within and between clusters of elements. The AHP with its dependence assumptions on clusters and elements is a special case of the ANP. The ANP provides an overall framework to deal with choices and decisions, without having prospects about the individuality of higher level elements, from lower level elements and, about the independence of the elements within a level. In fact, the ANP uses a network without the need to specify levels as in a hierarchy. Influence is a central concept in the ANP. The ANP is a useful tool for forecast and for representing a diversity of competitors with their guessed interactions and their relative strengths to influence in making a decision (Zammori, 2010).
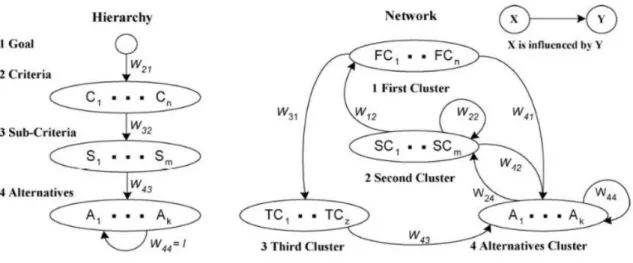
23 A network has clusters of elements. These elements in one cluster are connected to elements in another cluster (outer dependence) or the same cluster (inner dependence) (Saaty, Thomas L; Vargas, 2006). The difference between a hierarchy and a network is illustrated in Fig. 3.2:
Figure 3.2 – Hierarchy bs Network
People who labour in decision making, use typically very simple hierarchic structures consisting of a goal, criteria, and alternatives. Not only are decisions gotten from a simple hierarchy of three or four levels, different from those obtained from a multilevel hierarchy. Choices obtained from a network can be expressively different from those added from a more multifaceted hierarchy.
We can’t think that only a structure of two levels, criteria and alternatives, and expectation to capture the consequence of connections in the form of highly summarised decisions that properly reproduce all that goes on in the world. We must learn to crumble these judgments through more sumptuous structures and organize our intellectual and calculations in cultured but simple ways to serve our thoughtful of the complexity around us. Knowledge indicates that it is not hard to do this though it takes more time and effort. We must use feedback networks to reach the kind of decisions needed to handle the future (Saaty & Hall, 1999).
24 The components of the two systems are characterised as nodes, and two nodes are linked by an arrow if there is communication between them. The alignment of an arrow displays the direction of the influences between nodes. As shown in the figure, X to Y means that the elements of component X depend on component Y. Loops signify inner dependencies among nodes of the same cluster.
The strength of the dependencies is given by Wij. It is a matrix covering numerical entries of the
priorities of the strengths of influences of the ith cluster nodes on the elements of the jth cluster. The structure of a network it is determined by its clusters, its nodes or elements, and the connections between them. Clusters contain elements that segment common attributes and can be measured to be similar in some regard. (Saaty, 2008)
Connections represent the interdependency of two nodes and the arrow direction demonstrates in which directions the influences flow. Therefore, in an ANP network, two clusters are connected by an arrow when at least one element in the first cluster is connected to one or more elements in the second cluster (Zammori, 2010)
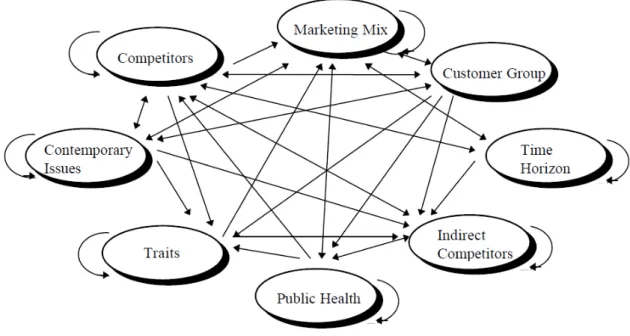
Figure 3.3 - Overall Goal: Market Share of Competitor Group
25 of the themes in the Contemporary cluster influence elements in the Marketing Mix differently. For example, using more costly materials that can be recycled, may raise prices more than the promotion of this fact to the public may bring in new business. Through this process of analysing dependencies, the prevailing understanding of the marketplace is mapped out in the ANP model of Fig. 3.3. (Saaty & Hall, 1999)
3.1.3.1 ANP Steps
According to T. L. Saaty, to mature an ANP model, we can track a set of steps. These stages may not be always followed meticulously, each decision makers can adapt to his problem. Here is the list of those steps:
1. Define the decision problem in detail counting its objectives, criteria and sub-criteria, performers and their objectives and the possible consequences of that decision. Bounce details of effects that determine how that decision may come out.
2. Define the control criteria and sub-criteria in the hierarchies according to benefits, opportunities, costs and risks of that decision and obtain their priorities from paired comparisons matrices.
3. If a control criterion or sub-criterion has a global priority of 3% or less, you may consider eliminating it from further consideration. When using a software, automatically it deals only with the criteria or sub-criteria that have subnets under them. For benefits and opportunities, it must be taken into consideration what gives the most benefits or presents the greatest opportunity to fulfil the control criterion. For costs and risks, evaluate what incurs the most cost or faces the greatest risk. Rarely the comparisons are made simply in terms of benefits, opportunities, costs, and risks in the aggregate without using control criteria and sub-criteria.
4. Draw the general network of clusters and their elements that apply to all the control criteria. In order to organize in a better way the development of the model, number and arrange the clusters and their elements in a suitable way. Use the identical label to characterise the same cluster and the same elements for all the control criteria.
5. When looking to control criterion or sub-criterion, define the clusters of the general feedback system with their elements. Attribute them according to their outer and inner dependence influences.
6. An arrow shows the influence. It is drawn from a cluster to any cluster whose elements influence it.
26 clusters and elements. The sense of being influenced or influencing, necessarily apply to all the criteria for the four control hierarchies for the entire decision.
8. In each control criterion, construct the super-matrix. Lay out the clusters by numerical numbers and all the elements in each cluster, both vertically on the left, and horizontally at the top.
9. Insert the appropriate position of the priorities that came from the paired comparisons as sub-columns of the corresponding column of the super-matrix.
10. Make paired comparisons on the elements within the clusters, according to their influence on each element in another cluster they are connected to (outer dependence), or on elements in their own cluster (inner dependence). When making comparisons, you must always have a criterion in mind. Comparisons of elements according to which element influences a given element more and how strongly more than another element it is compared with are made with a control criterion or sub-criterion of the control hierarchy in mind.
11. Perform paired comparisons on the clusters as they influence each cluster to which they are connected with respect to the given control criterion. The derived weights are used to weight the elements of the corresponding column blocks of the super-matrix. Assign a zero when there is no influence. Thus, obtain the weighted column stochastic super-matrix.
12. Compute the limit priorities of the stochastic super-matrix according to whether it is irreducible (primitive or primitive [cyclic]) or it is reducible with one being a simple or a multiple roots and whether the system is cyclic or not. Two kinds of outcomes are possible. In the first all the columns of the matrix are identical and each gives the relative priorities of the elements from which the priorities of the elements in each cluster are normalized to one. In the second the limit cycles in blocks and the different limits are summed and averaged and again normalized to one for each cluster. Although the priority vectors are entered in the super-matrix in normalized form, the limit priorities are put in idealized form because the control criteria do not depend on the alternatives. (Saaty & Hall, 1999)
3.1.3.2 Supermatrix
27 Figure 3.4 Types of Components in a Network
Generally, a network has several components and elements in these components. Indeed, creating structures to represent problems, it may be larger parts to consider that component. About the size, there is a system that is made up of a subsystem, which each subsystem made up components and each component made up of elements. It has to be considered that the whole need not be equal to the sum of its parts but may be bigger or smaller in the sense of contributing to a goal. The context would make this clear (L. Saaty & G. Vargas, 2006).
The components are shown in Figure 3.4 which no arrow enters are source components such as C1 and C2. The ones which no arrow leaves, are known as sink components such as C5 and last,
the ones that arrows both enter and exit are known as transient components like C3 and C4. Also,
C3 and C4 form a cycle of two components since they feed back and forth into each other. C2 and
C4 have loops that connect to themselves, which makes them inner dependents. All the other
connections represent dependence between components that are thus known to be outer dependent.
Aa component of a decision network is represented by Ch, h = 1, ... m, and assume that it has nh
elements, which we denote by eh1, eh2,., ehmh. The influences of a given set of elements in a
component on any element in the system are represented by a priority vector derived from paired comparisons. It is these derived vectors, how they are grouped and arranged, and then how to use the resulting structure which turns out to be a matrix, that interests us here. This matrix is thus used to represent the flow of influence from a component of elements to itself as in the loop that flows back to C4 above, or from a component from which an arrow is directed out to another
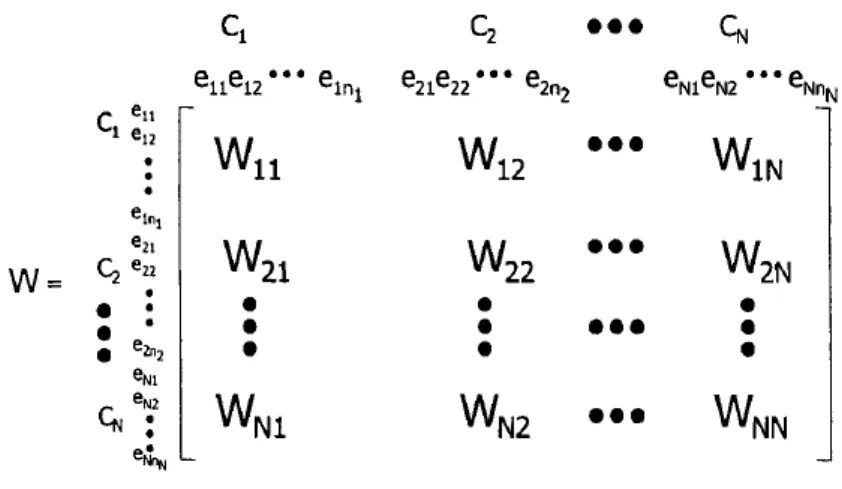
28 at the end of an arrow on the component from which the arrow begins; one must decide on one or the other. The influence of elements in the network on other elements in that network can be represented in the following supermatrix:
Figure 3.5 Supermatrix of a Network
A typical entry Wy in the supermatrix is called a block of the supermatrix. It is a matrix of the
form:
Figure 3.6 Block of the Supermatrix
Each column of Wij is a principal eigenvector of the influence (importance) of the elements in the
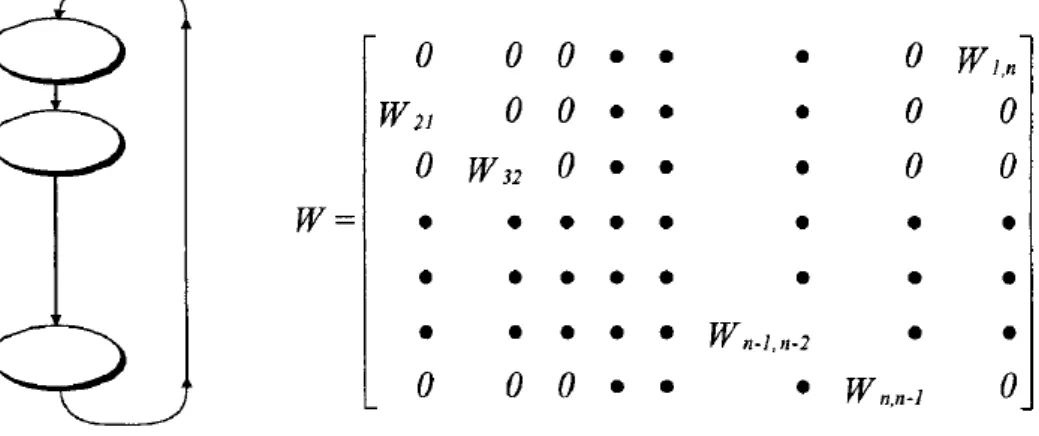
ith component of the network on an element in the jth component. Some of its entries may be zero corresponding to those elements that have no influence. Thus, we do not need to use all the elements in a component when we make the paired comparisons to derive the eigenvector, but only those that have a non-zero influence. Figures 3.5 and 3.6 and their super matrices represent a hierarchy and a holarchy of m levels. As with any super matrix, an entry in each of the foregoing two super matrices is a block Wij positioned where the ith component or level is connected to and
29 show that each element depends only on itself. It is a necessary aspect of a hierarchy (or any sink) when viewed within the context of the supermatrix. The entry in the first row and last column of a holarchy is nonzero because the top level depends on the bottom level.
Figure 3.7 Structure and Supermatrix of a Hierarchy
Figure 3.8 Structure and Supermatrix of a Holarchy
A network may be generated from a hierarchy by increasing the hierarchy's connections gradually so that pairs of components are connected as desired and some components have an inner dependence loop. (Saaty, Thomas L; Vargas, 2006)
3.1.4AHP vs ANP
AHP and ANP have been used separately or in conjunction in many areas, such as industry, personal decision making, management, political, government, social, manufacturing, education, sports, military, tourism, service, etc.. The pairwise comparison is done using the same fundamental comparison scale.
30 One of the drawbacks related to the AHP is the fact that it does not consider the interdependencies amongst elements. Thus, ANP has been used to overcome this drawback, it is a holistic approach in which all attributes and alternatives included, are connected in a network system that considers/includes the interdependencies. It also provides a non-linear analysis of strategies among the decision attributes. However, the ANP is not as intuitive as the AHP, the judgments to be made in a network system are also a much bigger of a problem in terms of complexity. (Saaty & Hall, 1999)
The ANP is a comprehensive decision-making technique that has the capability to include all the relevant criteria, which have some attitude when reaching a decision. AHP serves as the starting point of ANP. Generally speaking, the ANP is more accurate and gives better results than the AHP. (Zammori, 2010) Furthermore, the ANP provides a general framework to deal with decisions without making assumptions about the independence of higher level elements from lower level elements, in other words, ANP makes conceivable to deal with all kinds of dependence and feedback in a decision system. Consequently, anytime there are dependencies between criteria and/or alternatives, if one tries to model the problem as a linear hierarchy, the risk of getting an inconsistent result is considerably high.
Turning a hierarchy in a network (in order to capture the most number of possible influences between factors), significantly increases the complexity of the model. An example is provided by Saaty in this work (T. L. Saaty, 1999), where a hierarchy is converted into a network and it is shown that the number of judgments increases from 79 to 624. Another disadvantage of the ANP is that the comprehension of a network is not as intuitive as that of a linear hierarchy. In other words, when the problem is structured in a hierarchy of decision criteria the flow of influence is clear, as it proceeds outright from the top level (i.e. the goal of the problem) to the bottom level (i.e. the alternatives) moving through a series of intermediate levels, which represent the sub-criteria in which the goal is decomposed. The same is not true for a network, for in this case there is not an origin and neither an end and the relative influences between clusters and/or node are confounded and less detectable. Thus, making pairwise comparisons becomes more difficult and requires a deeper understanding of how the network has been built. As a consequence, whether the AHP permits one to develop the model before presenting it to a panel of experts (to gather the necessary judgments and for validation purposes), in the case of the ANP these two steps (i.e. building and validation) cannot be easily detached, and it is advisable to involve the experts from the very beginning of the development of the network (Zammori, 2009).
31 decision. It was believed that rank reversal is legitimate only when criteria or priorities of criteria or changes in judgments are made. The second concern is about inconsistent and their effect on aggregating such judgments or on deriving priorities from them. The third criticism has to do with attempts to preserve rank from irrelevant alternatives by combining the comparison judgments of a single individual using the geometric mean (logarithmic least squares) to derive priorities and also combining the derived priorities on different criteria by using multiplicative weighting synthesis. The fourth criticism has to do which people trying to change the fundamental scale despite the fact that it is theoretically derived and tested by comparing it with numerous other scales on a multiplicity of examples for which the answer was known. The fifth and final criticism has to do with whether or not the pairwise comparisons axioms are behavioural and spontaneous in nature to provide judgments.