REM WORKING PAPER SERIES
Labour Productivity, Wages and the Functional Distribution
of Income in Portugal: A Sectoral Approach
João Carlos Lopes, José Carlos Coelho and Vítor Escária
REM Working Paper 091-2019
September 2019
REM – Research in Economics and Mathematics
Rua Miguel Lúpi 20,1249-078 Lisboa, Portugal
ISSN 2184-108X
Any opinions expressed are those of the authors and not those of REM. Short, up to two paragraphs can be cited provided that full credit is given to the authors.
1
Labour Productivity, Wages and the Functional Distribution
of Income in Portugal: A Sectoral Approach
João Carlos Lopes
a, José Carlos Coelho
band Vítor Escária
ba ISEG – School of Economics and Management, Universidade de Lisboa; REM – Research in Economics and Mathematics, UECE. UECE – Research Unit on Complexity and Economics. email: jcflopes@iseg.ulisboa.pt
b ISEG – School of Economics and Management, Universidade de Lisboa; UECE – Research Unit on Complexity and Economics.
Draft Version: September 2019
Abstract: The main purpose of this paper is to study the functional distribution of income
in Portugal in the long run, considering the period between 1953 and 2017. The labour share in income or value added depends on two fundamental variables, the labour productivity and the average labour compensation. The trends of these variables are quantified, for the aggregate economy and for its main productive sectors. An interesting result emerges, namely the different dynamics across sectors, both for the (unadjusted) wage share (considering only the wages of employees) and for the adjusted labour share (considering also as labour compensation one fraction of mixed income). Moreover, a shift-share analysis is used, in order to distinguish the importance of each sector’s wage share evolution (“within” effect) and the changes in each sector’s weight (structural changes, or “between” effect). Finally, a first attempt to incorporate the effect of wage inequality on the functional distribution of income is made, subtracting the labour compensation of the highest paid workers (top 10%, 5% and 1%) in order to calculate the wage share of the (so-called) typical workers.
Keywords: Functional Income Distribution; Labour Share; Sectoral Analysis;
Shift-Share Analysis; Wage Inequalities; Portugal.
JEL-Classification: D33; E25
Acknowledgment: The financial support of Fundação para a Ciência e a Tecnologia
(FCT), Portugal, within the context of the project PRIDE: “Portugal: Integração Regional da Demografia e da Economia” (PTDC/ATP-DEM/0441/2014), is greatly acknowledged.
2 1. Introduction
The functional distribution of income is an important economic, social and political topic. Nicholas Kaldor, in a seminal paper published in 1957, considers that the share of wages and the share of profits in the national income has shown a remarkable constancy in developed capitalist economies (Kaldor, 1957). Previously, J. M. Keynes has written “…the stability of the proportion of the national dividend accruing to labour […] is one of the most surprising, yet best-established, facts in the whole range of economic statistics [….] Indeed, […] the result remains a bit of a miracle.” (Keynes, 1939, p. 48/49). However, Solow (1958) has about this empirical regularity a sceptical position, saying that the stability of labour’s share may be an optical illusion.
Since then, (at least) mainstream economics authors gave little attention to this interesting theme, considering it irrelevant and ignoring it in most economics manuals or even seeing it as uncomfortable, as if studying distribution dynamics was a revival of class struggle concerns. For instance, Blaug (1996, p. 467) sustains that “the great mystery of the modern theory of distribution is why anyone regards the share of wages and profit as an interesting problem”. Lucas (2004, last paragraph) goes even further, saying that ‘Of the tendencies that are harmful to sound economics, the most seductive, and in my opinion the most poisonous, is to focus on questions of distribution...”, and Feldstein considers that studies of income distribution are motivated by envy (cited from Milanovic (2013, first paragraph) “Before the global crisis, income inequality was relegated to the underworld of economics. The motives of those who studied it were impugned. According to Martin Feldstein, the former head of Reagan’s Council of Economic Advisors, such people have been motivated by envy”.
In fact, in a setting of perfect competitive markets, with factors remunerated according to their marginal productivity, labour and capital shares are constant by assumption, as in the neoclassical growth models of Solow (1956) and Swan (1956). So, the labour share has been considered stable overtime by most researchers, and, at least until the 1980s, this was considered one of the (Kaldor’s) stylized facts of economic growth.
Nevertheless, two or three decades of globalization and neoliberalism has changed it all, and from the early 1980s until today the labour share has been decreasing, at least in developed economies. This trend is nowadays consensually recognized by the most
3
important international organizations (see, for example, European Commission, 2007; ILO and OECD, 2015; IMF, 2017; OECD, 2018) and has recently attracted great attention from researchers and policy makers. The decrease of the labour share has been quantified by many empirical researchers for many countries and its negative consequences have been highlighted (Atkinson, 2009; Piketty, 2013).
There is still however some inertia on the study of this topic by mainstream economists. For example, in an interesting study of new growth facts (a la Kaldor), Jones and Romer (2009) recognize the trend of a decreasing labour share, but do not ascribe it the status of "a new stylized fact of growth". But for Atkinson (2009), this is the main issue that political economy must address, for at least three reasons: to make a link between incomes at the macroeconomic level (national accounts) and incomes at the level of the household; to help to understand the inequality in the personal distribution of income; and to address the concern of social justice with the fairness of different sources of income.
Conceptually, the functional distribution of income is the division of national income between labour and capital. The labour share is the part of national income attributed as labour compensation, whereas the capital share is the part of national income allocated to capital. A decrease of the labour share results from a low growth of average labour compensation relative to the growth of labour productivity and therefore an increase return of capital against labour and it is a source of increasing inequalities, if capital gains are concentrated at the upper end of the income distribution (Ponattu et al., 2018).
There are many reasons explaining this decreasing path of the labour share. From the point of view of mainstream economists, technical progress, globalization and the change in market structures (concentration) contribute for the explanation of the phenomenon (Cette et al, 2019). In this line of reasoning, Karabarbounis and Neiman (2014) underline the decrease in the price of capital goods coupled with an elasticity of labour replacement for capital above one. Autor and Salomons (2018) highlight the importance of communication and information technologies, robotization and automation. In the context of the globalization on course, offshoring and global value chains assume an important role (Elsby et al., 2013). The tendency for concentration in market structures is due to the emergence of hyper-productive firms, originating a “winner-take most” dynamics, as referred by Autor et al. (2017). And Gutiérrez and Philippon (2019) and Philippon (2019) attribute some of the decline in the US labour share to a declining competition. Two other
4
explanations, highlighted in a recent report about this issue (McKinsey Global Institute, 2019), are boom and bust cycles (rapidly rising prices of commodities, real estate and construction) and higher depreciation of intangible capital (namely, intellectual property products).
On the other hand, alternative schools of thought, namely the (so-called) heterodox economists, sociologists, and political scientists, have identified other reasons for the decrease of the labour share such as the decrease of union power (Stockhammer, 2009), financialization (Epstein, 2005; Hein, 2015; Guschanski and Onaran, 2018), and the decreasing weight of the public sector, with the neoliberal program of privatizations, deregulation and welfare state retrenchment (Dünhaupt, 2013).
The evolution of the labour share in Portugal has not been much studied, and one of the few references in the literature is the paper from Barradas and Lagoa (2017). These authors study the relationship between the labour share and the financialisation and other related determinants for Portugal between 1978 and 2012. They conclude by means of an ARDL model that the financialisation has an indirect long-term effect on the labour share through its impact on government activity and trade union density.
As far as we know, at the sectoral level there are no studies of the Portuguese case. The present paper aims to overcome this literature gap, which is an interesting exercise in itself, as the dynamics of labour productivity and average wages are very different across sectors.
The rest of the paper is organized as follows. First, the evolution of the wage share and the adjusted labour share in Portugal are quantified and analysed for a long time-horizon of several decades (since 1953 until 2017), both for the whole economy and for five big sectors. Next, for a more recent period (1995-2017) a detailed sectoral analysis (14 sectors) is made, showing the trends of the wage share, labour productivity and average wages. Thirdly, a shift-share analysis is used to explain the wage share’s evolution by a within effect and a between (structural change) effect. And fourthly, the wage share of the so-called typical workers is constructed, subtracting the remunerations of the highest paid workers. Finally, the paper ends with the main conclusions and some limitations of this study.
5 2. Empirical analysis of the Portuguese case
In this paper two definitions are used to measure the share of national income allocated to labour. The first one is the wage share, the weight of wages in gross value added (GVA), including in wages all the income compensation of employees, including payroll taxes paid by employers. The second one is the adjusted labour share, obtained by adding to the compensation of employees one parcel of the income received by the self-employed workers (the so-called mixed income). There are several methods to calculate this parcel. The first method, and the simpler one, consists in attributing two-thirds of the mixed income to labour and one third to capital (Johnston, 1956). The second one, which is used in this paper, assumes that the self-employed have the same average wage as the employees, and its labour compensation is calculated by multiplying this (common) average wage by the total number of self-employed workers. This method can be sophisticated, considering the average earnings of the self-employed equal to those of employees with similar sectoral and personal characteristics (education levels, age, gender, etc.). For more details on this, see Guerriero (2012).
2.1 The wage share and the adjusted labour share in Portugal: a long run perspective
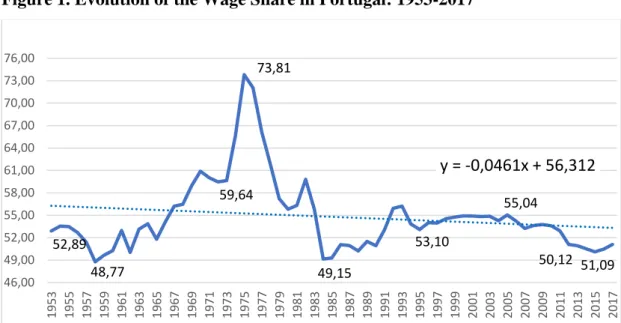
The evolution of the wage share in Portugal since the 1950s until today has shown an irregular pattern of ups and downs, but it is very interesting to notice that the start and end values of the series are almost equal, around 52% (see Figure 1). It is as if Kaldor is right and the Keynesian “bit of a miracle” prevails in the long run trajectory of Portuguese functional income distribution.
However, after some slight variations around 52% in the first decade or so the wage share in Portugal started a pronounced upward trend in the mid-1960s and attained its highest value in 1975 (73.8%). This trend can be attributed to some peculiarities of the Portuguese case, namely the social and political context of the country rather than purely economic reasons: strong emigration flow during the sixties and the first years of the 1970s, and the
6
end of the dictatorship (Estado Novo) with the 25 of April Revolution and its subsequent political upheaval and left turnover (1974/1975).
Figure 1. Evolution of the Wage Share in Portugal: 1953-2017
Source: Séries Longas - Banco de Portugal (1953-1994); Contas Nacionais – INE (1995-2017)
With the so-called “normalization” of the political situation (in 1976), and mainly with the austerity associated with the two balance of payment crises and IMF interventions (1977/79 and 1983/85), the wage share reverts the previous strong upward trend and, in less than a decade, returns to values below its average norm (49.2% in 1984, its lowest value in democracy).
The first years of membership of the European Union (then European Economic Community, EEC) coincide with a slight increase of the wage share in Portugal, which were followed by a decade of relative stabilization around 55%. Since the mid-2000s, the wage share starts a slightly decreasing trend, reinforced in the recent past, with the Eurozone crisis of 2011/2013, returning to a value close to the minimum of 1984, 50%. The last two years of the series, 2016 and 2017 seem to point to a recover of the wage share of income, but it is premature to say if this reversal is sustainable or not. All in all, it is fair to say that the distribution of income between capital and labour, at least in mid-developed countries with social and political instability, although certainly determined by economic reasons, can only be understand with a more general, holistic and multidisciplinary approach. 52,89 48,77 59,64 73,81 49,15 53,10 55,04 50,12 51,09 y = -0,0461x + 56,312 46,00 49,00 52,00 55,00 58,00 61,00 64,00 67,00 70,00 73,00 76,00 1953 1955 1957 1959 1961 1963 1965 1967 1969 1971 1973 1975 1977 1979 1981 1983 1985 1987 1989 1991 1993 1995 1997 1999 2001 2003 2005 2007 2009 2011 2013 2015 2017
7
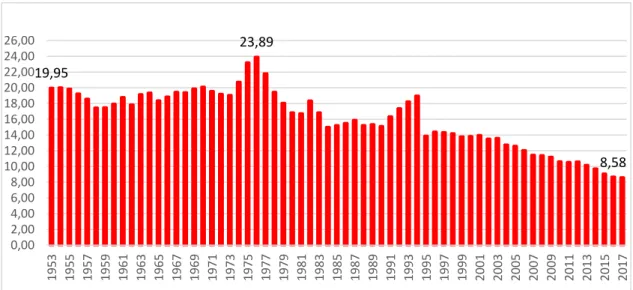
The evolution of the adjusted labour share in Portugal is similar to the evolution of the (unadjusted) wage share, as in the short run there is no significant variation in the share of self-employment on the labour input (see Figure 2). However, it is worth noting that the first series become closer to the second one, due to the decreasing trend of self-employed workers’ compensation in the long run, particularly since the mid-1990s, from around 20% to below 10% of GDP at factor prices (see Figure 3).
Figure 2. Evolution of the adjusted labour share (LSaj) in Portugal: 1953-2017
Source: Séries Longas - Banco de Portugal (1953-1994); Contas Nacionais – INE (1995-2017)
Figure 3. Difference between the adjusted labour share and the wage share in Portugal: 1953-2017
Source: Séries Longas - Banco de Portugal (1953-1994); Contas Nacionais – INE (1995-2017) 52,89 73,81 51,09 72,85 96,99 59,66 47,00 51,00 55,00 59,00 63,00 67,00 71,00 75,00 79,00 83,00 87,00 91,00 95,00 99,00 1953 1955 1957 1959 1961 1963 1965 1967 1969 1971 1973 1975 1977 1979 1981 1983 1985 1987 1989 1991 1993 1995 1997 1999 2001 2003 2005 2007 2009 2011 2013 2015 2017 WS LSaj Linear (WS) Linear (LSaj) 19,95 23,89 8,58 0,00 2,00 4,00 6,00 8,00 10,00 12,00 14,00 16,00 18,00 20,00 22,00 24,00 26,00 1953 1955 1957 1959 1961 1963 1965 1967 1969 1971 1973 1975 1977 1979 1981 1983 1985 1987 1989 1991 1993 1995 1997 1999 2001 2003 2005 2007 2009 2011 2013 2015 2017
8
2.2 The wage share in 5 big sectors: 1977-2016
The income distribution is significantly different across sectors. In this section, we analyse the evolution of the wage share in five big sectors, namely manufacturing and energy, public services, private services, agriculture and construction, comparing it with the evolution for the whole economy.
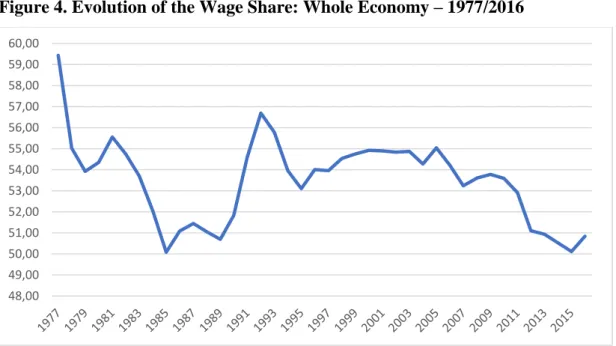
For the economy as a whole, as we have already pointed out, the wage share declines until the mid-1980s (around ten percentage points, from 60% to 50%), recovers in the second half of the 1980s (to 55/56%), keeps relatively constant in the following decade, and declines once again in the last decade of this period, particularly since the start of the Euro crisis in 2010/2011, reaching its minimum value in 2015, 50%, the same of 1985, 20 years before (see Figure 4).
Figure 4. Evolution of the Wage Share: Whole Economy – 1977/2016
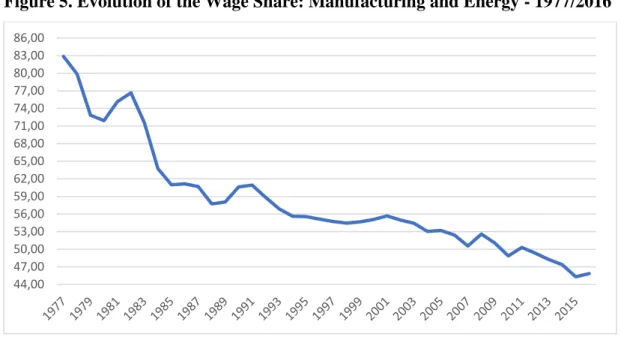
Source of Figures 4 to 9: OECD – STAN database
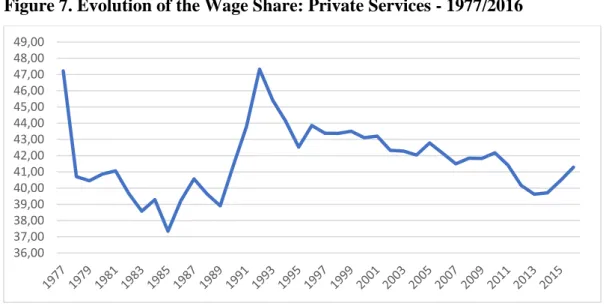
In the case of Manufacturing and Energy (see Figure 5), the profile is of a strong decline in the wage share, from 83% in 1977 until 47% in 2016, with some minor and brief recoveries, insufficient to invert the main trend. A similar profile occurs in the case of Public Services (see Figure 6), although with a smaller overall decline over this period, from 91% to 77%. On the other hand, the trend in Private Services is similar to that of the
48,00 49,00 50,00 51,00 52,00 53,00 54,00 55,00 56,00 57,00 58,00 59,00 60,00
9
whole economy, but with a smaller amplitude of variation, in the interval 47%/37% (see Figure 7).
Figure 5. Evolution of the Wage Share: Manufacturing and Energy - 1977/2016
Figure 6. Evolution of the Wage Share: Public Services - 1977/2016
The evolution of the wage share in Agriculture shows a peculiar pattern of an U, starting with a value of 28%, attaining a minimum of 16% in 1997, and recovering thereafter until an almost double value in 2016, above 30% (see Figure 8). Finally, the wage share in Construction followed a quite irregular patter of ups and downs, starting with values around 65%/70% in the first 5 years, declining strongly in the following decade, until 52% in 1995, and recovering until the beginning of the sovereign debt crisis (66% in 2010). In the crisis years (2011, 2012 and 2013), the wage share decreased 4 percentage points, after which a new recovery emerges (see Figure 9).
44,00 47,00 50,00 53,00 56,00 59,00 62,00 65,00 68,00 71,00 74,00 77,00 80,00 83,00 86,00 76,00 77,00 78,00 79,00 80,00 81,00 82,00 83,00 84,00 85,00 86,00 87,00 88,00 89,00 90,00 91,00 92,00
10 Figure 7. Evolution of the Wage Share: Private Services - 1977/2016
Figure 8. Evolution of the Wage Share: Agriculture - 1977/2016
Figure 9. Evolution of the Wage Share: Construction - 1977/2016 36,00 37,00 38,00 39,00 40,00 41,00 42,00 43,00 44,00 45,00 46,00 47,00 48,00 49,00 15,00 16,00 17,00 18,00 19,00 20,00 21,00 22,00 23,00 24,00 25,00 26,00 27,00 28,00 29,00 30,00 31,00 50,00 52,00 54,00 56,00 58,00 60,00 62,00 64,00 66,00 68,00 70,00 72,00 74,00
11
2.3 A Shift-Share analysis of the changes in the Wage Share
In this section, a shift-share analysis is carried out, in order to distinguish and quantify the so-called “intra-sectorial” or “within” effect (change in the wage share of the economy due to the evolution of each sector’s wage share), from the “inter-sectoral” or “between” effect (also called structural change effect, as it measures the influence of changes in the relative weight of each sector in gross value added). This second effect is negative if labour moves from sectors with high wage share to sectors with low wage share, and positive in the opposite case.
The determination of the variation of the wage share in the economy, from year 0 to year
T is decomposed as follows: 𝑊𝑆𝑇− 𝑊𝑆0 = ∑ 𝑠ℎ̅̅̅̅𝑖 𝑛 𝑖=1 (𝑊𝑆𝑖,𝑇 − 𝑊𝑆𝑖,0) + ∑ 𝑊𝑆̅̅̅̅̅𝑖 𝑛 𝑖=1 (𝑠ℎ𝑖,𝑇− 𝑠ℎ𝑖,0) where:
• 𝑊𝑆𝑡: wage share of total economy in year t (t = 0,…,T) • 𝑊𝑆𝑖,𝑡: wage share of sector i in year t
• 𝑠ℎ𝑖,𝑡: share of GVA of sector i in total GVA in year t
• 𝑠ℎ̅̅̅̅: average share of GVA of sector i in total GVA between 0 and T 𝑖 • 𝑊𝑆̅̅̅̅̅: average wage share of sector i between 0 and T 𝑖
The two effects described above are:
∑𝑛𝑖=1𝑠ℎ̅̅̅̅𝑖(𝑊𝑆𝑖,𝑇− 𝑊𝑆𝑖,0) – the within effect ∑𝑛𝑖=1𝑊𝑆̅̅̅̅̅𝑖(𝑠ℎ𝑖,𝑇− 𝑠ℎ𝑖,0) – the between effect
This shift-share exercise was performed for 38 sectors of the Portuguese economy, in the period 1995-2016. The results (within effect, between effect and total effect) for each sector and for the whole economy, as well as the relative weight of the total effect of each sector in aggregate total effect, are presented in Table 1.
12 Table 1: Shift-share analysis of changes in the wage share: 1995-2016, 38 sectors
Source: INE - Estatísticas dos Ramos de Atividade and authors’ calculations
The main result worth mention is that between 1995 and 2016 the wage share in Portugal declined 2.65 p.p. and that the dominant force was clearly the within effect, -1,83 p.p. or 69% of the total decline. Therefore, we can conclude that the decrease of the wage share in Portugal is mostly explained by decreases of sectoral wage shares and less by changes in sectoral relative weights on gross value added.
It is also interesting to note that the sectors most responsible for the declining wage share are Textiles, Education, Construction, Finance and Public Administration. On the other hand, the sectors less responsible for this negative trend are Electronic Equipment, Electricity and Gas, Other Manufacturing, Mining and Pharmaceutical Products.
13
2.4 – The evolution of productivity and wages in Portugal: a sectoral analysis
The evolution of the wage share results from the combined profile of two important variables, labour productivity and average labour compensation. In fact, when labour productivity increases more rapidly than average wage, the wage share declines, and vice-versa.
In Panel 1, the trends of these variables are shown, for the whole economy, in the period 1995-2015, in 3 related figures: in the up-right figure, the evolution of the wage share (and adjusted labour share); in the up-left figure, the evolution of labour productivity (gross value added per worker) and average labour compensation (wages divided by the number of workers); and in the centre-down figure, the growth rates of these two last variables in several periods (1995-2000; 2000-2005; 2005-2010; 2010-2015; 1995-2015).
Panel 1. Evolution of Wage Share, Labour Productivity and Average Labour Compensation: Portuguese economy - 1995/2015
Source: EU-KLEMS database and author’s calculations
As it was already shown, the wage share and the adjusted labour share in Portugal decline in the overall period, but experiencing changes in the time profile in-between. In the last five years of the 1990s, the average labour compensation grows above labour productivity, and so the labour share (adjusted and unadjusted) grows, although slightly. Since 2000, however, the opposite occurs, with significant strength in the last decade,
14
with labour losing to capital in the functional distribution of income. It is worth mentioning that in the last five years of the period (2010-2015) there is even a real decay of average wages, a well-known consequence of the sovereign debt crisis in Portugal. Labour productivity growth in this sub-period slows down as well but kept always being positive.
As it was also shown, there are significant differences in the evolution of these variables across sectors. The purpose of the following panels is to illustrate these differences, for the case of 5 big sectors (Manufacturing; Public Services; Trade; Real Estate and Business Services). For economy of space, the results for the other sectors are omitted here, but are available under request.
In the case of Manufacturing (see Panel 2), labour productivity grows always more than average wages, and so the labour share declines continually. The biggest difference in the growth rate of these variables (1,5 p.p.) is in sub-period 2005-2010.
Panel 2. Evolution of Wage Share, Labour Productivity and Average Labour Compensation: Manufacturing - 1995/2015
Source: EU-KLEMS database and author’s calculations
In Public Services, the wage share declines since 1998 almost all the years until 2015 (the only exceptions are 2009 and 2013). A peculiarity of this sector is that both labour
15
productivity and average labour compensation have negative growth rates in all the sub periods (see Panel 3.)
Panel 3. Evolution of Wage Share, Labour Productivity and Average Labour Compensation: Public Services - 1995/2015
Source: EU-KLEMS database and author’s calculations
Trade has an interesting time profile, with the wage share increasing until the start of the global financial crisis (2008) and declining thereafter. But the subperiods are very different from one another, with strong growth rates of labour productivity and average wages in 1995-2000, negative rates in 2000-2005, and recoveries in the following subperiods, particularly in the case of productivity (see Panel 4).
Real Estate has a peculiar functional distribution of income, highly concentrated in capital returns. Nonetheless, the wage share starts growing slightly, from 5% in 1995 to 7% in 2000, but declines strongly in the next 15 years, ending with low values around 3,5% in the final years (see Panel 5). Moreover, it is worth noting the strong decline of labour productivity in the first quinquennial, and the negative growth rates of average wages in the following subperiods.
16 Panel 4. Evolution of Wage Share, Labour Productivity and Average Labour Compensation: Trade - 1995/2015
Source: EU-KLEMS database and author’s calculations
Panel 5. Evolution of Wage Share, Labour Productivity and Average Labour Compensation: Real Estate - 1995/2015
17
Finally, in the Business Services sector, the wage share has a remarkable constancy around 80%, with strong decreases both of productivity and wages in the first subperiods, slight decreases in 2005-2010, and positive rates in 2010-2015, mainly in wages (see Panel 6).
Panel 6. Evolution of Wage Share, Labour Productivity and Average Labour Compensation: Business Services - 1995/2015
Source: EU-KLEMS database and author’s calculations
2.5 Wage inequalities and the wage share of “typical” workers
In the last years, the wage gap between senior managers and other employees has increased, bringing to the forefront the issue of wage and income inequalities. Moreover, there is the question to know if CEOs should be treated as employees and their remunerations included in labour compensation or in capital gains (e.g., stock options should not be considered labour income, but capital income).
In this section, an attempt is made to measure this effect over the functional distribution of income. In order to do so, a new indicator is used, the wage share of the so-called “typical” workers, which excludes from labour compensation the wages of the highest paid workers (the top 10%, 5% and 1%).
18
The data necessary to calculate this indicator is taken from Quadros de Pessoal (QP), a detailed micro database of wages covering over three million workers and three hundred thousand firms each year. The methodology consists in the following steps: 1 - identify the 90th, 95th and 99th percentiles of the monthly basis remuneration and determine the monthly basis remuneration of the top 10%, 5% and 1% employees; 2 – annualize this basis remuneration (14 months); 3 – obtain employers' social contributions (23,75% of basis remuneration); 4 - annualize irregular remuneration of the 10%, 5% and 1% above (12 months); 5 - correct by the ratio between the number of total workers (INE) and the number of employees (QP); 6 – obtain the total remuneration of the top 10%, 5% and 1% workers; 7 - calculate the adjusted wage share of the bottom 90%, 95% and 99%, by the difference between total labour compensation (INE) and of the wages of the top 10%, 5% and 1% wage workers.
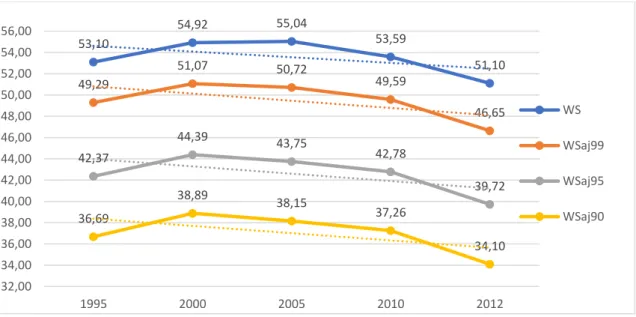
This methodology was applied for every five years since 1995, and the last year with availability of data was 2012. The wage share for the whole economy and the adjusted wage share of the bottom 90%, 95% and 99% workers (the so-called typical workers) grow up between 1995 and 2000, reaching the maximum value in that year, and thereafter, until 2012 (see Figure 10).
Figure 10. WS and Adjusted Wage Share of bottom 90%, 95% and 99% workers
Source: INE, Quadros de Pessoal and authors’ calculations
53,10 54,92 55,04 53,59 51,10 49,29 51,07 50,72 49,59 46,65 42,37 44,39 43,75 42,78 39,72 36,69 38,89 38,15 37,26 34,10 32,00 34,00 36,00 38,00 40,00 42,00 44,00 46,00 48,00 50,00 52,00 54,00 56,00 1995 2000 2005 2010 2012 WS WSaj99 WSaj95 WSaj90
19
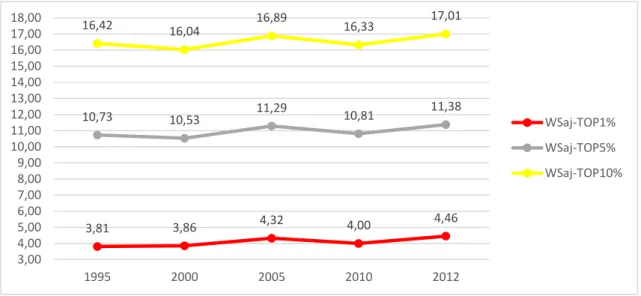
The evolution of the adjusted wage shares of the top 10%, 5% and 1% workers show a more irregular pattern, but there is an, although slight, increasing trend in the three cases, pointing to some reinforcement of wage inequalities in Portugal (see Figure 11).
Figure 11. Adjusted Wage Share of top 10%, 5% and 1% workers
Source: INE, Quadros de Pessoal and authors’ calculations
3. Conclusions
In most developed countries, the labour share has grown between the 1950s and the 1970s. Since the 1980s, and especially since the beginning of the millennium, the labour share declines, contributing to increasing income inequality. There are several explanatory reasons for this trend, namely technical progress, globalization and change in market structures (concentration), with hyper-productive firms, weakening trade unions, financialization of the economy and the decrease in the weight of public sector, among others.
In Portugal, the wage share has grown since the second half of the 1960s, achieving a maximum value in 1975. This trend is explained by some peculiarities of the country, namely the social and political context, rather than purely economic reasons, e.g. dictatorship, emigration and the 25 of April Revolution of 1974. In the following decade (1976-1985) the increasing trend was reverted, and the wage share returns to the value of
3,81 3,86 4,32 4,00 4,46 10,73 10,53 11,29 10,81 11,38 16,42 16,04 16,89 16,33 17,01 3,00 4,00 5,00 6,00 7,00 8,00 9,00 10,00 11,00 12,00 13,00 14,00 15,00 16,00 17,00 18,00 1995 2000 2005 2010 2012 WSaj-TOP1% WSaj-TOP5% WSaj-TOP10%
20
the mid-1960s. After a short period with a new, albeit slight, increase, the labour share stabilizes for another decade or so, and since the mid-2000s declines again, particularly during the Eurozone crisis (2011-2015).
From a sectoral point of view, in Portugal, between 1977 and 2016, there are different evolution profiles. For example, in manufacturing and energy and public services the labour share decreases since the beginning of the 2000s. In other sectors, this decrease only occurs after the Great Recession of 2008/2009.
The shift-share analysis allows to conclude that dominant effects explaining the decline of the wage share, between 1995 and 2016, is the “within” effect (69%) and not the “between” effect (31%). Therefore, most of the decline is due to the evolution of sectoral wage shares and few to changes in sectoral value-added shares.
Regarding the wage inequality issue, the adjusted wage share of the so-called typical workers (the bottom 90%, 95% and 99% of the wage distribution) grows up between 1995 and 2000 and declines thereafter. The adjusted wage shares of the highly paid workers (the top 10%, 5% and 1%) exhibit a more irregular behaviour, but on average show a sustained increasing trend between 1995 and 2012, pointing to some increase in wage inequalities in Portugal, but perhaps more slight than in other developed countries.
This paper provides a good descriptive analysis of the functional income distribution in Portugal, with a large time span and great sectoral detail. However, there are several improvements to make, namely a more careful treatment of mixed income in sectors where this category is relevant (agriculture, construction, some private services) and the explicit account of capital depreciation, as well as the assessment of the main forces explaining the division of income between capital and labour.
21 References
Atkinson, A. (2009), “Factor shares: the principal problem of political economy?”,
Oxford Review of Economic Policy, Vol. 25, No. 1, pp. 3-16.
Autor, D. and A. Salomons (2018), “Is Automation Labor-Displacing? Productivity Growth, Employment, and the Labor Share”, National Bureau of Economic Research, NBER Working Paper 24871, July.
Autor, D., D. Dorn, L. F. Katz, C. Patterson and J. V. Reenen (2017), “The Fall of the Labor Share and the Rise of Superstar Firms”, National Bureau of Economic Research, NBER Working Paper 23396, May.
Barradas, R. and S. Lagoa (2017), “Functional Income Distribution in Portugal: The Role of Financialisation and Other Related Determinants”, Society and Economy, Vol. 39, No. 2, pp. 183-212.
Blaug, M. (1996), Economic Theory in Retrospect, 3rd edition, Cambridge University Press, Cambridge.
Cette, G.; L. Koehl and T. Philippon (2019), LABOR SHARES IN SOME ADVANCED ECONOMIES, Working Paper 26136, NBER WORKING PAPER SERIES.
Dünhaupt, P. (2013), “Determinants of functional income distribution: Theory and empirical evidence”, Global Labour University, Working Paper No. 18, November.
Elsby, M. W. L., B. Hobijn, and Aysegül Şahin (2013), “The Decline of the U.S. Labor Share”, Brookings Papers on Economic Activity, Brookings Institution Press, pp. 1-52.
Epstein, G. A. (2005), “Financialization and the World Economy”, Edward Elgar Publishing Limited, Cheltenham, UK.
European Commission (EC) (2007), The labour income share in the European Union, in Employment in Europe 2007, Directorate-General for Employment, Social Affairs and Equal Opportunities (Brussels), pp. 237–72.
22
Guerriero, M. (2012), “The Labour Share of Income around the World. Evidence from a Panel Dataset”, IDPM, Development Economics and Public Policy Working Paper Series WP No.32/2012.
Guschanski, A. and Ö. Onaran (2018), “The labour share and financialisation: Evidence from publicly listed firms”, Greenwich Political Economy Research Centre, GPERC59.
Gutiérrez, G. and T. Philippon ,(2019) “How EU Markets Became More Competitive Than US Markets: A Study of Institutional Drift”, NBER working paper.
Hein, E. (2015), “Finance-dominated capitalism and re-distribution of income: a Kaleckian perspective”, Cambridge Journal of Economics, Vol. 39, No. 3, pp. 907-934.
International Labour Organization (ILO) and Organisation for Economic Co-operation and Development (OECD) (2015), The Labour Share in G20 Economies, Report prepared for the G20 Employment Working Group, Antalya, Turkey, 26-27 February.
International Monetary Fund (IMF) (2017), Understanding the downward trend in labor income shares, in World Economic Outlook: Gaining Momentum?, April.
Jones, C. and P. Romer (2009), “The New Kaldor Facts: Ideas, Institutions, Population, and Human Capital”, National Bureau of Economic Research, NBER Working Paper 15094, June.
Kaldor, N. (1957), “A Model of Economic Growth”, The Economic Journal, December.
Karabarbounis, L. and B. Neiman (2014), “The Global Decline of the Labor Share”,
Quarterly Journal of Economics, Vol. 129, No. 1, pp. 61–103.
Keynes, J. M. (1939), “Relative Movements of Real Wages and Profit”, The Economic
Journal, March.
Lucas, R. (2004), “The Industrial Revolution: Past and Future. 2003 Annual Report Essay”, Federal Reserve Bank of Minneapolis. Available at: https://www.minneapolisfed.org/publications/the-region/the-industrial-revolution-past-and-future.
23
McKinsey Global Institute (2019), “The declining labor share of income in the United States”, May.
Milanovic B. (2013), “Why Income Inequality is Here to Stay”, Harvard Business Review, 3 January.
Organisation for Economic Cooperation and Development (OECD) (2018), Decoupling of wages from productivity: What implications for public policies?, in OECD Economic Outlook, Vol. 2018, Issue 2.
Philippon, T. (2019), “The Great Reversal”, Harvard University Press.
Piketty, T. (2013), “Capital in the Twenty-First Century”, Harvard University Press, Cambridge.
Ponattu, D., A. Sachs and H. Weinelt (2018), “Market Concentration and the Labor Share in Germany”, Policy Brief #2018/03, Bertelsmann Stiftung.
Solow, R. M. (1956), “A Contribution to the Theory of Economic Growth”, The
Quarterly Journal of Economics, Vol. 70, No. 1, pp. 65-94.
Solow, R. M. (1958), “A Skeptical Note on the Constancy of Relative Shares”, The
American Economic Review, September.
Stockhammer, E. (2009), “Determinants of functional income distribution in OECD countries”, Macroeconomic Policy Institute (IMK) at the Hans Boeckler Foundation, IMK Study Working Paper No. 5/2009, September.
Swan, T. W. (1956), “Economic Growth and Capital Accumulation”, The Economic