Fusion–fission hybrid system for nuclear waste transmutation (I):
Characterization of the system and burn-up calculations
D. Ridikas
a,*, R. Plukiene
b, A. Plukis
b, E.T. Cheng
caDSM/DAPNIA/SPhN, CEA Saclay, F-91191 Gif-sur-Yvette, France bInstitute of Physics, Savanoriu pr. 231, LT-2053 Vilnius, Lithuania cTSI Research, 312 S. Cedros Avenu, Solana Beach, CA 92075, USA
Abstract
Generally, a very intensive neutron source is needed for the efficient transmutation process of nuclear waste and minor actinides in particular. A plasma based fusion device is naturally a candidate neutron source. In this paper, we analyze a molten salt (flibe) blanket, driven by a plasma based fusion device, dedicated to burn actinides extracted from the LWR spent fuel. Performance parameters such askscr, burn-up, fluxes and equilibrium conditions were calculated to assess the characteristics of a flibe based
transmutation plant. It seems that nearly 1.1metric ton of spent fuel TRU could be burned annually with an output of 3 GWthfission
power. Detailed burn-up calculations show that equilibrium conditions of the fuel concentration in the flibe transmutation blanket could be achieved, provided that fission products were removed at least in part and fresh spent fuel TRU was added during burn-up on-line.
q2005 Elsevier Ltd. All rights reserved.
Keywords:Hybrid system; Nuclear waste transmutation
1. Introduction
The main goal of our present work is to investigate the performance of the dedicated molten salt (flibe) blanket for nuclear waste transmutation as a function of different treatment of fission products as well as different refueling of already destroyed actinides. This work is a continuation of the related studies (Cheng and Wong Clement, 2000; Cheng, 2001;Ridikas et al., 2001a) on a flibe based actinide transmutation hybrid system driven by a fusion device. Below, we present only a brief summary of the concept sufficient for understanding this follow-up study. A detailed description of the fusion–fission hybrid system including some burn-up calculations can be found in Refs. (Cheng and Wong Clement, 2000;Cheng, 2001).
In order to transmute efficiently the nuclear waste, a very high intensity neutron source is needed. It seems that an inertial confinement fusion (ICF) device could provide with a neutron source as intense as a high power accelerator, i.e. of the order of 1018–1019n/s (Cheng and Wong Clement, 2000). A molten salt (LiF–BeF2–(HN)F4) blanket, surrounding this neutron source, then serves as a medium for transuranic actinides (TRU) to be burned. Flibe also has a function of both coolant and carrier of tritium breeding material (6Li in this case). A well-known advantage of www.elsevier.com/locate/pnucene
0149-1970/$ - see front matterq2005 Elsevier Ltd. All rights reserved. doi:10.1016/j.pnucene.2005.09.004
* Corresponding author. Tel.:C33 1 690 878 47; fax:C33 1 690 875 84.
the molten salt is a possibility of both refueling of burned TRU and extraction of fission products (FP) on-line. Namely, these two parameters we are going to investigate in more detail in this work.
The main characteristics of the fusion–fission hybrid system are presented in Table 1. In order to produce 3000 MWthfission power, a 250 MW power fusion device operating with a deuterium–tritium fuel cycle is sufficient to provide with an external 14 MeV neutron source ofw9!1019n/s. The initial load of the fuel composition and
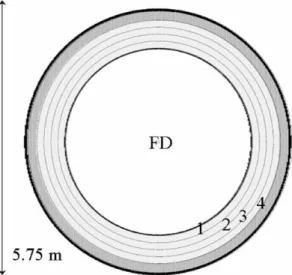
subsequent feeding material is a typical TRU vector defined by the LWR spent fuel to be given below. A simplified fusion–fission hybrid system was modelled with the main geometry and material parameters given inTable 2.Fig. 1 presents a geometry setup used in our calculations.
As presented inTable 2, flibe (a) contains 0.1% of6Li compared to the total amount of Li. Flibe (b) density is 2 g/ cm3and corresponding TRU density is 0.074 g/cm3of flibe or 0.5 M% in flibe. 0.6% of6Li enrichment for flibe (b) was taken as a reference case (Cheng and Wong Clement, 2000). In both cases,6Li serves as a breeding material for tritium production. The initial loading and subsequent feeding TRU compositions were those from LWR spent fuel when fission products and uranium are separated (to be provided in detail later in this paper in Section 3).
2. Modelling tools and procedure
All calculations on flibe based actinide transmutation blanket were made employing the Monteburns code system (Trellue and Poston, 1999)—an automatic-cyclic coupling of the MCNP (Briesmeister, 1993) and ORIGEN2 (RSICC, 1991) codes. Monteburns was already successfully benchmarked by simulating the uranium based fuel cycle of the high flux reactor at ILL Grenoble (Ridikas et al., 2000a) and gas turbine-modular helium cooled reactor (GT-MHR) in the case of plutonium (uranium free) fuel cycle (Ridikas et al., 2000b). MCNP was also used to obtain
keffin the mode of a criticality eigenvalue problem (kcode card in MCNP input), and also to estimate neutron flux as well askscrin its external source mode (sdef card in the MCNP input). In this case,kscris defined as:
kscrZðMnK1Þ=ðMnK1=nÞ (1)
wheren—is an average number of neutrons per fission andMnis a total neutron multiplication factor of the system. The effect of 14 MeV neutrons is included in the kscr calculations—the multiplication factor will be different for
Table 1
Main parameters of the fusion–fission hybrid system used in this study
Fusion power 250 MW
Fission power 3000 MWth
keffat equilibrium 0.743
MEat equilibrium 19
TBR at equilibrium 1.4
Initial TRU composition LWR spent fuel Initial TRU inventory (kg) 3040
MEstands for the energy multiplication of the system, while TBR for the tritium breeding ratio (Cheng, 2001).
Table 2
Neutronics model: zone dimension and material compositions for a molten salt transmutation blanket as from (Cheng and Wong, 2000) Zone name RadiusRiKRiC1(cm) Thickness (cm) Material composition
Cavity 0–200 200 Void
Liquid wall 200–201 1 Flibe (a)
Metallic wall 201–201.3 0.3 SS316, 50%
Graphite 201.3–202.3 1 Graphite
Blanket
Region 1 202.3–217.3 15 Flibe (b)
Region 2 217.3–232.3 15 Flibe (b)
Region 3 232.3–247.3 15 Flibe (b)
Region 4 247.3–262.3 15 Flibe (b)
Reflector 262.3–282.3 20 Graphite
Envelope 282.3–287.3 5 SS316, 50%
14 MeV and for fission source neutrons. The average value ofnin a problem is calculated by dividing the fission neutrons gained per fission by the fission neutrons lost to fission.
All burn-up calculations were done employing this external source mode. The advantage of the Monteburns code is that it can use different nuclear data libraries as long as they are compatible with MCNP format (see for example Ref. Ridikas et al., 2001b). For all structure materials and actinides, we have chosen ENDF data files (ENDF/B-VI, 1995) being most frequently employed, while for the fission products JENDL data library (JENDL-3.2,, 1994) was taken due to the biggest number of fission products available (w200).
The main goal of the modelling was to find the equilibrium conditions of the fusion–fission hybrid system and to investigate how these conditions could be influenced due to the different modes of refueling (continuous or discrete feeding) and also due to the different treatment of fission products (partial/full removal and/or continuous/discrete removal). For this purpose, we had to:
† stabilize an effective neutron multiplication coefficient and the total TRU mass in the system, † stabilize the neutron spectrumFn(E) as a function of burn-up,
† define the actual amount of fresh TRU material (DMTRU) to be fueled on-line.
In all cases, the fission power is kept constant (3000 MWth), what corresponds to a variable fusion power of the fusion device (Section 3.2). In our simulations, this implies a renormalization of the absolute neutron flux if an effective neutron multiplication coefficient of the system is changed.
3. Results
3.1. Neutron flux and energy spectra
Table 3presents the main neutron flux characteristics in different regions of the molten salt transmutation blanket (Fig. 1). Corresponding neutron spectra are presented in Fig. 2. In the 239-energy group, neutron spectrum the resonance absorption by transuranium (239Pu, 240Pu and 242Pu) and molten salt components (19F, 6Li) is clearly visible.
We note that the averaged neutron flux is very high and corresponds to the flux typical only for high flux reactors. In addition, the amount of thermal neutrons is very small (!1%). Most of the neutrons are epithermal or fast, what, in principle, could favor the transmutation of actinides in the resonance region. Indeed, the fast neutron flux (EnO 0.1 MeV) is about 1022n/cm2per full power year.
Table 4gives a variation of averaged neutron spectrum as a function of burn-up. The neutron spectrum in the blanket has two components. One is that from the slowing down of 14 MeV source neutrons. The other one is
the spectrum established by the fission neutrons. We note that the final spectrum due to 14 MeV source neutrons in the blanket is almost constant. Equally, the flux level is constant too if the fusion power is not changed. The spectrum due to fission neutrons is also very stable, except the flux level, which depends on fission reaction rates. This is because the majority of the fission neutrons are characterized by the same fission neutron spectrum and only then moderated in the blanket. Indeed, most of the fission reactions still occur in239Pu and241Pu, even though at a long burn-up stage significant amount of Am and Cm accumulates. FromTable 4, it is clearly seen that the neutron spectrum remains rather stable as a function of burn-up. In addition, this is also true if either continuous or discrete feeding of the fresh fuel is simulated. This might justify a less time consuming approach for the fuel burn-up calculations, i.e. as a good approximation one could calculate the neutron flux (and consequently flux weighted neutron cross-sections) only once and perform burn-up calculations with a constant neutron spectrum.
Finally,Table 5gives one group flux weighted neutron capture (sc) and fission (sf) cross-sections including their ratiosa(aZsc=sf) for transuranium actinides and comparison with other transmutation systems being either critical
or accelerator driven as reported bySalvatores (2002). It is clear that epithermal flux is more favored for the most of
Table 3
Neutron flux characteristics in different regions of molten salt transmutation blanket at the beginning of the irradiation Zone name Fn(total), n/s cm2 Fn(EnO0.1 MeV), %
Region 1 2.47!1015 26.2
Region 2 1.84!1015 22.4
Region 3 1.22!1015 20.4
Region 4 0.75!1015 20.6
Regions 1–4 1.48!1015 22.9
Also seeTable 1.
10-8 10-7 10-6 10-5 10-4 10-3 10-2 10-1 100 101 1010
1011 1012 1013 1014
region 1 region 2 region 3 region 4 all regions
6
Li
19
F
240 Pu
242 Pu
E, MeV
239 Pu
Neutron flux, n/(cm
2* s* lethargy)
Fig. 2. Neutron energy spectra in different flibe regions. A solid line indicates the average neutron flux over all regions with fuel.
Table 4
Averaged neutron spectrum over all flibe regions, presented in different energy groups (%) as a function of burn-up (time) Time,
days
Fn,% (Discrete) Fn,% (Continuous)
[0.,1.] (eV)
[1.,100.] (eV)
[.1,100.] (keV)
[.1,1.] (MeV)
[1.,20] (MeV)
[0.,1.] (eV)
[1.,100.] (eV)
[.1,100.] (keV)
[.1,1.] (MeV)
actinides compared with thermal flux (only239Pu and237Np is transmuted more efficiently in this case). However, Table 5also shows thatavalues are the smallest in fast neutron spectra—direct incineration by fission being maximal in this case.
3.2. Equilibrium conditions
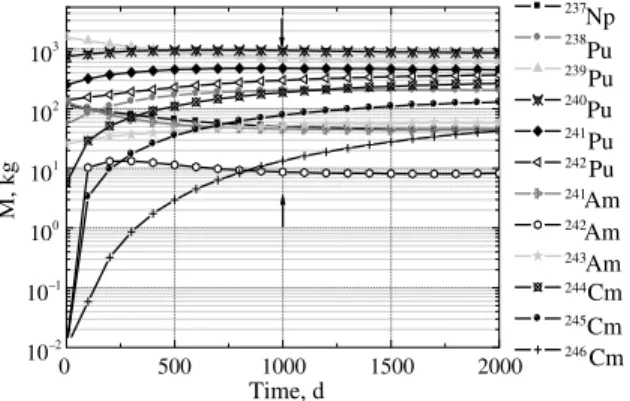
A typical evolution of the TRU isotopic composition is presented inFig. 3. This is the case when the system is refueled continuously. In addition, the fission products are also continuously removed on-line at 100% rate.
In order to define the equilibrium, we employ the following procedure. Since not all actinides are stabilized even after 2000 days of operation (Cm isotopes in particular), we assume that the system reaches equilibrium (or system is approaching equilibrium) when the variation of Pu isotope mass is less than 4% with respect to the actual plutonium mass in the blanket. This is represented in detail in Fig. 4, where the time dependence of the ratioDMi/Miof Pu isotope masses is illustrated. According to this analysis, we conclude that the equilibrium is reached after about 1000G50 days of irradiation.
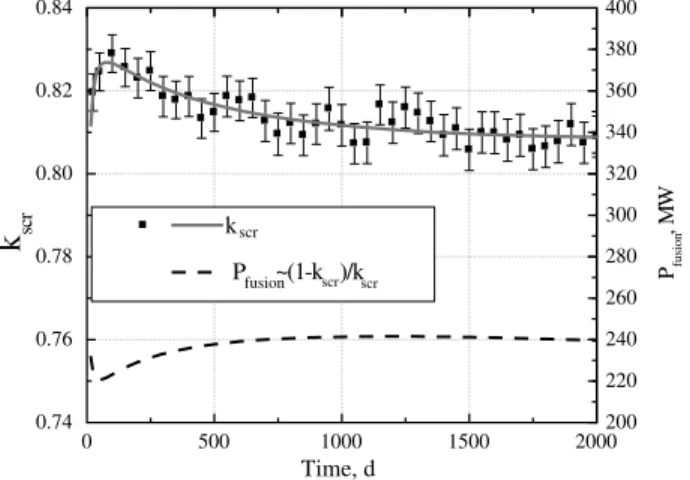
A corresponding behavior ofkscrand required fusion powerPfusionat a constant fission power of 3000 MWthare presented inFig. 5. The excursion ofkscroccurs mainly due to the mass conversion of240Pu into241Pu during early stage of irradiation (Figs. 3 and 4 for detailed mass dependence of 241Pu irradiation). The values of kscr were calculated in the case when all fission products are continuously removed from the blanket. The variation of fusion power is between 220 and 242 MW. We remind that 1 MW fusion power corresponds to the external neutron source intensity ofw4!1017n/s of 14 MeV neutrons.
Table 5
Average fission, capture cross-sections, and their ratios for a number of selected actinides
Isotope sc;b sf;b a(fthis work) a(fthermal)
(Salvatores, 2002)
a(ffast) (Salvatores, 2002)
237Np 18.20 0.26 70.0 63 5.3
238Pu 6.79 1.90 3.6 12 0.53
239Pu 7.70 10.80 0.7 0.58 0.3
240Pu 14.60 0.31 47.1 396.6 1.6
241Pu 6.48 20.70 0.3 0.4 0.19
242Pu 14.20 0.22 64.5 65.5 1.8
241Am 20.60 0.36 57.2 100 7.4
242mAm 7.20 44.00 0.2 0.23 0.18
243Am 27.50 0.21 57.2 111 8.6
243Cm 3.25 21.10 0.2 0.16 0.14
244Cm 16.30 0.65 25.1 16 1.4
245Cm 3.25 22.70 0.1 0.15 0.18
Average cross-section (barn) is defined assZÐsðEÞ4ðEÞdE=Ð4ðEÞdE.
0 500 1000 1500 2000
10–2
10–1 100 101
102
103
237Np 238
Pu 239Pu 240
Pu 241
Pu 242Pu 241Am 242Am 243Am 244Cm 245Cm 246Cm
M, kg
Time, d
Finally, we note that w3.1 kg of TRU is burned per day when the equilibrium situation is reached, what
corresponds to nearly 1.1 metric ton of TRU burned annually.Table 6gives detailed isotopic composition of the initial TRU vector and also at equilibrium, i.e. afterw1000 days of irradiation. Different options DD, DC, CD, and
CC correspond to different refueling conditions and also to different treatment of the fission products (see the caption ofTable 6). For comparison, we also present the results reported in Ref. (Cheng and Wong Clement (2000)). We note that in all cases equilibrium is reached and a reasonable agreement between Pu, Np and Cm isotopes is obtained when compared to the calculations reported in Ref.Cheng and Wong Clement (2000). On the other hand, in our case we obtained much less242Am and243Am. This difference is mainly due to the different data libraries used.
3.3. Effect of different feeding options
In general, it is preferred that an effective neutron multiplication factor is as stable as possible for any nuclear reactor being either critical or sub-critical. Fig. 6, illustrates the effect of different feeding options on kscr. As expected, the discrete feeding results in sharp variations ofkscr, consequently, possible sharp variations of the reactor power. Of course, this effect could be diminished with additional control rods. On the other hand, the situation is improved considerably if continuous feeding option is chosen (see the sameFig. 6).
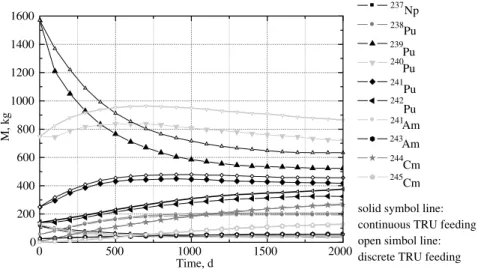
We also note separately that in both cases as above a slightly different isotopic composition at equilibrium stage is obtained (Table 6). As it can be seen fromFig. 7, the difference appears mainly in the first step of burn-up calculation,
0 500 1000 1500 2000 –50
–40 –30 –20 –10 0 10 20
238
Pu
239
Pu
240
Pu
241
Pu
242
Pu
∆
Mi
/ M
i
, %
Time, d
Fig. 4. Variation in mass (%) of Pu isotopes as a function of the irradiation time in the case of continuous feeding of TRU material and total removal of FP; i stands for a different isotope of Pu.
0 500 1000 1500 2000
0.74 0.76 0.78 0.80 0.82 0.84
200 220 240 260 280 300 320 340 360 380 400
kscr
k
scrTime, d
Pfusion
, M
W
Pfusion~(1-kscr)/kscr
after which the behavior of the curves is rather similar. TRU mass at equilibrium with discrete feeding is 2770 kg and with continuous feeding isw3100 kg. The reason for such a difference is that in the discrete feeding case a fresh TRU
material was added at the beginning of each step (100 days long), while in continuous feeding case—it was replenished during each step. Therefore, in the first case less initial TRU material remains in the molten salt from the very beginning. Smaller equilibrium mass of TRU material could be important for system safety requirements. On the other hand, discrete feeding results in sharp fluctuations ofkscr, as already discussed above, what would be difficult to tolerate in the realistic system.
One could also ask if different feeding options could change the equilibrium conditions.Fig. 8, clearly shows that in both cases (with discrete and continuous feeding), 239Pu mass equilibrates with the same speed. In other words, less than 4% variation is achieved in both cases at the same time. The same is also true for other isotopes of plutonium.
Table 6
TRU composition (%) in the molten salt at initial and equilibrium stages Stage Initial Equilibrium
Cases DD DC CD CC (Cheng et al.,
2000)
Time, days 0 1000 1000 1000 1000 w980
237Np (%) 3.78 1.50 1.48 1.63 1.62 1.51
Total Np (%) 3.78 1.51 1.50 1.64 1.64 1.51
238Pu (%) 1.81 6.92 6.98 6.47 6.57 4.83
239Pu (%) 51.64 21.23 21.05 22.95 22.75 20.90 240Pu (%) 24.61 29.49 29.16 30.42 30.58 30.10 241Pu (%) 8.22 16.09 16.18 15.35 15.31 15.70 242Pu (%) 4.61 10.14 9.96 9.90 9.71 10.70
Total Pu (%) 90.89 83.88 83.35 85.10 84.92 82.20
241Am (%) 4.21 1.34 1.32 1.49 1.48 1.49
242mAm (%) 0.00 0.29 0.28 0.29 0.28 0.59
243Am (%) 0.83 1.82 1.88 1.60 1.67 4.80
Total Am (%) 5.04 3.45 3.48 3.38 3.43 6.89
244Cm (%) 0.19 6.74 6.87 5.83 6.05 6.31
245Cm (%) 0.00 2.91 2.99 2.45 2.52 2.68
246Cm (%) 0.00 0.52 0.54 0.41 0.43 0.49
Total Cm (%) 0.19 10.17 10.40 8.70 9.01 9.49
Others (%) 1.01 1.31 1.21 1.03
DD, discrete feeding and discrete FP removal; DC, discrete feeding and continuous FP removal; CD, continuous feeding and discrete FP removal; CC, continuous feeding and continuous FP removal; in all cases 100% of FP were removed.
0 500 1000 1500 2000 0.65
0.70 0.75 0.80 0.85 0.90
discrete feeding continuous feeding
100% discrete removal of FP kscr
Time, d
3.4. Effect of fission products
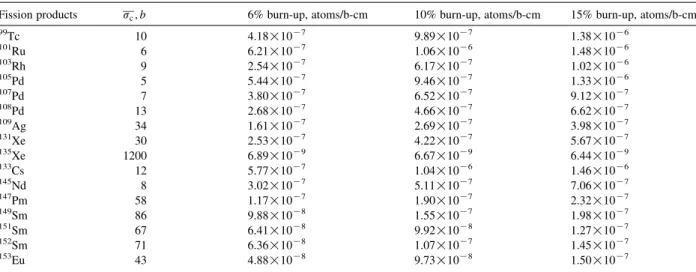
The importance of fission products in the molten salt blanket for fusion–fission hybrid system was analyzed partially in Ref. (Ridikas et al., 2000a). It was concluded that on-line removal and disposal of some neutron poisonous fission products may be needed in order to reach deep burn-up level and, at the same time, to keep the effective neutron multiplication coefficient of the system (equally blanket fission power) as close to the initial value as possible. In the same study, it was found that fission products are responsible at least forK3150 pcm decrease in the effective neutron multiplication coefficient at 15% burn-up. It was also pointed out that the tolerance of the fission products in molten salt may allow a batch process, and the allowable burn-up tolerance level could be about 10% or slightly more. InTable 7, we identify the most important fission products contributing more than 0.1% to the total macroscopic neutron absorption of the entire blanket, being 6.3!10K3(1/cm) for 0% burn-up at the beginning of the irradiation. Typically, these fission products are long lived or stable nuclei with an averaged (flux weighted) neutron capture cross-sections of the order of 5–80 barns. All these fission products, due to their constant accumulation and also because of their important neutron capturing, will degrade the performance of the entire system as we already mentioned above. The only exception is135Xe, know as the most ‘poisonous’ fission product, which is short lived (T1/2Z9.14 h only) but is equally important in a long run due to its very high neutron capture cross-section (about
1200 b in this particular neutron flux). As it can be seen from the sameTable 7, the concentration of135Xe gets saturated and it will not perturb the system more as it has done by now (so called Xe-effect in reactor physics). One
0 500 1000 1500 2000 0
200 400 600 800 1000 1200 1400 1600
237
Np
238
Pu 239
Pu 240
Pu 241
Pu 242
Pu
241Am
243 Am
244
Cm 245
Cm
solid symbol line: continuous TRU feeding open simbol line: discrete TRU feeding
M, kg
Time, d
Fig. 7. TRU isotopic composition profile in molten salt as a function of irradiation in the cases of discrete and continuous feeding.
500
0 1000 1500 2000
0 4 8 12 16 20 24
∆
Mi
/
Mi
, %
Time, d 239
Pu continuous feeding 239
Pu discrete feeding
has to note that the actual effect of non-soluble or gaseous fission products for the performance of the entire system will be somewhat lower than presented in this work; simply because these fission products will have a chance to leave the blanket before neutron interaction takes place.
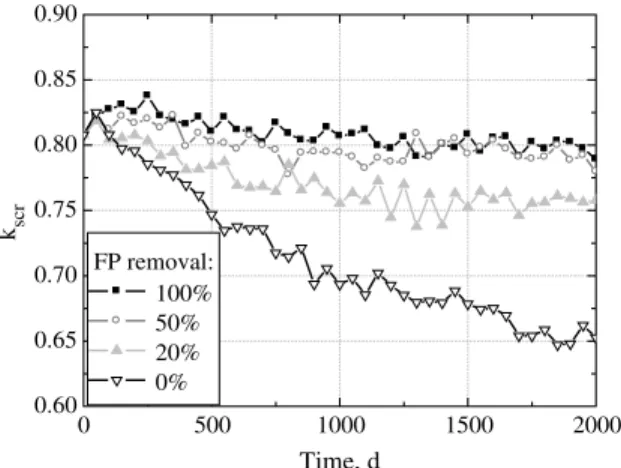
Fig. 9presents the behavior ofkscrwhen all fission products are removed in two different modes, i.e. continuously and discretely. It seems that the way fission products are removed (as long as they are removed 100%) has little influence on the performance of the system. On the other hand, the percentage of removed FP relative to the total mass of fission products present in the blanket becomes crucial as shown inFig. 10.
Four different scenarios were considered with the following FP removal options: 100, 50, 20 and 0%, respectively. 0% corresponds to the case when all fission products are left in the molten salt flibe, while in the case of 100%—all fission products are removed.
One can ask why there is such a big difference between removal of 50, 20 and 0% of fission products. This can be explained by analyzing the creation/destruction and removal ratios of the fission products. We will take, for example, a stable fission product132Xe, which has a small neutron capture cross-section. InFig. 11, we present its mass as a function of burn-up when either 100% or part of the fission products is left. When all fission products are left, the amount of132Xe increases linearly (triangles).
Table 7
Fission products contributing more than 0.1% to the total macroscopic neutron absorption in a self-cooled molten salt transmutation blanket Fission products sc;b 6% burn-up, atoms/b-cm 10% burn-up, atoms/b-cm 15% burn-up, atoms/b-cm
99Tc 10 4.18!10K7 9.89!10K7 1.38!10K6
101Ru 6 6.21!10K7 1.06!10K6 1.48!10K6
103Rh 9 2.54!10K7 6.17!10K7 1.02!10K6
105Pd 5 5.44!10K7 9.46!10K7 1.33!10K6
107Pd 7 3.80!10K7 6.52!10K7 9.12!10K7
108Pd 13 2.68!10K7 4.66!10K7 6.62!10K7
109Ag 34 1.61!10K7 2.69!10K7 3.98!10K7
131Xe 30 2.53!10K7 4.22!10K7 5.67!10K7
135Xe 1200 6.89!10K9 6.67!10K9 6.44!10K9
133Cs 12 5.77!10K7 1.04!10K6 1.46!10K6
145Nd 8 3.02!10K7 5.11!10K7 7.06!10K7
147Pm 58 1.17!10K7 1.90!10K7 2.32!10K7
149Sm 86 9.88!10K8 1.55!10K7 1.98!10K7
151Sm 67 6.41!10K8 9.92!10K8 1.27!10K7
152Sm 71 6.36!10K8 1.07!10K7 1.45!10K7
153Eu 43 4.88!10K8 9.73!10K8 1.50!10K7
Note that the macroscopic neutron absorption due to a particular fission product in (1/cm) could be easily obtained by multiplyingscin (barns) with a corresponding atomic density in (atoms/barn cm) as a function of burn-up.
0 500 1000 1500 2000
0.65 0.70 0.75 0.80 0.85 0.90
kscr
Time, d
Continuous removal of FP 100% Discrete removal of FP 100%
When 20% of FP are taken away, the132Xe mass reaches the equilibrium afterw1200 days and later its mass
remains stable; in the case of 50% removal the equilibrium is reached already afterw400 days. It should be pointed
out separately that as long as fission products reach equilibrium,kscralso varies very little (compare the curves in
Fig. 10keeping in mind the corresponding curves inFig. 11). Rather similar situation will be with other (stable or long-lived and with similar capture cross-sections) fission products—they will reach equilibrium at different times and at different quantities. For the rest of fission products (short lived or with high capture cross-sections), the equilibrium may be reached much faster and is some cases even without removal.
Finally, we add that a mechanism to remove the fission products is definitely needed in the molten salt transmutation system. This has to be done not only due to the better neutron balance of the system as discussed above but also due the following reason. The burn-up of the TRU materials is about 1.1 metric ton per year, equivalent to about 30% of the TRU inventory in the blanket. Solidification of fission products will occur in the molten salt quite soon after the operation, if some fission products are not removed. The next study of this area would be to look into strategy and reality how these fission products can be removed.
3.5. Effect of the3H/3He
The neutron multiplication coefficientkscrin the blanket depends not only on accumulation of fission products as it was described in the previous chapter, but also on accumulation of volatile materials—3H and3He.3H is produced mainly from6Li (6Li(n,a)3H), which should be continuously replenished with new TRU in the molten salt blanket in order to provide the continuous supply of3H for fusion device. At the same time, due to the3Hb-decay the3He is
0.60 0.65 0.70 0.75 0.80 0.85 0.90
kscr
Time, d FP removal:
100% 50% 20% 0%
0 500 1000 1500 2000
Fig. 10.kscras a function of different percentage of fission products removed from the flibe.
0 500 1000 1500 2000 0
50 100 150 200 250
132
X
e m
ass,
k
g
Time, d Continuous FP removal:
50% 20% 0%
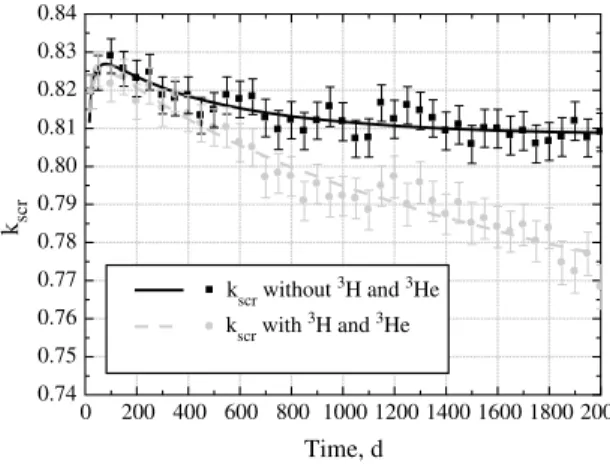
produced. The microscopic neutron capture cross-section of 3He(n,p)3H is about 1000 b. The efficient neutron absorption in3He disturbs neutron balance in the hybrid system blanket as it is shown inFig. 12. Due to the presence of3H and3He in the molten salt thekscrof the system decreases all the time starting from 400 days and in such case the equilibrium stage in the system cannot be achieved. After 2000 days 5% difference inkscris obtained for the two cases: blanket with 3H and3He and blanket without these nuclides. In more realistic scenario volatile3H and 3He nuclides either will be removed (separated for fusion process as in the case of3H) or will escape by leakage from the molten salt blanket. Indeed, the solubility of hydrogen in the flibe molten salt is extremely low such that it is very often the total inventory of hydrogen in the flibe blanket is only a few grams, compared to about 80 metric ton of flibe. On the other hand, the certain part of3H and3He will be present in the blanket during the system operation and this should be taken into account when making modelling calculations for fusion–fission hybrid system.
4. Conclusions
The performance a fusion–fission hybrid system with the molten salt (flibe) blanket, driven by a plasma based fusion device and dedicated to burn actinides extracted from the LWR spent fuel TRU, was analyzed. Detailed burn-up calculations with different modes of replenishing the destroyed TRU material and also with different treatment of fission products were done using Monteburns code system. Major system performance parameters of the system (e.g.
kscr,Fn(En), equilibrium conditions, etc.) were investigated. We conclude that equilibrium concentration for most of the TRU materials in the blanket can be achieved after about 3 years of exposure. Such a plant could annually burn about 1.1 metric ton of spent fuel actinides when the fission power output is 3000 MWth. Different replenishing of the destroyed TRU material was tested (continuous and discrete feeding). A stable neutron energy spectrum was obtained in both cases. The behavior ofkscrin the case of a discrete feeding has sharp fluctuations if compared with continuous feeding. On the other hand, a different TRU mass in the blanket at equilibrium was obtained (3100 and 2770 kg with continuous and discrete feeding, respectively). Although a smaller TRU mass at equilibrium is preferred due to safety reasons, a more stable performance of the system obtained in the case of a continuous feeding is recommended. Accumulation of fission products in the blanket was investigated including their influence on the performance of the system. We found thatkscris rather stable (0.81–0.79) during the calculation time when all or at least 50% of fission products are taken away. The removal of a smaller percentage of fission products is not recommended since, kscr would fall down considerably (e.g. 0.81(0.76 and 0.81(0.65 with only 20 or 0% FP removal, respectively, within 2000 days of burn-up). The most poisonous fission products were identified in terms of their macroscopic capture cross-sections. We found that fission products are responsible at least forK3150 pcm decrease inkscrat 15% burn-up. The presence of volatile3H and3He has significant influence on hybrid systemkscrstability and should be taken into account when performing hybrid system model calculations. In spite of very promising results on the efficient TRU destruction, we found that at equilibrium, significant amount of curium isotopes is accumulated, while for the rest of actinides fully equilibrated concentrations are reached. In this respect an optimization procedure should be developed in order to determine the optimal fission-blanket composition corresponding to the fast incineration rate of actinides
0 200 400 600 800 1000 1200 1400 1600 1800 2000 0.74
0.75 0.76 0.77 0.78 0.79 0.80 0.81 0.82 0.83 0.84
kscr without 3H and 3He
kscr with 3H and 3He
kscr
Time, d
including all minor actinides. Another important issue is directly related to the benchmark of different sets of nuclear data libraries in the case of minor actinide incineration scenarios. These problems are addressed in our companion paper byPlukiene et al. (in press).
Acknowledgements
This work was accomplished in the frame of the French–Lithuanian cooperation program ‘Gilibert’ (Ref. No 06452PG) and partly was supported by a Lithuanian State Science and Studies Foundation within C-03049 project.
References
Briesmeister J. for Group X-6 (1993), MCNP-A, A General Monte Carlo Code for Neutron and Photon Transport, Version 4A, LANL, preprint LA-12625-M.
Cheng E.T. and Wong Clement P.C. (2000), Transmutation of Actinide in Fusion Reactors and Related Systems Analysis, Proc. of 10th Int. Conf. on Emerging Nuclear Energy Systems, ICENES’2000, Petten, The Netherlands, 24–28 September (and Refs. therein).
Cheng, E.T., Cheng, E.T., 2001. Characteristics of Promising Transmutation Blanket Concepts Proc. of the International Workshop on Blanket and Fusion Concepts for the Transmutation of Actinides, General Atomics, San Diego, California, USA 2001.
ENDF/B-VI.The US Evaluated Neutrons Nuclear Data Library for Neutron Reactions, IAEA-Vienna, IAEA-NDS-100 (1995), Rev 6. JENDL-3.2, Japanese Evaluated Nuclear Data Library, IAEA-Vienna, IAEA-NDS-110, (1994), Rev 5.
Plukiene R., Plukis A., Ridikas D., Cheng E.T., Fusion - Fission Hybrid System for Nuclear Waste Transmutation (II): From the Burn-up Optimization to the Tests of Different Data, accepted for publication in Progress in Nuclear Energy (June 2005).
Ridikas D., Fioni G., Goberis P., Marie F., A (2000), On the Fuel Cycle and Neutron Fluxes of the High Flux reactor at ILL Grenoble, Proc. of the 5th Int. Specialists Meeting SATIF-5, OECD/NEA Paris, France, 17–21 July.
Ridikas D., Bletzacker L., Goberis P., Fioni G., Marie F., B (2000), “Critical and Sub-critical GT-MHRs for Waste Disposal and Proliferation-Resistant Plutonium Fuel Cycles”, paper 7 in the Proc. of the 6th OECD/NEA Information Exchange Meeting on Actinide and Fission Product Partitioning and Transmutation, p. 71. Madrid, Spain, 11–13 December.
Ridikas, D., Fioni, G., Cheng, E.T.A., 2001a. A Importance of Fission Products in the Molten Salt Blanket for Fusion - Fission Hybrid Systems Proc. of the International Workshop on Blanket and Fusion Concepts for the Transmutation of Actinides, General Atomics, San Diego, California, USA 2001.
Ridikas, D., Bletzacker, L., Goberis, P., Fioni, G., Marie, F., 2001b. Comparative Analysis of ENDF, JEF, and JENDL Data Libraries by Modelling High Temperature Reactors (GT-MHR) and Plutonium Based Fuel Cycles Proc. of the Int. Conference on Nuclear Data for Science and Technology, ND2001, Tsukuba, Ibaraki, Japan 2001.
RSICC Computer Code Collection (1991), ORIGEN 2.1 -Isotope Generation and Depletion Code Matrix Exponential Method, Radiation shielding Information Center, report CCC-371.
Salvatores, M., 2002. The physics of transmutation in critical or sub-critical reactors. C.R. Physique 3, 999–1012.