Coffee Science, e151672, 2020
Doi: https://doi.org/10.25186/.v15i.1672
Chemical and sensory perception of robusta coffees under wet processing
Emanuele Catarina da Silva Oliveira1 , Rogério Carvalho Guarçoni2 , Eustáquio Vinicius Ribeiro de Castro3 ,
Marina Gomes de Castro1 , Lucas Louzada Pereira1 1Instituto Federal de Educação, Ciência e Tecnologia, Venda Nova do Imigrante, ES, Brasil
2Instituto Capixaba de Pesquisa, Assistência Técnica e Extensão Rural/INCAPER, Departamento de Estatística, Vitória, ES, Brasil 3Universidade Federal do Espírito Santo/UFES, Departamento de Química, Vitória, ES, Brasil
Contact authors: [email protected], [email protected], [email protected], [email protected], [email protected] Received in November 12, 2019 and approved in June 15, 2020
ABSTRACT
The quality of the coffee is determined by the sensorial analysis, using subjective methods and it is known that this quality is related to the chemical constituents of the grains. The present study used infrared spectroscopy to correlate the chemical composition of the grain with the final quality of the product and to assist in the current evaluation method, generating more reliability in the process. This study applied the spontaneous and induced fer-mentation with starter cultures (yeast) to evaluate the sensory potential from the impacts generated by the types of processes adopted. The experiments were conducted in a randomized block design with five replicates, in a 3x4 factorial scheme, with three fermentation times: 24, 48, and 72 hours and four wet processes: Washed, Yeast fermentation, Fully washed without yeast, and Fully washed with yeast. Infrared spectra were taken in the medium region (FTIR-ATR) of the 34 samples generated by the treatments. Given that the method of determining the quality of coffee is subjective, based on scores given by cuppers, the FTIR-ATR spectra were used in the construction of chemometric models to predict sensory ratings given to the attribute ‘acidity’. The mean error of prediction of the model constructed for the sensory score was 0.11. Sensory results indicated a higher score for the acidity attribute, in dry fermentation with yeast at the time of 48 hours, suggesting a new strategy for the production of quality robusta coffee.
Key words: Fourier transform infrared spectroscopy; chemometrics; fermentation; acidity.
1 INTRODUCTION
Data from the US Department of Agriculture shows that the world consumes approximately 9 million tons of coffee per year (USDA, 2017). Coffee is an important product for the Brazilian economy, with Brazil being the largest producer and exporter of coffee in the world, having in its production chain two species of economic importance: Coffea arabica L. (arabica coffee) and Coffea canephora (robusta coffee). Arabica coffee accounts for 81% of the coffee area cultivated in the country and robusta 19% (CONAB, 2018).
Robusta coffee has sensory attributes that normally present neutrality as to the sweetness and acidity; it has a remarkable aroma of roasted cereal and it stands out for its body more pronounced than the arabica coffee. The final quality of the product that is offered to the consumer is determined by the sensory analysis performed by cuppers, using subjective methods and cupping experience accumulated over the years (Di Donfrancesco; Gutierrez Guzman; Chambers, 2014).
This task is often complex because Q-Graders should be able to balance and define the sensory routes that best fit the reality of the consumer market that the coffee will be destined for because the nuances of flavor and aroma are what make the evaluation of coffee a complicated task (Bhumiratana; Adhikari; Chambers, 2011)
The chemical constituents, volatile or not, present in the coffee are responsible for giving it distinctive flavor and aroma, and these constituents vary both qualitatively and
quantitatively when compared to coffees of different qualities (Carrera et al., 1998).
From the sensory perspective, it is known that Coffea arabica L. coffees usually receive better scores on flavor, aroma, sweetness, and body than coffees from warmer regions (Da Silva et al., 2014). These factors are widely discussed among researchers who study the behavior of these variables for arabica coffee (Joët et al., 2010; Vaast et al., 2006). In the case of Coffea canephora PIERRE culture, these factors are beginning to be perceived as potential quality indicators. Apart from that fact, the quality of robusta coffee needs more studies that relate the sensory specifications to the chemical compounds responsible for them (Wei et al., 2014).
The final quality of the coffee is related to the chemical constituents of the roasted grains, due to the wide chemical interaction that occurs during the roasting stages (Ribeiro et al., 2014). From the chemical perspective, it is already known that the rates of caffeine, chlorogenic acids, and reducing sugars are different depending on genetics and the groups, arabica or robusta (Alonso-Salces et al., 2009; Liu et al., 2012; Tfouni et al., 2012; Wei et al., 2010).
In addition to the search for more robust methods of analysis, new processing has been applied in the production of specialty coffees to reduce climatic and technological disparities. Such approach is based on the effect of microorganisms present in the processing, such as yeasts: Debaryomyces ssp., Pichia ssp., Candida ssp., Pichia kluyveri, and Saccharomyces ceverisiae (Pereira et al., 2014; Silva et
al., 2008; Silva; Batista; Schwan, 2008); as well as bacteria, such as Lactobacillus ssp., Bacillus ssp., Arthrobacter ssp., Acinetobacter ssp., Klebsiella ssp., and Weissella ssp. (Evangelista et al., 2014a; Evangelista et al., 2014b; Massawe; Lifa, 2010; Velmourougane, 2013), once their fermentation capacity can generate new optimization strands of coffee quality.
Studies have been carried out in an attempt to correlate the chemical composition of the grain with the final quality of the product, and thus help the current evaluation method, reducing its subjectivity (Correia et al., 2018; Ribeiro et al., 2014; Tfouni et al., 2012; Wei et al., 2014). The chemical compounds of coffee concerning sensory perception are given by their subjectivity in the process (Bhumiratana; Adhikari; Chambers, 2011; Di Donfrancesco (Di Donfrancesco; Gutierrez Guzman; Chambers, 2014; Seo; Lee; Hwang, 2009). Infrared spectroscopy, compared to other techniques, has the advantage of being a simple, rapid, inexpensive, and non-degrading analytical method, as well as providing a spectrum with many relevant pieces of information, such as functional groups that may be related to compounds present in the coffee responsible for their quality.
The infrared spectra of the coffee contain numerous absorption bands reflecting its great chemical complexity. Therefore, to explore more information of this data, multivariate analysis methods have been applied to extract as much information as possible, and thus correlate a chemical composition with sensory attributes.
In this paper, MID-infrared spectroscopy FTIR-ATR (Fourier Transform Infrared Attenuated Total Reflectance) was applied on the chemical class to evaluate the coffee beans subjected to the robusta wet-processing technology, to evaluate the effectiveness on improving the quality of robusta coffee through the prediction model. For this purpose, PLS (Partial Least Squares) regression models were constructed from the mean infrared spectra of the coffee samples, aiming to estimate acidity scores that reflect the sensorial descriptor of the robusta coffee.
2 MATERIAL AND METHODS 2.1 Sample preparation: wet processing
The raw materials selected to perform the experiments were composed of coffees from Coffea canephora PIERRE species - Conilon Vitoria variety. All samples were processed according to the same specifications as described: coffee pulp, husk from the peeling process, water, and yeast (Saccharomyces cerevisiae). Fifteen kilograms of coffee were harvested per experimental plot in all experiments, presenting 95% of ripe fruits. After harvest, the fruits were processed according to established procedures.
For the four proposed methods, a must from the patent process BR1020160040531 was prepared with yeast culture (Saccharomyces cerevisiae) Fleischmann brand. The yeast was acquired in the local market, 100 grams were sterilized in falcon tubes with the aid of precision scales, after these procedures, husk was added on the must to conduce the fermentation processing.
The four methods consisted of the following processes: • Process 1: fermentation wort with water (washed), 10 kg
of pulped coffee cherries (pulp), 5 kg of husk and 5 liters of water.
• Process 2: yeast starter culture (Saccharomyces cerevisiae), 1% (1p/v) of the must, 10 kg of pulped coffee
cherries (pulp), 5 kg of husk, 5 liters of water.
• Process 3: dry fermentation must (fully washed without yeast), 10 kg of pulped coffee cherries (pulp) and 5 kg of husk, without additional water on the process.
• Process 4: dry fermentation wort with yeast (fully washed with yeast), fermentation must with yeast starter culture (Saccharomyces cerevisiae), 1% (2p/v) of the must, 10 kg
of pulped coffee cherries (pulp), 5 kg of husk, without added water.
To perform the experiments, must 1 and 2 were submitted to the treatment methods at 38 °C, remaining immersed in fermentation tanks, for 24, 48 and 72 hours (Pereira et al., 2015). Musts 3 and 4 received husk only, originated from the wet process, and remained in the fermentation process for 24, 48, and 72 hours. Must 3 did not receive addition of external microorganisms.
After the fermentation period, must 1, 2, 3, and 4 were washed and taken to dry on a suspended, covered yard (Pereira; Guarçoni; Cardoso, 2018a).
2.2 Preparation of the samples for sensory analysis
After the resting period of the samples (45 days), the coffees were classified according to the methodology of the Uganda Coffee Development Authority (UCDA, 2010) by type and sieve. The roasting process was performed only with coffee beans that passed through sieve #15 up. Thus, a 15 sieve has holes with a diameter of 15/64 inches or 6 mm (15 × 2.54 / 64).
Samples were prepared according to the Uganda Coffee Development Authority methodology. Roasting was conducted using the Laboratto TGP-2 roaster with the Agtron-SCA disk set. The roasting point of these samples was set based on grain color among the colors determined by manual disks of Agtron #65 and #55 for specialty coffees (UCDA, 2010).
Roasting was executed within 24 hours of cupping and it was allowed to rest for 8 hours before grinding. All samples
1Parts per volume (quantity of Saccharomyces cerevisiae in function of the must). 2Parts per volume (quantity of Saccharomyces cerevisiae in function of the must).
were roasted from 9 to 10 minutes. After roasting and cooling, the samples remained stored in sealed containers (UCDA, 2010).
After 8 to 24 hours after the roosting process, the coffee was ground in a disc mill (Bunn Coffee Mill, model G3A HD), with granulometry between 70 and 75% of the particles passing through a sieve 20 mesh, US Standards (SCA, 2015). The infusion was performed after the water reached 92-95 ºC. The Q-Graders began the evaluation when the temperature of the cups reached 55 ºC, respecting the time of 4 minutes from the infusion before the evaluation.
2.3 Sensory Analysis by the UCDA Method The sensory analysis of the coffees was carried out by a panel of 6 (six) cuppers, all with Q Robusta Grader3
certification. The minimum number of evaluators for the sensory analysis was initially proposed aiming to reduce the subjectivity of the analysis (Pereira et al., 2018b).
2.4 Infrared Analysis
Infrared (IR) spectra in the middle region of the roasted and ground coffee samples were obtained using a Cary 630 FTIR-ATR spectrometer from Agilent Technologies, and a diamond ATR (Attenuated Total Reflectance) accessory with reflection angle of 45°, 1 mm in diameter, 200 μm of active area, and approximately 2 μm of penetration depth, using a Zinc Selenide (ZnSe) reflectance detector. The recorded spectrum was obtained as the mean of 256 consecutive scans, with a resolution of 1 cm-1 in the spectral range of 4000 to
630cm-1. In this work, the spectra of three different aliquots of
each sample were recorded. 2.5 Experimental design
The experiments were conducted in a randomized block design with five replications, in a 3 x 4 factorial scheme, with three fermentation times - 24, 48, and 72 hours and four wet treatments - Washed, Yeast fermentation, Fully washed without yeast, and Fully washed with yeast. For statistical analysis, variance analysis was performed, the means were compared using the Tukey test.
2.6 Chemometric data treatment
The original spectra were organized in a matrix, where each replica was considered as a sample. All calculations were performed on Matlab version R2013a and Microsoft Excel version 2016. Before the application of the chemometric tools to the dataset, the multiplicative scatter correction (MSC), or first derivative correction, with a 9-point window and grade 2 polynomial adjustment, was applied to correct problems
with spectra baseline variation. The optimal number of latent variables for each PLS model was determined by the k-fold cross-validation procedure. The models were evaluated for the linear adjustment (R2 - coefficient of determination) and mean
accuracy (RMSEP - Root mean square error of prediction) (Filgueiras et al., 2014; Portela et al., 2016).
3 RESULTS AND DISCUSSION
The acidity in the coffee has still been discussed in function to the fermentative processes that occur in the processing phase, for the composition of the mucilaginous mesocarp of ripe coffee fruits includes sugars, complex polysaccharides, proteins, lipids, and minerals. In detriment of this chemical composition, they become a favorable medium for the growth of bacteria, fungi, and yeasts (Castro; Marraccini, 2006). The variation of these components in the coffee influences its quality, which is given by the sensory analysis. Table 1 shows the sensory results for the acidity attribute that is evaluated according to the Uganda Coffee Development Authority (UCDA, 2010) protocol.
3Q Robusta Graders, formerly known as R-Graders, are skilled, credible Robusta coffee
cuppers certified by the Coffee Quality Institute (CQI).
Table 1: Averages of the sensory attribute acidity evaluated in three fermentation times and four processes.
Sensory Variable Salt/Acid
Process Fermentation Time (h) Mean
24 48 72
1-Washed 7.48 a 7.42 ab 7.20 a 7.36 ab
2-Yeast fermentation 7.36 a 7.30 ab 7.45 a 7.37 ab
3-Fully washed without yeast 7.43 a 7.18 b 7.25 a 7.29 b 4-Fully washed with yeast 7.57 a 7.53 a 7.39 a 7.49 a
Mean 7.46 7.36 7.32 7.38
Standard diversion - 0.193781 Coefficient of variation 2.63%
1 Means followed by at least one repeated letter vertically do not differ
from each other by the Tukey test at 5% probability.
The data of the variable acidity indicated that for 24 and 72 hours of fermentation, the treatments did not show statistical differences between themselves by the Tukey test at 5% of significance. In the fermentation time of 48 hours, treatment 4 is superior to treatment 3 but does not differ from the other treatments by the Tukey test at 5% of significance. The same behavior was observed on the mean values for acidity.
Low-quality coffee is associated with high acidity indexes, mainly due to harmful fermentation (Mazzafera, 1999). There is a direct relationship between the increase of acidity and the reduction of coffee quality. However, the results of this study indicate that increased acidity is perceived as a positive factor for Q-Graders.
This fact suggests that the metabolic processes generated during the yeast-induced fermentation phase had a significant effect on the production of some compounds that provide a higher acidity load to coffee. The use of yeasts (Saccharomyces cerevisiae) improves the acidity of coffees (Ribeiro et al., 2017). These results reinforce the discussion about fermentation, considering that desirable attributes can be optimized during wet processing (Lee et al., 2015).
The absence of experimental control can be a factor that contributes to the existence of different positions regarding acidity. The understanding that microorganisms can produce compounds that give acidity and that it can migrate to the grain is common to the scientific community (Nguyen; Byun, 2013); (De Bruyn et al., 2017).
The components responsible for coffee acidity (phosphoric acid, chlorogenic acids, quinic acid) generate information at the molecular level that can be captured in infrared spectra in the medium region. The infrared spectra of the coffee samples, after treated, are shown in Figure 1. There are numerous absorption bands in the FTIR-ATR spectra of the coffees. Some of which are more significant, such as bands related to C—O (1300-1000 cm-1) and O—H (mainly
in the 3650-3100 cm-1 region) present in carboxylic acids and
alcohols (that appear in sugar molecules in the coffee), and
C—H bond (2840-3350 cm-1) present in virtually all coffee
compounds, since they are organic compounds, among others. The FTIR-ATR spectra were used to estimate the acidity scores of the coffees (sensory values attributed to acidity by the cuppers, shown in Table 1) using the PLS regression method (Figure 2). The 34 samples were divided into subsets: calibration and prediction, using the Kennard-stone method, where approximately 70% of the samples were previously selected for the calibration set, while the remaining 30% were for the prediction set.
The choice of the spectral range used to construct the PLS models was based on the regions of greater variance after the analysis of the original data. Such range lies within the interval of 4000 to 2750 cm-1 (Lopes; Fascio, 2004), corresponds to
O—H stretches present in alcohols and carboxylic acids, N—H of amines and amides, in addition to C—H stretches present in hydrocarbons. This variance is due to the different compositions obtained for the samples after the four treatments applied at three different periods. Amines are nitrogenous organic bases that serve as important indicators of quality in a wide variety of food products, these organic compounds are usually formed by free amino acid decarboxylation as a consequence of physical-chemical, and biochemical processes that take place during coffee bean processing (Kurniawan et al., 2017). Thus, this
Figure 1: Pretreated Infrared spectra of the coffee samples.
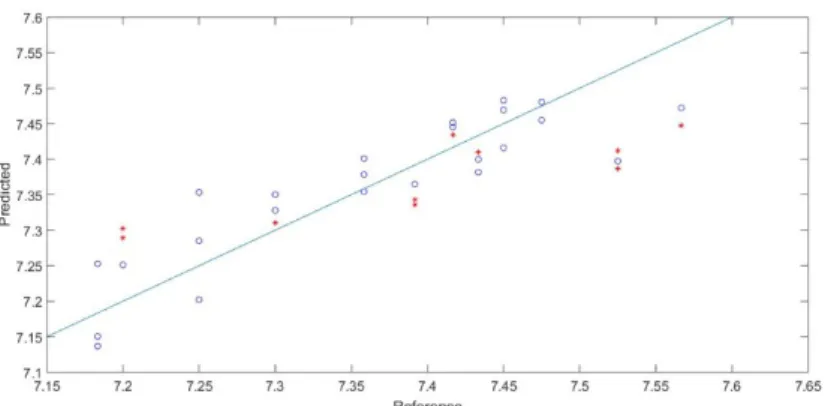
Figure 2: Relation between reference (o) and predicted (*) values of the score for the sensory attribute acidity of the coffee samples.
result suggests that the fermentation process applied resulted in the chemical change, which reflected in the sensory aspect of the coffee, according to results observed by (Evangelista et al., 2014a; Evangelista et al., 2014b; Pereira et al., 2015; Ribeiro et al., 2014).
The results for the best PLS models are presented in Table 2, where the most accurate model is highlighted in bold. RMSEC (Root Mean Square Error of Calibration) and RMSEP (Root Mean Square Error of Prediction) correspond to the mean errors of calibration and prediction, respectively.
the PLS model for the 10 samples from the prediction set are shown on Table 3.
Figure 3: Graphic of the weight of the variables (VIP) in the constructed PLS model.
Table 2: Results of the PLS models in determining the sensory attribute Coffee Acidity.
Preprocessing Statistical Parameters
VL RMSEC R2
calibrationRMSECV RMSEP R2prediction
MSC 3 0.07 0.6591 0.09 0.14 0.3128
Derivative 5 0.01 0.9877 0.08 0,16 0.4915
Derivative 4 0.03 0.9370 0.09 0.14 0.5336
Derivative 3 0.06 0.7837 0.09 0.11 0.7566
For the highlighted model, the relationship between the values predicted by the PLS regression method and those determined by the Uganda Coffee Development Authority (UCDA, 2010), for the calibration samples and the test samples, can be observed in Figure 2. The diagonal line represents the identity curve, the closer a sample is to this line the better its estimate. There is a fine concordance between the reference values and those predicted by the PLS model with a coefficient of determination above 0.75 (Table 2, preprocessing using the derivative with 3 latent variables) and accuracy of 0.06 and 0.11 for the data of the calibration and prediction sets, respectively.
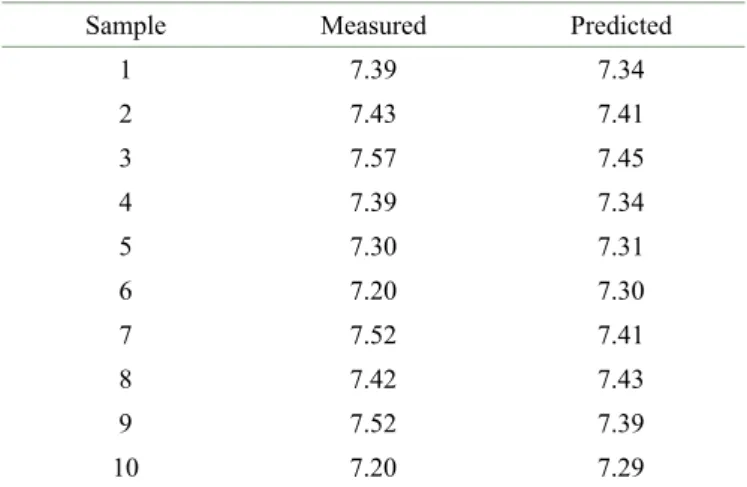
The residuals of the models did not present evidence of the presence of systematic errors or tendency to the level of significance of 5% (T-Test) (Filgueiras et al., 2014). The values provided by the experts compared to those predicted by
Table 3: Values measured by the specialists and values predicted by the regression model.
Sample Measured Predicted
1 7.39 7.34 2 7.43 7.41 3 7.57 7.45 4 7.39 7.34 5 7.30 7.31 6 7.20 7.30 7 7.52 7.41 8 7.42 7.43 9 7.52 7.39 10 7.20 7.29
The method used as a reference for coffee evaluation does not present a numerical error, thus reinforcing the need for new methods that can bring more reliability to this evaluation, functioning as an auxiliary tool. Infrared spectroscopy combined with chemometrics proved to be effective due to the low error (0.11) for the acidity score.
The most significant variables in the construction of the PLS model are highlighted in Figure 3, where the VIP values of the spectral variables are found. In this graph, the higher the VIP value of a variable, the greater its importance in the construction of the PLS model.
The spectral band of 3000 to 2840 cm-1 shows
absorptions relative to symmetric and asymmetric stretches of the C—H bond of alkyl groups. The band of 3200 to 2400 cm-1 shows absorptions of O—H stretches present
in carboxylic acids, the range of 3650 to 3600 cm-1 shows
bands referring to O—H stretches of alcohols, which may be present in coffee sugars (Pavia et al., 2001; Silverstein; Webster; Kiemle, 2005).
The acidity of coffee is due to phosphoric acid, chlorogenic acids, quinic acid, and organic aliphatic acids present in roasted coffee. It was possible to observe in the bands mentioned above, absorptions that have their origin in the bonds present in the organic acids (O—H and C—H) (Ribeiro; Ferreira; Salva, 2011). Furthermore, the perceived acidity depends on the final quantity of acids present (and further extracted), which is mainly related to the roasting degree (Santos et al., 2016). Although it is not clear which compounds are responsible for the perceived acidity, it is known that citric, malic, acetic, quinic, and mainly chlorogenic acids, are the most abundant acid species in coffee beans and may be responsible for this organoleptic characteristic (Balzer, 2001).
The influence of the chlorogenic acids can be justified by the possible decomposition that occurs during the roasting process and the decomposition of compounds that affect coffee acidity. These catabolic processes of organic substances oxidation, especially sugars, which are transformed into energy and simpler compounds, such as ethanol, acetic acid, lactic acid, and butyric acid, are caused by bacteria and yeasts and are the result of fermentation dependent on the set of bacteria and yeasts present during the processing stages (Quintero; Mejía; Betancur, 2012).
The results highlight the potential of the creation of sensory routes for robusta coffees through fermentation induction with microbial culture. The sensory potential and prediction potential of process optimization from chemometric treatments were evidenced.
4 CONCLUSIONS
Sensorial results indicated a higher score for the acidity attribute, in dry fermentation with yeast at the time of 48 hours, indicating that the induced fermentation can act in the construction of sensory routes, becoming a new strategy for the production of quality robusta coffee.
The study indicates that it is possible to estimate the score of the sensory attribute acidity of the robusta coffee submitted to different processes and fermentation times using infrared spectra in the medium region associated with the PLS regression. The selected band (2800 to 4000 cm-1) was able
to capture the information related to the acidity attribute. The proposed methodology presents a mean error of 0.11in the acidity score, being considered an acceptable value for this sensory analysis.
The considerable stability of the models allowed us to establish a correlation between the chosen spectral region and the sensory attribute acidity, since it is a chemical property with direct influence on the spectral profile, due to the presence of chlorogenic acids.
5 ACKNOWLEDGEMENTS
The authors would like to thank the National Council of Technological and Scientific Development (CNPq) for the development of resources for this research, and thank the Federal Institute of Espírito Santo for providing support to develop the scientific research – public call (N°10/2019 - Programa pesquisador de produtividade – PPP) and the Federal University of Espírito Santo for their support in this project.
6 REFERENCES
ALONSO-SALCES, R. M. et al. Botanical and geographical characterization of green coffee (Coffea arabica and Coffea canephora): Chemometric evaluation of phenolic and methylxanthine contents. Journal of Agricultural
and Food Chemistry, 57(10):4224-4235, 2009.
BALZER, H. H. Acids in coffee. In: CLARKE, R. J.; VITZTHUM, O. G. (Ed.). Coffee. Recent developments. Oxford: Blackwell Science, 18-30, 2001.
BHUMIRATANA, N.; ADHIKARI, K.; CHAMBERS, E. Evolution of sensory aroma attributes from coffee beans to brewed coffee. LWT - Food Science and Technology, 44(10):2185-2192, 2011.
CARRERA, F. et al. Authentication of green coffee varieties according to their sterolic profile. Analytica Chimica
Acta, 370:131-139, 1998.
CASTRO, R. D. de.; MARRACCINI, P. Cytology , biochemistry and molecular changes during coffee fruit development. Brazilian Journal of Plant Physiology, 18:175-199, 2006.
COMPANHIA NACIONAL DE ABASTECIMENTO - CONAB. Primeiro Levantamento de Safra. 6: 2018-2019, n1. Available in: <https://www.conab.gov.br/info-agro/safras/cafe/boletim-da-safra-de-cafe>. Access in: November 29, 2018.
CORREIA, R. M. et al. Portable near infrared spectroscopy applied to quality control of Brazilian coffee. Talanta, 176:59-68, 2018.
DA SILVA, T. J. H. et al. Potential markers of coffee genotypes grown in different Brazilian regions: A metabolomics approach. Food Research International, 61:75-82, 2014.
DE BRUYN, F. et al. Exploring the impacts of postharvest processing on the microbiota and metabolite profiles during green coffee bean production. Applied and
PEREIRA, G. V. M. et al. Conducting starter culture-controlled fermentations of coffee beans during on-farmwet processing: Growth, metabolic analyses and sensorial effects. Food Research International, 75:348-356, 2015.
DI DONFRANCESCO, B.; GUTIERREZ GUZMAN, N.; CHAMBERS, E. Comparison of results from cupping and descriptive sensory analysis of colombian brewed coffee.
Journal of Sensory Studies, 29(4):4301-311, 2014.
EVANGELISTA, S. R. et al. Inoculation of starter cultures in a semi-dry coffee (Coffea arabica) fermentation process.
Food Microbiology, 44:87-95, 2014a.
EVANGELISTA, S. R. et al. Improvement of coffee beverage quality by using selected yeasts strains during the fermentation in dry process. Food Research
International, 61:183-195, 2014b.
FILGUEIRAS, P. R. et al. Chemometrics and intelligent laboratory systems evaluation of trends in residuals of multivariate calibration models by permutation test.
Chemometrics and Intelligent Laboratory Systems,
133:33-41, 2014.
JOËT, T. et al. Influence of environmental factors, wet processing and their interactions on the biochemical composition of green Arabica coffee beans. Food
Chemistry, 118:693-701, 2010.
KURNIAWAN, M. F. et al. Metabolomic approach for understanding phenolic compounds and melanoidin roles on antioxidant activity of Indonesia robusta and arabica coffee extracts. Food Science and Biotechnology, 26(6):1475-1480, 2017.
LEE, L. W. et al. Coffee fermentation and flavor – An intricate and delicate relationship. Food Chemistry, 185:182-191, 2015.
LIU, P. et al. Sensory characteristics and antioxidant activities of maillard reaction products from soy protein hydrolysates with different molecular weight distribution.
Food and Bioprocess Technology, 5:1775-1789, 2012.
LOPES, W. A.; FASCIO, M. Esquema para interpretação de espectros de substâncias orgânicas na região do infravermelho. Química Nova, 27(4):670-673, 2004. MASSAWE, G. A.; LIFA, S. J. Yeasts and lactic acid bacteria
coffee fermentation starter cultures. International
Journal Postharvest Technology and Innovation,
2(1):41-82, 2010.
MAZZAFERA, P. Chemical composition of defective coffee beans. Food Chemistry, 64:547-554, 1999.
NGUYEN, T. N. H.; BYUN, S. Y. Combined changes of process conditions improved aromatic properties of Vietnamese Robusta. Biotechnology and Bioprocess
Engineering, 18(2):248-256, 2013.
PAVIA, D. L.; LAMPMAN, G. M.; KRIZ, G. S.
Introduction to Spectroscopy. 3rd. ed. Orlando, USA:
Thomson Learning, p.32-65, 2001.
PEREIRA, G. V. M. de et al. Isolation, selection and evaluation of yeasts for use in fermentation of coffee beans by the wet process. International Journal of Food
Microbiology, 188:60-66, 2014.
PEREIRA, L. L. et al. Influence of solar radiation and wet processing on the final quality of arabica coffee. Journal
of Food Quality, Special Issue, Article ID 6408571, 2018.
PORTELA, N. A. et al. Quantification of biodiesel in petroleum diesel by 1 H NMR: Evaluation of univariate and multivariate approaches. Fuel, 166:12-18, 2016. PEREIRA, L. L. et al. Propositions on the optimal number
of Q-Graders and R-Graders. Journal of Food Quality, 2018 (Special Issue):1-11, 2018.
QUINTERO, G. I. P.; MEJÍA, J. M.; BETANCUR, G. A. O. Microbiología de la fermentación del mucílago de café según su madurez y selección. Cenicafé, 63(2):58-78, 2012.
RIBEIRO, B. B. et al. Avaliação química e sensorial de blends de Coffea canephora Pierre e Coffea arabica L.
Coffee Science, 9(2):178-186, 2014.
RIBEIRO, J. S.; FERREIRA, M. M. C.; SALVA, T. J. G. Chemometric models for the quantitative descriptive sensory analysis of Arabica coffee beverages using near infrared spectroscopy. Talanta, 83(5):1352-1358, 2011. RIBEIRO, L. S. et al. Controlled fermentation of semi-dry
coffee (Coffea arabica) using starter cultures: A sensory perspective. LWT - Food Science and Technology, 82:32-38, 2017.
SANTOS, J. R. et al. Exploiting near infrared spectroscopy as an analytical tool for on-line monitoring of acidity during coffee roasting. Food Control, 60:408-415, 2016. SPECIALTY COFFEE ASSOCIATION - SCA. Protocols.
January, 23, 2015. Available in: <http://www.scaa.org/ PDF/resources/cupping-protocols.pdf>. Acess in: May 20, 2019.
SEO, H. S.; LEE, S. Y.; HWANG, I. Development of sensory attribute pool of brewed coffee. Journal of Sensory
SILVA, C. F. et al. Succession of bacterial and fungal communities during natural coffee (Coffea arabica) fermentation. Food Microbiology journal, 25(8):951-957, 2008.
SILVA, C. F.; BATISTA, L. R.; SCHWAN, R. F. Incidence and distribution of filamentous fungi during fermentation, drying and storage of coffee (Coffea Arabica L.) beans.
Brazilian Journal of Microbiology, 39(3):521-526, 2008.
SILVERSTEIN, R. M.; WEBSTER, F. X.; KIEMLE, D. J.
Spectrometric Identification of Organic Compounds. 7th.
ed. New York, USA: John Wiley & Sons, INC, 82-95, 2005. TFOUNI, S. A. V. et al. Effect of roasting on chlorogenic
acids, caffeine and polycyclic aromatic hydrocarbons levels in two Coffea cultivars: Coffea arabica cv. Catuaí Amarelo IAC-62 and Coffea canephora cv. Apoatã IAC-2258. International Journal of Food Science &
Technology, 47(2):406-415, 2012.
UGANDA COFFEE DEVELOPMENT AUTHORITY - UCDA. Robusta Cupping Protocol. 2010. Available in: < https://ugandacoffee.go.ug/sites/default/files/Resource_ center/UCDA%20Annual%20Report_2011-2012_0.pdf>. Access in: June 20, 2019.
UNITED STATES DEPARTMENT OF AGRICULTURE. USDA. Coffee: World Markets and Trade. Foreign Agricultural Service June 2017. Available in: <https:// apps.fas.usda.gov/psdonline/circulars/coffee.pdf>. Access in June 05, 2017.
VAAST, P. et al. Fruit thinning and shade improve bean characteristics and beverage quality of coffee (Coffea arabica L.) under optimal conditions. Journal of the
Science of Food and Agriculture, 86(2):197-204,
2006.
VELMOUROUGANE, K. Impact of natural fermentation on physicochemical, microbiological and cup quality characteristics of aArabica and Robusta Coffee.
Proceedings of the National Academy of Sciences,
83:233-239, 2013.
WEI, F. et al. Complex mixture analysis of organic compounds in green coffee bean extract by
two-dimensional NMR spectroscopy. Magnetic Resonance in
Chemistry, 48(11):857-865, 2010.
WEI, F. et al. A pilot study of NMR-based sensory prediction of roasted coffee bean extracts. Food Chemistry, 152:363-369, 2014.