(1) Universidade Federal de Santa Maria – UFSM, Santa Maria, Rio Grande do Sul, Brasil.
(2) Universidade Federal do Rio Grande do Sul – UFRGS, Porto Alegre, Rio Grande do Sul, Brasil.
(3) Universidade Federal de São Paulo – UNIFESP, São Paulo, São Paulo, Brasil. This work was performed at Universidade Federal de São Paulo – UNIFESP – São Paulo, São Paulo, Brasil.
Conflict of interests: Nonexistent
Visual Reinforcement Audiometry and
Steady-State Auditory Evoked Potential in infants with
and without conductive impairment
Michele Vargas Garcia(1)
Dayane Domeneghini Didoné(2)
José Ricardo Gurgel Testa(3)
Rúbia Soares Bruno(1)
Marisa Frasson de Azevedo(3)
Received on: August 8, 2017 Accepted on: May 7, 2018
Mailing address: Rúbia Soares Bruno
Rua: Duque de Caxias, 975, Apartamento 70
CEP: 97010200 - Santa Maria, Rio Grande do Sul, Brasil
ABSTRACT
Purpose: to compare the findings of minimum levels of answers through air and bone
conductions between the Visual Reinforcement Audiometry and the Steady-State Auditory Evoked Potential in infants from six to twelve months, with and without con-ductive disorder.
Methods: sixty children aged six to twelve months were evaluated, 30 presenting
con-ductive disorder, and 30 not presenting it. Children with malformation in the external auditory meatus with neurological alteration and / or genetic syndrome were excluded, as well as patients with sensorineural or mixed hearing loss. The infants were subjec-ted to Visual Reinforcement Audiometry and Steady-State Auditory Evoked Potential evaluation through air and bone conduction on the same day. The results of both assessments were compared and correlated.
Results: in the comparison through air conduction, for the group without conductive
disorder of the medium ear, the minimum levels of response for 500 and 1000Hz were lower (better thresholds) for Steady-State Auditory Evoked Potential in both ears, and through bone conduction were very similar in all frequencies. Concerning the infants that present conductive disorder, the responses through air conduction were better in all frequencies evaluated when obtained via Steady-State Auditory Evoked Potential test. Through bone conduction, the results were very similar for both groups.
Conclusion: it was possible to compare the findings to the minimum levels of response
through air and bone conductions between the Visual Reinforcement Audiometry and the Steady-State Auditory Evoked Potential, being that the comparison for bone con-duction in both groups presents an equivalence in the results, being very similar. In addition, for the air conduction, in the control group, there was proximity of responses of some frequencies, while the values for the Steady-State Auditory Evoked Potential test were better than the behavioral responses in the conductive disorder group.
Keywords: Evoked Potentials, Auditory; Auditory Perception; Early Diagnosis; Middle
INTRODUCTION
During the last years the advances in the audio-logical diagnosis of children have allowed the early
identification of the auditory alterations of young children and of difficult behavioral testing. In these
evaluations it is necessary to verify if there is auditory alteration, the type of alteration and the degree of the same, being indispensable to differentiate conductive hearing losses of sensorineural and to determine the thresholds by air and bone pathways.
Conductive hearing loss is common in infants, otitis media being one of the most common of the childhood diseases, which consists of infection of the middle ear caused by infection, depression of the immune state, dysfunctions in the auditory tube, allergies and environ-mental problems1. Acoustic immittance measurements are fundamental in the identification of these alterations,
however they do not quantify the degree of hearing loss2. Thus, the audiological evaluation with
behav-ioral, electrophysiological and electroacoustic methods added to the otorhinolaryngological evaluation must be
precise in the identification of such pathology, in order
to avoid damages in the linguistic and auditory devel-opment of the child.
Visual Reinforcement Audiometry (VRA)3 is one
of the main behavioral techniques for evaluating auditory sensitivity in young children. This procedure has as principle the conditioning of the child with sound stimulus associated to a light signal, and at the moment the child searches for the sound source, the examiner offers a visual stimulus as reinforcement4.
When performed by air pathway (with earphones) and by bone pathway (with vibrator), this method assists
in the identification of conductive alterations (in the
presence of air - bone gap), however its performance, both by air and by bone is only reliable after six months of life5, requiring the principle of cross-check with
other methods of evaluation such as Auditory Evoked
Potentials (AEP) by specific frequency to complete the
audiological diagnosis.
Electrophysiological methods are fundamental as complementary measures being the main choice in obtaining auditory thresholds in children less than six months of age. Stable State Auditory Evoked Potential (ASSR) has been described as a promising technique in obtaining auditory electrophysiological thresholds,
providing greater ease and efficiency to obtain answers,
objectivity in the analysis of the records, with frequency
specificity, and greater possibility of detection of
auditory responses than other methods, such as pure
tone audiometry6. Some authors7 describe a correlation
between the minimum levels of responses obtained
in the ASSR with behavioral thresholds, benefiting
young children who do not cooperate in the behavioral assessment.
The ASSR can be searched by air and bone pathways, and it is possible to determine the presence and magnitude of conductive impairment by means of the difference between the minimum levels of air-bone response, which makes it a useful tool in the assessment of conductive impairment, one of the main pathologies in infants5.
The ASSR becomes an important instrument of audiological investigation because it is one of the main
evaluation techniques in the identification of hearing
loss, being conductive, mixed or sensorineural, of children under six months of age. Comparison of the minimum levels of air pathway and bone pathway responses with behavioral assessment also in children older than six months with and without conductive impairment, whose behavioral evaluation is feasible, is necessary in order to obtain parameters for comparison of both evaluations.
Thus, the ASSR can be used reliably in the audio-logical diagnosis of young children who do not cooperate in the behavioral evaluation, facilitating the
identification and quantification of auditory alterations,
as in the case of otitis media.
Based on the above, the objective of this study
was to compare the findings for the minimum levels
of air and bone pathways response between Visual Enhancement Audiometry and ASSR in children aged six to 12 months, with and without conductive impairment.
METHODS
This study was approved by the Research Ethics Committee of the Universidade Federal de São Paulo
- UNIFESP, Research protocol number 1191/10. All
the parents of the children involved allowed the partici-pation of their children in the research and results divul-gation by means of signature of a free and informed consent term.
Initially, the children underwent otorhinolaryn -gological evaluation, acoustic immittance measure-ments (tympanometry) and transient stimulus evoked otoacoustic emissions (TEOAE).
Otoscopy was performed by an experienced
otolar-yngologist and was classified as normal (no change)
or altered (retracted, hyperemic, opaque, perforated, bulging).
The tympanometry was performed using the
Mean Ear Analyzer ImpedanceAudiometer- AT235h- Interacoustics, with a test tone of 226Hz. The tympa
-nometric curves were classified according to Jerger
(1970)8 and Carvallo (1992)9 in: Curve Type A - single
admittance peak between -150 and + 100 daPa and volume of 0.2 to 1.8 ml; Curve type D- double peak curve; Asymmetric curve - peak at high positive pressure; Curve Type C-peak admittance shifted to
negative pressure; Inverted curve (I) - with inverted configuration in relation to the normal curve; Curve type B-flat curve without admittance peak.
The TEOAEs were searched using the ILO
96-Otoacoustic Emission Analyzer, using the “Quickscreen” program. TEOAEs were considered to be present when the signal to noise ratio per frequency
band was ≥ 3 dB for 1500Hz and ≥ 6 dB for 2000Hz, 3000Hz and 4000Hz with general reproducibility ≥ 50% and probe stability ≥70%.
Only children whose otorhinolaryngological evalu-ation was compatible with tympanometry were included in the study. That is, when there was normal tympa-nometry (tympanometric curve type A) and normality
according to the evaluation of the ORL or alteration of
the middle ear (type B tympanometric curve) and
alter-ation according to the evalualter-ation of the ORL.
Also, for the inclusion of children in the group with conductive impairment, they should have type B tympa-nometric curve and altered Otorhinolaryngological evaluation, and for inclusion of children in the group without conductive impairment, they should have type A tympanometric curve and normal Otorhinolaryngological evaluation. Bilateral conductive hearing loss was considered as moderate to moderate. For the children in the control group, TEOAEs should be present, that is, the response that the child passed should be observed in the equipment.
Children with malformation in the external auditory meatus, with neurological alteration and / or genetic syndrome, as well as those with sensorineural or mixed hearing loss were excluded. The exclusion of children with sensorineural or mixed hearing loss was
made through the analysis of the medical record, which included information from other audiological assessments performed with the child, such as the
Auditory Evoked Potential of Brainstem by specific frequency (BAEP-FE). In addition, bone values greater
than 30 dBNA in VRA and ASSR were also considered suspected of cochlear alteration, with children being excluded from the study.
In addition to the otorhinolaryngological evalu -ation procedures, acoustic immittance measures and TEOAE, all children were submitted to the investigation of the electrophysiological thresholds by air and bone pathways through the ASSR and the minimum levels of responses by air and bone pathways via VRA. The order of the procedures was random, according to the behavioral state of the child, whether in sleep or alert.
The ASSR was searched through the Intelligent Hearing System’s Smart EP equipment by air (with EAR
Tone 3A insertion earphones) and by bone route (bone vibrator model B71). Such procedure was performed with the child in natural sleep in the lap of the parents or
guardians. The electrodes were fixed at positions M1,
Fz and M2: (-) ear tested, (+) forehead, and (ear) ear not tested. The impedance of the electrodes remained
below 3 kHz. To test the bone pathway, the researcher
held the bone vibrator in the mastoid holding it pressed. This method was recommended by Small and Stapells (2007) and it was the most stable method to keep the vibrator in the same position throughout the evaluation.
The carrier frequencies evaluated were 500, 1000,
2000 and 4000Hz, and the modulator frequencies were 77, 85, 93 and 101 Hz for the left ear and 79, 87, 95, 103 Hz for the right ear. The type of modulation used was modulated by amplitude (AM) at 100%. A 100,000-fold amplification was used with 30Hz high pass filters and 300Hz low pass filters. The presentation of the stimuli
was ipsilateral, with 400 stimuli for each intensity, being presented in descending mode, with an initial intensity of 60 dB NPS by air and 50 dB NPS for a bone path with a variation of 10 dB NPS, in order to detect the minimum level of electrophysiological response. The responses were considered as present when the signal-to-noise ratio was greater or equal to 6.13dB for each frequency and in each intensity investigated,
p-value being considered statistically significant when p≤0.05. Signal-to-noise ratios below 6.13 dB did not
show present responses because the noise interfered in the responses.
In these cases, the children were retested and in the
The stimuli were presented in descending order of intensity and using the stimulus-response-visual reinforcement conditioning. The procedure was performed only in one ear, to avoid the fatigue of the
children and reliability of the answers. It was considered
as a response to the lowest intensity in which the child, after the conditioning period, turned his head towards the sound stimulus, presenting as a reinforcement a visual stimulus of a luminous clown. The bone marrow parameters were the same as those used by air.
The masking was not used considering the time of evaluation of the children, becoming the result of
tympanometry the confirmation of the existence of
conductive factor in both ears.
The minimum levels of ASSR and VRA responses by air and bone pathways were compared to each other in
each group using the Mann-Whitney U-Test and confi
-dence interval for the mean. In addition, the Spearman correlation test was performed. In all statistical tests, the null hypothesis was rejected when the confidence interval was equal to or less than 5%, being significant p ≤0.05.
RESULTS
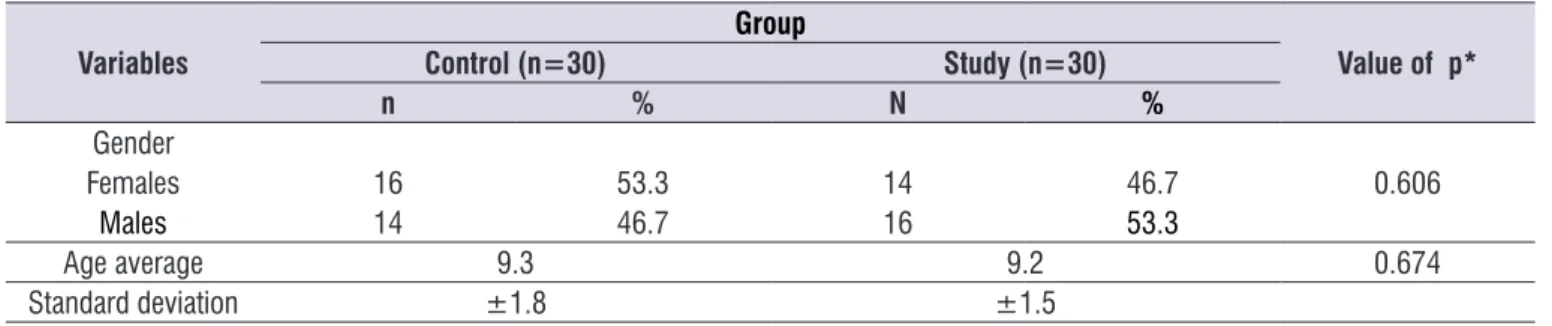
Sixty children of both genders participated in the study, 30 of the control group and 30 of the study group. The groups presented a similar distribution in relation to gender and age, with no statistically signif-icant differences (Table 1).
The noise level was controlled throughout the
evalu-ation, considering below 0.06μV for the responses
considered present.
By air the responses of the ASSR were searched in both ears simultaneously and by bone route was captured only of the left ear (choice of side was
random). It is important to note that the minimum
response levels were performed in dBNPS, and the results were converted to dBNA, according to the equipment conversion table. The conversion table was performed biologically, using tests of adult individuals.
NPS to NA by air: from 26dB to 500Hz, 11dB to 1000Hz, 13dB to 2000Hz and 19dB to 4000Hz. The bone conversion values were: 65dB for 500Hz, 45dB for 1000Hz, 35dB for 2000Hz and 40dB for 4000Hz.
The mean time for performing the simultaneous and one-way bone pathway was one and a half hours.
Visual enhancement audiometry by air was performed only in the left ear (with supra-aural
earphones model TDH39) and bone pathway (vibrator
in the left mastoid model B71). The choice of the side evaluated for VRA was random, in order to avoid fatigue and compromise of responses. The children were placed in the lap of the parents or guardians, remaining in a state of alert during the evaluation. Pure tones were modulated in frequency (warble), in 500, 1000, 2000
and 4000Hz. The assessment was performed with the
visual reinforcement positioned at approximately 90° azimuth, to the child’s left, at a distance of approxi-mately 50 cm.
Table 1. Characterization of the studied sample
Variables
Group
Value of p*
Control (n=30) Study (n=30)
n % N %
Gender
Females 16 53.3 14 46.7 0.606
Males 14 46.7 16 53.3
Age average 9.3 9.2 0.674
Standard deviation ±1.8 ±1.5
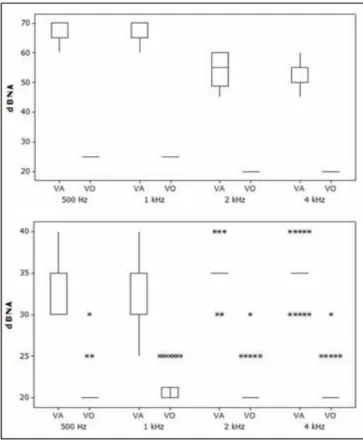
Figure 1 shows the minimum levels of air and bone pathways ASSR responses in both groups and Figure 2 shows the minimum levels of air and bone pathways responses in both groups.
Subtitle: VA = AP = (Air Pathway); VO = BP (Bone Pathway)
Figure 1. Minimum levels of airway / bone visual auditory audiometry responses in the control and study groups, respectively
Subtitle: VA = AP = (Air Pathway); VO = BP (Bone Pathway)
Figure 2. Minimum levels of airway / bone steady state auditory evoked potential responses in the control and study groups, respectively
Table 2 shows the comparison between the AP values for the left ear VRA and the ARPA of the left ear in both groups. The p-value refers to the comparison between the value of the left ear ASSR and the VRA.
Table 2. Comparison between the results of the minimum response levels of visual reinforcement audiometry and airway steady state auditory evoked potential in both groups
VRA AP LE ASSR AP LE (dBNA)
Mean Median ST p-value Mean Median ST p-value
Study Group n= (30)
500 Hz 66.5 65 3.3 - x - 51.1 54 5.2 <0.001
1 kHz 66 65 3.1 - x - 53 57 7.5 <0.001
2 kHz 53.2 55 5.9 - x - 35.5 37 8 <0.001
4 kHz 53 55 4.1 - x - 38.7 41 4.1 <0.001
Control Group n= (30)
500 Hz 33.3 35 3.3 - x - 16.2 14 3.1 <0.001
1 kHz 32.5 35 3.9 - x - 26.5 24 2.9 <0.001
2 kHz 35.2 35 2.1 - x - 23.3 22 2.9 x
-4 kHz 35 35 2.9 - x - 24 26 3.9 x
VRA and ASSR, since there were equal between them, and it was not possible to analyze statistically.
In Table 3, the results of the VRA and the AEPS by
bone route are described in both groups. The values of BP in the study group were not compared between
Table 3. Results of minimum bone-level response levels of visual reinforcement audiometry and steady state auditory evoked potential of
both groups
Study Group (n=30)
Control Group (n=30)
Mean Median Standard
Deviation Mean Median
Standard Deviation
ARVVO LE
500 Hz 25 25 0 20.7 20 2.2
1 kHz 25 25 0 21.2 20 2.2
2 kHz 20 20 0 21.2 20 2.5
4 kHz 20 20 0 21.2 20 2.5
ASSR BP dBNA – LE
500 Hz 25 25 0 18.8 10 2.2
1 kHz 25 25 0 20 20 0
2 kHz 20 20 0 20 20 0
4 kHz 20 20 0 20.2 20 0.9
Subtitles – VRA: Visual Reinforcement Audiometry; BP – Bone Pathway; LE: Left Ear; ASSR –Stable State Auditory Evoked Potential; dBNA- decibel level of hearing. NOTE: VO values were not statistically compared between VRA and ASSR, since there is equivalence between them, and it is not possible to analyze statistically.
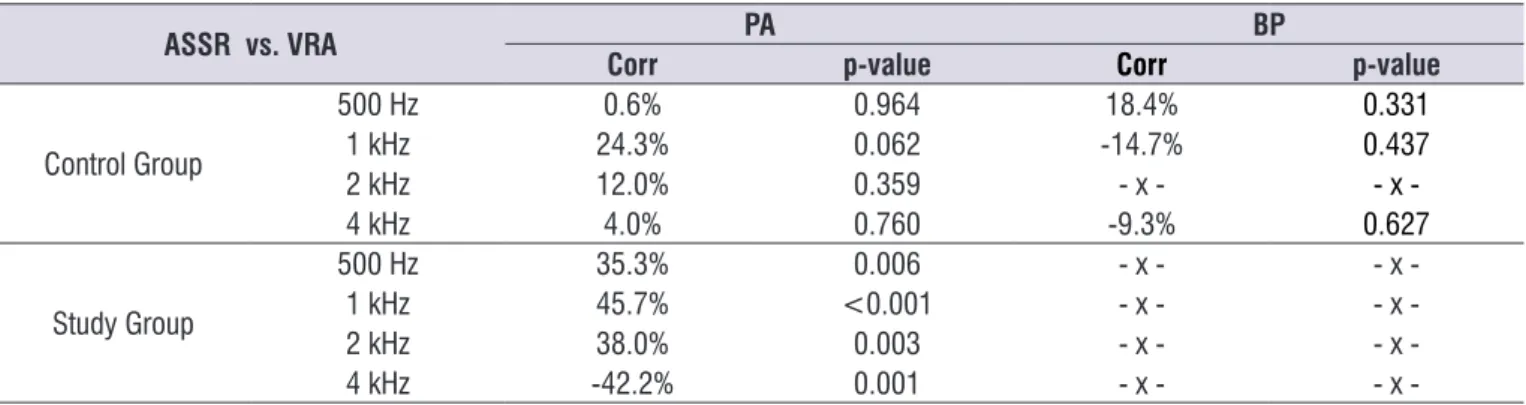
Table 4 describes the correlation between the minimum levels of responses obtained in the VRA with the ASSR by air in both groups. A correlation was observed between the minimum response levels of the
ASSR and VRA in the study group. It is noteworthy that
the correlation test was performed only by air, and in
some frequencies by bone in the control group, due to
the distribution of the values, i.e., the minimum levels
of bone pathway responses were similar for VRA and
ASSR in the study group, preventing statistical analysis.
Table 4. Correlation of the minimum levels of responses obtained between the steady-state auditory evoked potential and the air/ bone-assisted visual audiometry in both groups
ASSR vs. VRA PA BP
Corr p-value Corr p-value
Control Group
500 Hz 0.6% 0.964 18.4% 0.331
1 kHz 24.3% 0.062 -14.7% 0.437
2 kHz 12.0% 0.359 - x - x
-4 kHz 4.0% 0.760 -9.3% 0.627
Study Group
500 Hz 35.3% 0.006 - x - x
-1 kHz 45.7% <0.001 - x - x
-2 kHz 38.0% 0.003 - x - x
-4 kHz -42.2% 0.001 - x - x
20 to 500Hz and 1000Hz and from 30 to 2000Hz and 4000Hz. The predominance of the best thresholds
of the most severe frequencies found in the present study in the control group corroborate with the theory of frequency maturation, with the lowest frequencies
being the first ones to be perceived16.
For the group of children with conductive alteration, the minimum response levels for the ASSR were lower than those found in the behavioral evaluation in the four frequencies evaluated by air, with the differences between electrophysiological and behavioral around 15.4; 13; 17.7 and 14.3 dB for the frequencies of 500,
1000, 2000 and 4000 Hz, respectively (Table 2). Such
results are in line with expectations, since children with conductive disorders respond poorly to
behav-ioral assessment and fluctuate at minimum levels of
response5. In the evaluation by bone, the differences
diminish being practically nonexistent for the four
frequencies. We did not find in the national and inter -national literature studies with conductive alterations in the same age range of the present study comparing
ASSR with VRA by air and bone pathways. However,
the results of the present VO study agree with another research17, in which the authors compared the
behav-ioral evaluation with the electrophysiological evalu-ation by air pathway with adult individuals simulating a conductive hearing loss, with the differences being found of 20 ± 10; 15 ± 8; 11 ± 7; 13 ± 9, for the
frequencies of 500, 1000, 2000 and 4000 Hz.
Another study7 with children and adolescents with
severe and profound sensorineural hearing loss and with descending hearing loss found mean differences in the ASSR threshold and the audiometry threshold between 1.4 and 7.5 dB in the group with descending loss and between -0.40 and -8.5 dB, in the group with severe and profound hearing loss. Such differences, smaller than those obtained in the present study, were expected in view of the fact that adolescents or children with hearing loss respond better in tonal audiometry15
when compared to young children with conductive loss.
In the present study, in the comparison of the ASSR
of the left ear, the air-bone gap of the children with
conductive change was around 26.1dB for 500Hz, 28dB for 1000Hz, 15.5dB for 2000Hz and 17.2 for 4000Hz,
and average for the four frequencies of 21.7 dB consid-ering the best results of the air and bone AEPS (Tables 2 and 3). These results agree with another study5,
with similar methodology, however with a younger age group, in which the authors found air-bone gap
DISCUSSION
In the present study, it was observed that in the
group of children without conductive impairment, the difference of the minimum levels of responses between the behavioral and electrophysiological tests by air was 17.1; 6; 13.2; 11dB for 500, 1000,
2000 and 4000Hz respectively. The VRA values were higher than the ASSR, with a statistically significant difference for 500 and 1000Hz (Table 2). The findings
of this study agree with those of another author10 who
evaluated air pathway hearing in adults and found a difference between electrophysiological and behav-ioral assessment of 14 ± 11, 12 ± 11, 11 ± 8 and 13
± 11 dB for 500, 1000, 2000 and 4000Hz, respectively,
and with another study11, where the differences were
approximately 7.2dB for normal-hearing adult.
The statistically significant difference for the 500 and 1000Hz frequencies in the current study can be justified by the greater difficulty of obtaining these responses in the VRA, due to the greater probability of influence
of environmental noise, even though this situation was controlled during every procedure, and by the
subjec-tivity of such evaluation, which may make it difficult to
obtain the results in the evaluated age group.
In the comparison of VRA and ASSR by bone of the
control group (Tables 3 and 4), the differences were smaller than the same frequencies evaluated by air, being ± 1.9; ± 1.2; ± 1.2; ± 1, and with higher values in the behavioral evaluation. These results disagree with a study10 that found differences of 11 ± 5, 14 ±
8, 9 ± 8 and 10 ± 10 for 500, 1000, 2000 and 4000
Hz in adult individuals. Also, these results disagree with
some researchers12, who describe better results in the
audiometry of children and adolescents, and another study13, with children with normal hearing, where the
results were 7 to 16 dB worse for the ASSR. These
differences in the results of the studies may be justified
by the age group evaluated, as older children and adult individuals respond better in behavioral assess-ments14,15 when compared to infants.
Regarding the ASSR thresholds in the group of children without conductive alteration (Table 3), mean
values were 18.8dB for 500Hz, 20dB for 1000Hz, 20dB for 2000Hz and 20.2dB for 4000Hz. These results
corroborate with another study16 with SSBB in children with normal hearing, where the average thresholds were 14, 20, 26 and 22 dB for the frequencies of 500 to
4000 Hz, respectively, with better results for the lower
frequencies. Another study13, in children with normal
further complications. Therefore, the indispensability of an early diagnosis and evaluation through the bone, in
the identification and treatment of conductive changes
is visible.
CONCLUSION
It was possible to compare the findings for the
minimum levels of air and bone pathways response between Visual Enhancement Audiometry and ASSR, and the comparison for BP in both groups brings an equivalence in the values, which are very similar. Also, for the air pathway, in the control group, there was a greater proximity between the responses, while in the group with conductive impairment the ASSR values were better than the behavioral responses for all the frequencies surveyed.
REFERENCES
1. Minov A, Dazert S. Diseases of the middle ear in
childhood. GMS Curr Top Otorhinolaryngol Head
Neck Surg. 2014;13:1-29. doi: 10.3205/cto000114. eCollection 2014.
2. Carvallo RMM, Sanches SGG. Medidas de imitância
acústica. In: Boéchat EM, Menezes PL, Couto CM,
Frizzo ACF, Scharlach RC, Anastasio ART (Orgs). Tratado de audiologia clínica. 2ed. Rio de Janeiro: Guanabara Koogan; 2015. p. 83-8.
3. Lindén G, Kankkunen A. Visual reinforcement
audiometry. Acta Otolaryngology. 1969;67(2-6):281-92.
4. Beck RMO. Comparação entre respostas auditivas de estado estável e avaliação comportamental em crianças candidatas ao implante coclear. [Tese]. São Paulo (SP): Universidade Federal de São Paulo, Faculdade de Medicina da Universidade de São Paulo; 2015.
5. Garcia MV, Azevedo MF, Biaggio EPV, Didoné DD, Testa JRG. Auditory steady-state responses air and bone conducted in children from zero to six months with and without conductive impairments. Rev. CEFAC. 2014;16(3):699-706.
6. Ferraz OB, Freitas SV, Marchiori LLM. Análise
das respostas obtidas por potenciais evocados auditivos de estado estável em indivíduos normais. Rev Bras Otorrinolaringol. 2002;68(4):480-6.
7. Luiz CBL, Azevedo MF. Auditory steady state
responses in children and adolescents with severe to profound and steeply sloping sensorineural hearing loss. REV. CEFAC. 2014;16(3):699-706. around 20dB for children with conductive impairment.
The authors highlight that the larger air-bone gap for
frequencies of 500 and 1000Hz is expected due to the configuration of conductive hearing loss, a fact also
observed in the present study.
When a correlation test was performed between the minimum response levels of VRA and the ASSR for the control group, it was observed that the correlation
ranged from 0.6% to 24%, and it was not statistically significant. This does not show a good correlation. These findings differ from other studies mentioned in
the literature that found a good correlation between air pathway exams, such as in another study18, where the
correlation was higher than 0.95 for frequencies of 500
to 4KHz, for the same age group of the present study
and other researchers19, who carried out a study with infants and pre-school children, finding an excellent
correlation between VRA and ASSR by air, varying from 0.82, 0.90, 0.83 and 0.83 in the 500, 1000, 2000 and
4000Hz frequencies.
For the study group, there was a correlation between the ASSR and the VRA (Table 4), being statistically
significant. These data corroborate with the literature.
Researchers20 observed a high correlation between the
ASSR and behavioral thresholds throughout the study sample including children with sensorineural hearing loss. Research with children with sensorineural hearing loss demonstrated that, although the mean difference between the ASSR and the behavioral assessment was 8 to 15 dB, being higher for the ASSR, there was a strong correlation between the two procedures21. Thus, the findings of the present study disagree with
the aforementioned studies, and it is believed that because the children in the studied sample presented conductive hearing loss, increasing the differences between the behavioral and electrophysiological evalu-ation due to the greater instability of the responses to the conductive impairment. This means that conductive
impairment makes it difficult to perform by VRA.
For the bone pathway, the correlation can not be calculated in the study group because the values were the same, in the control group there was no
statisti-cally significant difference (Table 4). Few studies were
performed by bone in this age group comparing the two procedures, and when performed16 there was no
analysis of the correlation test.
In view of the innumerable consequences that a
20. Rance G, Ropert R, Symons L, Moody L, Poulis C, Dourlay M et al. Hearing threshold estimation in
infants using auditory steady state responses. J Am Acad Audiol. 2005;16(5):291-300.
21. Han D, Mo L, Liu H, Chen J, Huang L. Threshold
estimation in children using auditory steady-state
responses to multiple simultaneous stimuli. ORL J
Otorhinolaryngol Relat Spec. 2006;68(2):64-8. 8. Jerger J. Clinical experience whith impedance
audiometry. Arch Otolaryng. 1970;92(4):311-24. 9. Carvallo RMM. Medida de imitância acústica em
crianças de zero a oito meses de idade [Tese]. São Paulo (SP): Universidade Federal de São Paulo - Escola Paulista de Medicina; 1992.
10. Lins OG, Picton TW, Boucher BL, Surieux-Smith A, Campagne SC, Moran LM et al. Frequency-specific
audiometry using steady-state responses. Ear
Hear. 1996;17(2):81-96.
11. Komazec Z, Lemajic-Komazec S, Jovic R, Nadj C, Jovancevic L, Savovic S. Comparison between
auditory steady-state responses and purê-tone audiometry. Vojnosanit Pregl. 2010;67(9):761-5.
12. Luiz CBL, Garcia MV, Azevedo MF.
Steady-state auditory evoked potential in children and adolescents. CODAS. 2016;28(3):199-204.
13. Casy KA, Small AS. Comparisons of auditory steady state response and behavioral air conduction and bone conduction thresholds for infants and adults
with normal hearing. Ear Hear. 2014;35(4):423-39. 14. Sleifer P, Gregory L, Ávila ATVD, Wender MH.
Correlação entre os limiares do PEAEE e os limiares da audiometria em adultos normouvintes.
In: 34ª Semana Científica do Hospital de Clínicas
de Porto Alegre; 2014 Set 1-5; Porto Alegre. Clin Biomed Res. 2014;34(Supl.):155.
15. Perez-Abalo MC, Savio G, Torres A, Martin V,
Rodriguez E, Galan L. Steady State response to
multiple amplitude-modulated tones: an optimized
method to test frequency - specific thresholds in
hearing-impaired children and normal – hearing
subjects. Ear Hear. 2001;22(3):200-11.
16. Small SA, Stapells DR. Multiple auditory steady-state response thresholds to bone-conduction stimuli in young infants with normal hearing. Ear
Hear. 2006;27(3):219-28.
17. Dimitrijevic A, John MS, Roon PV, Purcell DW, Adamonis J, Ostroff J et al. Estimating the audiogram using multiple auditory steady-state responses. J Am Acad Audiol. 2002;13(4):205-24. 18. Rance G, Rickards F. Prediction of hearing threshold
in infants using auditory steady-state evoked potentials. J Am Acad Audiol. 2002;13(5)236-45. 19. Stueve MP, O’Rourke CA. Estimation of hearing