Outubro de 2009
Universidade do Minho
Escola de Engenharia
Carlos André de Sousa Riesenberger
Application of the Six Sigma methodology
in customer complaints management
- A case study in the automotive industry
U M in ho |2 00 9 C ar lo s An dr é de S ou sa R ie se nb er ge r A p p li ca ti o n o f th e S ix S ig m a m e th o d o lo g y in c u st o m e r co m p la in ts m a n a g e m e n t A c a se s tu d y in t h e a u to m o ti ve in d u st ry
Mestrado Integrado em Engenharia e Gestão Industrial
Trabalho efectuado sob a orientação do
Prof. Doutor Sérgio Dinis Teixeira de Sousa
Outubro de 2009
Universidade do Minho
Escola de Engenharia
Carlos André de Sousa Riesenberger
Application of the Six Sigma methodology
in customer complaints management
- A case study in the automotive industry
É AUTORIZADA A REPRODUÇÃO PARCIAL DESTA TESE APENAS PARA EFEITOS
DE INVESTIGAÇÃO, MEDIANTE DECLARAÇÃO ESCRITA DO INTERESSADO, QUE A TAL SE COMPROMETE;
Universidade do Minho, ___/___/______
v
ABSTRACT
Every day goods are purchased. Unfortunately, sometimes goods do not correspond to the performance expected by the customer, originating complaints. On the other hand, recovery after the service has failed can make customers more satisfied and loyal, than if the failure did not happen at all. Customer complaints occur and are important, even though many companies make all sorts of efforts to reduce them.
The purpose of this thesis is to identify the variables influencing the customer complaint treatment process throughout a case study and improve this process in a solid and repeatable way. Completing the objectives could culminate in the possibility to apply the results to other complaint management system in other organisations, mainly in the automotive branch.
Customer satisfaction is vital for an organisation, but it is a complex process, therefore solutions are not obvious. By selecting the Six Sigma methodology it was provided an organized structure of problem analysis and problem solving, in order to improve the process until a defined six sigma level and to provide a solid level of customer satisfaction, which is vital for an organization.
The problem demonstrated in the case study about complaints treatment deals with the quickness and quality of the replies to the customer and of the investigations made. In industries, the tendency is to have more focus on production and less on customer service.
Six Sigma changed the role of each person involved towards efficient actions in problem solving complaints. It also saved financial costs with the prevention and reduction of complaints by providing a response with the right information at the right time. The estimated savings range for this project for the previous year would be between 238.920.00 euros and 477.840.00 euros only for the investigation associated to complaints.
vii
Aplicação da metodologia Seis Sigma no tratamento das
reclamações dos clientes: Um caso de estudo na indústria
automóvel
RESUMO
Todos os dias bens são adquiridos. Infelizmente, esses bens por vezes não correspondem à eficiência esperada pelo cliente, o que origina reclamações. Por outro lado, depois da recuperação de uma reclamação o cliente pode ficar mais satisfeito e mais leal, do que se a reclamação não tivesse acontecido. Reclamações acontecem, apesar dos esforços das empresas em as reduzir. O objectivo desta tese é identificar as variáveis que influenciam o tratamento de reclamações dos clientes, através de um caso de estudo, e melhorar o processo de uma maneira sólida e repetível. Completar os objectivos pode culminar na possibilidade de aplicar os resultados a outros sistemas de tratamento de reclamações, principalmente na indústria automóvel.
A satisfação do cliente é vital para a organização, mas é um processo complexo, portanto as soluções não são óbvias. Seleccionando a metodologia Seis Sigma, é providenciada uma estrutura organizada de análise de problemas e sua resolução, de modo a melhorar o processo até um nível Sigma definido e melhorar a satisfação do cliente, que é vital para uma organização.
O problema demonstrado no caso de estudo acerca de tratamento de reclamações trata da rapidez e qualidade das respostas ao cliente e das investigações feitas. Nas indústrias, a tendência é focar mais na produção do que no serviço ao cliente.
O Seis Sigma mudou o papel de cada pessoa envolvida de modo a focalizar acções eficientes de resolução de problemas. Também permitiu poupar na prevenção de custos associados a reclamações recorrentes. A poupança estimada deste projecto para o ano anterior situa-se entre os 238.920.00 e os 477.840.00 euros.
PALAVRAS-CHAVE: Reclamação, Satisfação do cliente, 8D, Seis Sigma, Sistemas Integrados de Gestão Empresarial.
ix
TABLE OF CONTENTS
1. INTRODUCTION... 1
1.1. RESEARCH PURPOSE ... 1
1.2. MOTIVATION ... 2
1.3. GOALS AND DELIMITATIONS ... 4
1.4. THESIS ORGANISATION ... 4
2. RESEARCH METHODOLOGY ... 7
2.1. RESEARCH STRATEGY ... 7
2.2. DATA COLLECTION ... 8
2.2.1. SECONDARY AND PRIMARY DATA ... 8
2.2.2. DOCUMENTS ... 8
2.2.3. INTERVIEWS AND SURVEYS ... 9
2.3. RESEARCH APPROACH ... 10
3. THEORETICAL FRAME OF REFERENCE ... 13
3.1. CUSTOMER SERVICE AND COMPLAINTS ... 13
3.1.1. CUSTOMER SERVICE ... 15
3.1.2. CUSTOMER SERVICE IMPROVEMENT ... 17
3.2. THE 8D METHOD ... 19
3.2.1. STRUCTURE ... 20
3.2.2. STRENGTHS AND LIMITATIONS ... 20
3.3. SIX SIGMA METHODOLOGY ... 21
3.3.1. DEFINE ... 24
3.3.2. MEASURE ... 26
3.3.3. ANALYZE ... 27
3.3.4. IMPROVE ... 29
x
3.4. INTEGRATED MANAGEMENT SYSTEMS ... 30
3.4.1. ERP SYSTEMS ... 31
3.4.2. SAP R/3 PLATFORM ... 31
4. CASE STUDY ... 33
4.1. COMPANY BACKGROUND... 33
4.2. DEFINE ... 34
4.2.1. PROJECT PLANNING AND CHARTER ... 35
4.2.2. VOP ... 39
4.2.3. VOC ... 42
4.2.4. SIPOC DIAGRAM ... 45
4.2.5. TURTLE DIAGRAM ... 48
4.2.6. SWIM-LANE FLOWCHARTS ... 49
4.2.7. PROJECT DIFFICULTY AND IMPACT ... 51
4.3. MEASURE ... 52
4.3.1. DATA COLLECTION PLAN... 53
4.3.2. MEASUREMENT SYSTEM ANALYSIS ... 55
4.3.1. VARIATION ANALYSIS ... 57
4.3.2. SIGMA VALUE AND TARGET ... 57
4.4. ANALYZE ... 58
4.4.1. LISTING CAUSES ... 58
4.4.2. CORRELATION ANALYSIS ... 61
4.4.3. OTHER ANALYSIS ... 62
4.5. IMPROVE ... 62
4.5.1. MEASURING RIGHT IN THE RIGHT TIME ... 63
4.5.2. QUALITY IMPROVEMENT ... 65
xi
4.5.4. S AND C COMPLAINTS ... 67
4.5.5. B-SUPPLIER COMPLAINTS ... 68
4.5.6. B-PLANT COMPLAINTS ... 68
4.5.7. BECOMING WINNERS ... 69
4.5.8. TRAINING AND MOTIVATION ... 69
4.6. CONTROL ... 71
4.6.1. CONTROL ANALYSIS ... 72
4.6.2. PROBLEMS OCCURRED DURING THE CONTROL PHASE ... 73
4.6.3. COST ANALYSIS ... 74 5. CONCLUSIONS... 75 5.1. THESIS GENERALIZATION ... 76 5.2. FUTURE WORK ... 76 BIBLIOGRAPHY ... 79 APPENDIX ... 85
xiii
LIST OF FIGURES
Figure 1: Inductive and deductive approach. Adapted from: Decoo (1996). ... 11
Figure 2: Costs related to customer satisfaction and dissatisfaction. Adapted from Slack et al. (2001, p. 684) ... 15
Figure 3: Customer contact, focus and dis/satisfaction. Adapted from: Volkov et al. (2002). ... 18
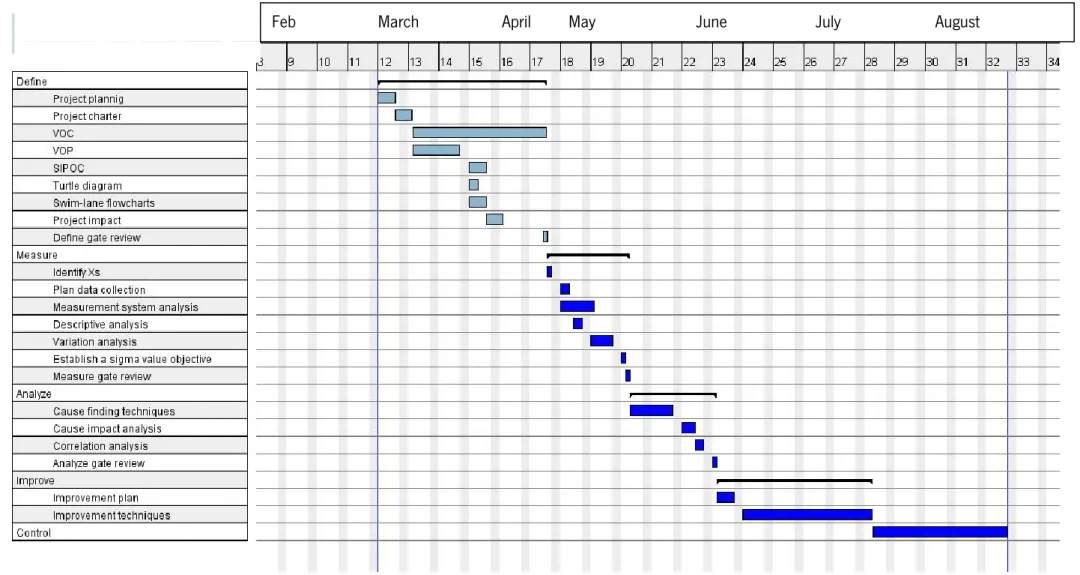
Figure 4: Gantt chart ... 36
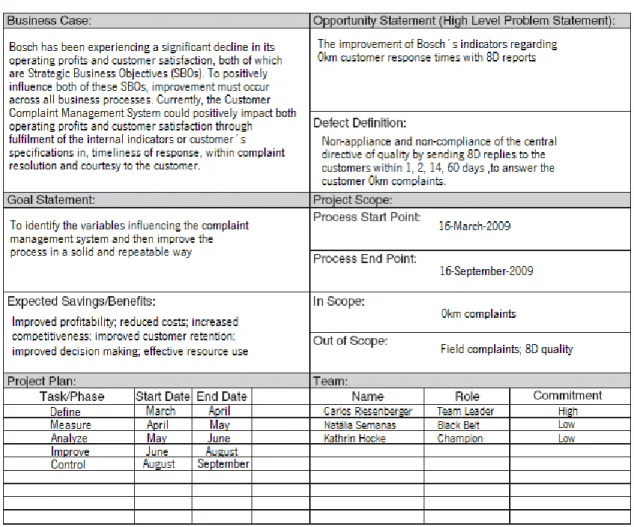
Figure 5: Project Charter ... 37
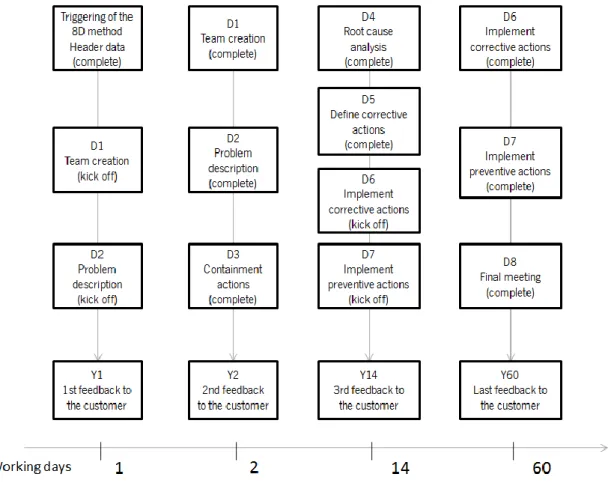
Figure 6: 8D timings according rules ... 39
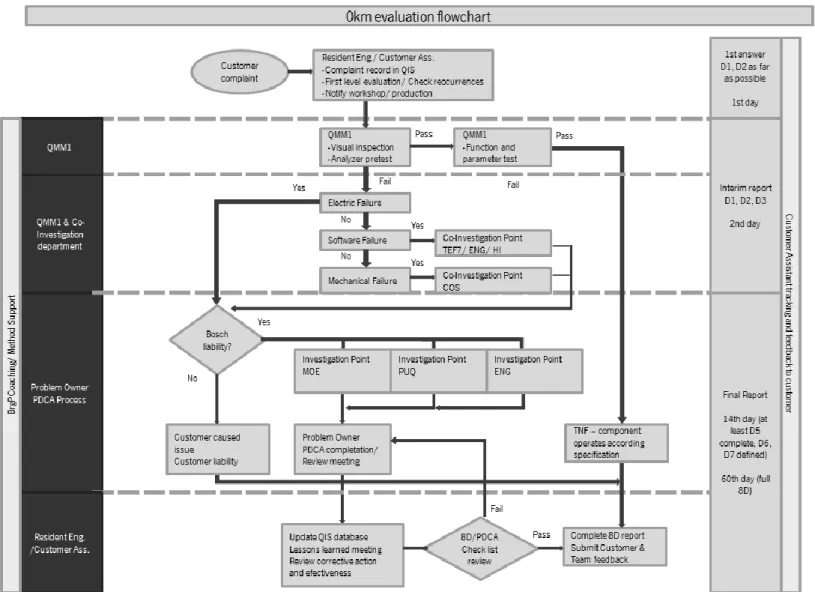
Figure 7: Complaint treatment process flowchart ... 41
Figure 8: VOC according response time and quality of 8D reports ... 43
Figure 9: SIPOC diagram ... 47
Figure 10: Turtle diagram for the complaint treatment process ... 48
Figure 11: Swim-Lane flowchart for the complaint types ... 50
Figure 12: Project difficulty and impact ... 51
Figure 13: Stratification plan for response time to complaints ... 54
Figure 14: Stratification plan for response quality to complaints ... 54
Figure 15: Data collection plan ... 55
Figure 16: Sigma level ... 57
Figure 17: Ishikawa diagram ... 60
Figure 18: Information system before and after improvements ... 64
1
1. INTRODUCTION
This chapter presents an introduction to the main subject by stating a research purpose for the thesis subject, the author’s motivation to approach the subject, the goals and delimitations, and it is also intended to give the reader an outline of the thesis contents.
1.1. RESEARCH PURPOSE
Customer satisfaction and dissatisfaction are relatively new areas of research, appearing in the early 1970s (Andreassen, 1999). Understanding that complaints are an important output of business, researchers are working in order to create a better fulfilment of the complaint treatment process. A definition of complaint treatment by Dee et al., (2004) is:
“A process that addresses issues that concern customers”
Other researchers have divided complaints handling into sub-processes for the complaints, prevention, receipt, settlement, research, and recovery of customers (Johnston, 2001). Other authors take a further look at management of complaints, defining it as:
“Fixing the policies, systems, or protocols so that the problem would not occur for future customers”
(Schumacher and Stichler, 2003)
Complaint satisfaction is also interesting within the complaints handling research, since to implement a system to handle complaints is no longer enough (Davidow, 2003). Such system must guarantee complaint satisfaction and customer retention (Stauss and Schoeler, 2004). A study made by Dingermans (1996) indicates that customers unsatisfied with complaint resolution tend to tell at least twice as many people comparing to customers satisfied with their complaint´s handling.
Etzel and Silverman (1981) define complaint satisfaction as the satisfaction of a complainant with a company´s response to his/her complaint. They call this phenomenon “complaint response satisfaction”; Blodgett and Granbois (1992) speak of “satisfaction with organisation complaint response”. Other researchers speak of “satisfaction with complaint resolution” (Andreassen, 1999), “redress satisfaction/dissatisfaction” (Dellande, 1995), “service recovery satisfaction” (de Ruyter
2
and Wetzels, 2000) or “complaint recovery” (McCollough et al., 2000). In all cases, the meaning is equal: complaint dis/satisfaction and relationship dis/satisfaction.
Transaction dis/satisfaction is the dis/satisfaction with a service or specific product acquired or consumed by a customer. If a customer complaints, a failed transaction has occurred. The customer evaluates the company´s reaction to her/his complaint in the current state of dissatisfaction with the transaction. It is also possible that the failed transaction occurs in an ongoing relationship. This implies that there is an overall evaluation of the relationship´s satisfaction, when the customer is confronted with a problematic transaction and the company´s recovery reaction. Thus, it can be assumed that the transaction´s dissatisfaction can have an impact on the updated relationship´s satisfaction (McCollough et al., 2000).
The problem of efficiency in complaint management systems in its development, structure and conception of successful complaint management systems that support the service to the customer is an important research field. In this perspective, a methodology is proposed to improve the customer complaint management systems. It is presented by a research and practical approach to allow coming to conclusions about appropriate complaint management systems, due to the customer complaints (McCollough et al., 2000).
1.2. MOTIVATION
Globalization in markets has obliged organisations to revaluate their competitiveness strategies in order to maintain the loyalty with customers (Bosch and Enriquez, 2005). This increased competitiveness within organisations made the customers more demanding and the need for focus on relationship marketing is becoming more solid than ever (Bosch and Enriquez, 2005). In the highly competitive market, it is more important than ever to be able to provide superior service quality in order to reach the top (Ndubisi, 2007). To face these new challenges, organisations must develop long-term relationships with their customers (Lee and Cunningham, 2001). In organisations, it is more and more common the interaction between the employee and the customer, which gives organisations the opportunity to make social bonds and to promote solid customer relationships (Stauss and Schoeler (2004). This leads into higher customer satisfaction with better customer service, loyalty increase, and to a competitive advantage (Stauss and Schoeler (2004).
3 The customer service complaint system is universal in physical distribution processes. It is unavoidable that even the most perfect of distribution systems will once have failures; it is equally unavoidable that from these failures will complaints arise. Only an active and systematic effort is capable to handle these complaints to satisfy the customer. The goal of this effort is to become part of the management’s kit of tools in making its quality system better and more responsive to the organisation’s (and its customers’) requirements (Boldgett et al., 1995).
The belief in customer´s satisfaction is no longer enough for making customers to stay; managers must adopt proactive strategies and continual improvement of services in order to build and keep a top competitive performance (Stauss and Schoeler (2004). In addition, delighting rather than just satisfying the customer has been found to be a motivator for a lifetime loyalty (Zairi, 2000).
In the automotive sector, the organisations are susceptible to the global competitiveness and the reduction of variability can not only be restrained to manufacturing processes, but it should be extended to other services, for example, to customer´s complaints (Zairi, 2000).
The interest in complaint management is the process by which complaints are handled and customers recovered. Zairi (2000) says that customer satisfaction is not a clear scenario, but much depends on the feedback, praise and complaints. In his work he talks about globalisation and how it turns the market so competitive that weaker organisations with substandard service quality and products will no longer compete in the future (Zairi, 2000).
Due to various internal and external factors, the quality and quickness of this process is not always reached, deviating from the pre-established objectives by the organisation, thus increasing the time response to prevent reoccurrence of non-conformities and decreasing customer´s satisfaction (Stauss and Schoeler (2004).
Due to crescent product variability and due to clients motivated by small productions, the need to guarantee a customer complaint treatment with less variability appears when a complaint rises (Ndubisi, 2007).
The Six Sigma methodology, which is one of the most structured methodologies that contribute for the organisation´s development to product and services improvement, wants to reach, in a profitable way, the complete customer requirement´s satisfaction (Wessel and Burcher, 2004). This methodology is well known in diverse business fields, because of the results and savings it provides.
4
It is praised due to its capability of incorporating main fields of problem management, problem contention, root cause analysis, corrective actions, and prevention actions. This methodology is important for quality and business professionals, engineers, and managers around organisations (Wessel and Burcher, 2004).
The Six Sigma methodology is line with the author´s self-motivation to analyze and reduce the deviation and variability of the customer complaint management system, whose satisfaction is vital for the survival of the organisation (Wessel and Burcher, 2004).
1.3. GOALS AND DELIMITATIONS
The purpose of this thesis is to identify the variables influencing complaint management systems and then improve the process in a solid and repeatable way, through research and verification in a case study. Fulfilling the purposes could culminate in the possibility to apply the results to other complaint management system in other organisations, especially in the automotive branch.
Customer satisfaction is vital for an organisation, but it is a complex process, therefore solutions are not obvious. The goal is to improve a complaint management system in order to provide an acceptable level of customer satisfaction.
It was considered to reduce the number of defects considered in the problem statement of the organisation´s complaint management system in order to improve the process.
The goal is to satisfy the customers by providing a good customer service through successful complaint management.
This master thesis not only considers improving the specific stated problem from the organisation, but it also considers the whole customer complaint management system and what is most important, customer satisfaction.
1.4. THESIS ORGANISATION
This thesis is organized into five chapters, throughout introduction, research methodology, theoretical frame of reference, case study demonstration and conclusions.
In chapter one, a research purpose was stated, as well as the author´s motivation, a small introduction to the case study, the goals for this project and the outline of this thesis.
5 In the second chapter, the research methodology chosen for this master thesis is presented, and an explanation for the research strategy is given, followed by a discussion about data collection and research approach.
In chapter three, a deeper theoretical knowledge about customer complaint systems, customer service, ERP systems, and the Six Sigma methodology are introduced. In this chapter, not only the used methodology is explained, but also the theoretical background for understanding the causes and possible solution figures are stated.
In the fourth chapter, the analysis and results from the implementation of the case study methodology are explained. This chapter presents the practical results from the use of the research methodology and their impact to the organisation.
In the fifth chapter, the main conclusions at the end of the project are stated and resumed in order to give the reader the final considerations that were taken when completing this project. This chapter provides information about the thesis generalization to other services and about future work to be done after concluding this project.
7
2. RESEARCH METHODOLOGY
The objective of this chapter is to present the research methodology chosen for this master thesis. Is first given an explanation for the research strategy, followed by the discussion of data collection, ending with the research approach.
Methodology is defined by Patel & Davidson (1994) as everything that is related with the activities involved in a research. The reader of the thesis should be able to evaluate the results by its reliability. Another definition made by Holme & Solvang (1991) states that everything which helps the researcher to come into a final solution for the problem and to obtain knowledge is considered to be methodology.
2.1. RESEARCH STRATEGY
To differentiate among researches, it is needed to identify the question for the specific research. Normal questions begin with:” who”, “what”, “where”, “how” and “why” (Yin, 1994). The research question for this thesis is:
“How do the input variables in the customer complaint process influence the chosen quality characteristics?”
When questions like “how” and “why” must be answered, case studies, experiments or histories are favoured research strategies (Yin, 1994). In order to use these strategies, it is required that the experiments are randomized and controlled by the researcher within a method that allows the influence from noise variables to be eliminated. These experiments must be possible to repeat with the same result. These are hard conditions to achieve outside a laboratory environment (Patel & Davidsson, 1994).
A case study strategy is to focus on data with few objects researched in many ways. These studies often contain historical data (Yin, 1994). A case can be made of an individual, a group, an organisation or a situation. Case studies sometime require the involvement of many different cases (Patel & Davidsson, 1994). The data collection in a case study can involve interviews, observations, and literature research. The weakness of a case study in research strategy is to make generalizations (Yin, 1994).
8
Research strategies can consist in literature researches, experiments and case study (Creswell, 2003). This project is be carried out as a case study, considering the complexity of the customer complaint management process, which cannot be fully understood with only experiments or by literature research. The numerous sources of information that would be used and the hardness to achieve a laboratory environment, also makes the case study a more appropriate strategy. This study adopts a grounded theory research approach and seeks to explore the customer complaint management system context, with the aim to build theory for further research.
2.2. DATA COLLECTION
The reason to collect data, regardless of how it is done and the quality of this data is to get relevant information regarding the research question (Patton, 2002). Documents, semi-structured interviews, and observations were the main sources used for data collection.
2.2.1. Secondary and primary data
To collect information the researcher can use, for example, existing documents, interviews, observations, and questionnaires. Existing documents are an example of secondary data, while the others are examples of primary data. Secondary data is already gathered by earlier researchers and it is made available through source search. Primary data is a method where the data has to be collected by the researcher. The most suitable method for the moment is chosen, so no method is better than the other. Material chosen to support ideas is as important as material in disagreement with these ideas. The purpose is to avoid a biased scenario of the studied event (Creswell, 2003). Both primary and secondary data have been used during this project’s improvement. Examples of primary data are the observations, experiments, and interviews conducted throughout the project. Internal reports and data automatically collected by a customer complaint monitoring system are examples of secondary data. Content analysis was also used to discover important patterns from the data. The analysis focused on customer complaint treatment failures. In an attempt to analyze the different perspectives and to facilitate explanations and comparisons, several secondary case studies of leading organisations were chosen from the literature and analyzed for the success elements in their customer complaint treatment efforts.
9 Easier and less expensive, secondary data is the data that first should be used. The collection of this data begins with a source search. One of the most important purposes with this type of collection is to give a background to the studied area and to perceive how earlier researchers have approached similar problems (Patton, 2002).
It is important to develop a unique and personal search approach that fits the researcher. Then, the researcher can also adapt the studied problem and method to its personal approach. There are several different sources that can be used to document information: Know-how of involved persons, articles, journals, and books, the internet. It is usually more economic to first use the know-how of involved persons and then the internet, articles, journals, and books (Patton, 2002). However, it is recommended to start by searching papers and bibliographies, so that the researcher can have a solid background with reliable data and certified methods, instead of using common and uncertified knowledge (Patton, 2002).
According to Patel & Davidsson (1994) and Yin (1991) the relevant documents for the research should be criticized with questions like:
• “What purpose did the author had about this document?” • “Under which circumstances was the document made?”
For this case study all sources for documents discussed above were researched. It was started to research the available articles, journals, and books on websites, then available data from the organisation, and finally the know-how of the persons involved in the organisation was used. To find electronic sources relevant for the customer complaint management process, 8D method, ERP systems, and Six Sigma methodology, some internet article WebPages, University document repositories and libraries were used to find bibliographies and relevant articles. Initially, the author had a wide search range approach, which was narrowed continuously throughout this project.
2.2.3. Interviews and surveys
Interviews can have different levels of standardization and structure. In interviews with a high level of standardization, the questions and their order are predetermined. If the interview has a low level of standardization, the interviewer can make the questions during the interview and chose their order. Level of structure means how much freedom the interviewed person has, in answering the questions. If the question only can be answered “yes” or “no”, it has a high level of structure. Interviews of
10
unstructured character and with low level of standardization are used if the researcher wants to do a qualitative analysis of the results (Patel & Davidsson (1994).
In the case study, the people involved in the customer complaint management system were interviewed first. Following the contact with key informants in the company, interview schedules were agreed on. All interviews were documented in written form. More than one appointment was needed to finish interviewing all subjects. Follow-up phone calls were also made to seek clarification or more information. All data taken from the main sources was consolidated and linked together to create a full scenario of the entire process. The purpose of these interviews was to get a deeper understanding of the problem, its causes, to know different opinions about the process, to get a necessary know-how of the process, to ensure accuracy of written data, and to enable a better collection and use of evidence. In a first part, these interviews were semi-structured and with a low level of standardization. This choice was made because of the complex nature of the process. It was required that interviewed persons answered a predefined group of questions in order to see if their know-how of the process and opinion about certain matters was the same. An individual interview with the customer assistants was conducted to evaluate the measurement system. The other part of the interview was approached with low level of standardization and low level of structure in order to get the maximum knowledge about the causes affecting the problem. A brainstorming was used together with this approach. A longer interview with the Head of the Quality Section responsible for the customer assistance was conducted. The purpose with this interview was to get a view of the current customer complaint management system and earlier improvement projects conducted.
2.3. RESEARCH APPROACH
Two ways to approach a research were considered: Hermeneutics and Positivism.
Hermeneutics strives for understanding, and Positivism describes and explains. Positivism believes in absolute knowledge and means that humans only have two sources for knowledge: our senses and the power of deduction. In this approach, critical analyzing must be used instead of speculating or trusting authorities or traditions (Patton, 2002).
Hermeneutics uses interpretations to understand other people’s behaviours to gain knowledge about something. These interpretations are influenced by the researchers own thoughts and believes (Creswell, 2003).
11 There are three ways to make conclusions for a positivist: through induction, deduction or a combination of these two, the hypothetic-deductive. An inductive approach is based on empirical studies and a deductive approach is based on logical thinking and deduction. If the researcher uses an inductive approach, theories are formulated from an empirical study. A deductive researcher makes, out of already established theories and principles, conclusions about a certain case. However, if the theory is empirical approved it’s a hypothetic-deductive approach (Patel & Davidsson, 1994). For a better understanding, see Figure 1.
Figure 1: Inductive and deductive approach. Adapted from: Decoo (1996).
This study is mainly based on a positivistic approach, because of the number of statistical tools used in the DMAIC process.
The most part of the theory concerning Six Sigma and the DMAIC improvement tool, have been collected in a deductive way. Some of the theories have been taken from existing researches, but the 8D method was much discovered from an inductive perspective, because it is a relatively recent subject in the various areas of research and theory was not enough to construct a solid knowledge of its application in practise.
13
3. THEORETICAL FRAME OF REFERENCE
This chapter presents the theoretical frame of reference to the reader. Theories about, customer complaint management systems, the 8D problem solving method, the Six Sigma methodology and integrated management systems are approached in this chapter.
3.1. CUSTOMER SERVICE AND COMPLAINTS
This section presents relevant theory about customer complaint management systems, the customer service and customer service improvements, in order to understand the process of a complaint. Deming (1986) realized that failures in services, and therefore complaints, are inevitable, because of the number of variables and perceptions involved in service transactions. He showed, through his cycle, that learning from customer´s feedback and mistakes were both key ingredients for achieving sustained profitability and true Total Quality Management (TQM). Zeithaml et al. (1993) wondered:
“If service companies normally get information from the customer about what is going wrong, why are so many companies not changing fast enough?”
Complaints are expensive, both as direct and indirect costs. However, for this price, companies can extract priceless knowledge, because complaints contain the direct VOC. One of the main steps of Quality Function Deployment (QFD) is “going to the gemba”. Bennett (1997) defines “gemba” as “a Japanese term that refers to the place where source information can be learned”. Therefore, “gemba” visits should be carefully planned to obtain the “real” VOC.
When a complaint arises, there has been such a large gap between expected and perceived basic needs, that the “gemba” has taken the initiative by contacting the company to make sure that its voice is completely understood. If complaints are transformed into knowledge about customers, they can provide a valuable amount of capital for enterprises (Bosch, 2005). To explore this capital, companies must design, build, operate and continuously upgrade systems for managing complaints. These systems are called Customer Complaint Management Systems (CCMS) (Bosch, 2005). Considering the value that customer complaints have, it could be expected that robust CCMS are being used successfully at many service companies. However, Tax et al. (1998) state that in general, organisations are not well informed on how to deal with either service failures or with the impact of
14
CCMS. Friman and Edvardsson (2003) describe three main factors that hinder the proliferation of CCMS:
• CCMS costs are visible and immediate, while their benefits are indirect and at a long-term; • Managers doubt customer honesty when voicing a complaint;
• Many unsatisfied customers do not complain: according to Maxham (2001), up to two-thirds of unsatisfied customers do not complain.
In addition, many organisations’ culture is that a complaint stands for failure and blame, so employees try to minimize or hide the occurrence of complaints.
Complaint managers and customer care managers face a strategic dilemma. On the one hand, there is an increasing understanding that complaint management is of strategic relevance, particularly because it has proved itself as an effective customer retention instrument (McCollough et al., 2000). On the other hand, the actual importance of complaint management within companies does not reflect this strategic relevance (Maxham, 2001). Most of the times complaint management and customer care departments are considered as operative units that only have to handle the customer dialogue, but are not involved in strategic planning processes. Besides, they are mainly seen as a cost factor and not as a potential source of profit. This perspective leads (especially in tough economic times) to a continuous pressure to reduce costs by cutting back its activities (De Ruyter and Wetzels, 2000).
Complaint managers can only escape this strategic dilemma by proving the contribution of complaint management to the company’s value creation. Thus, they are confronted with the task of proving the profitability of their domain. This is a huge challenge in practice, but also an immense challenge for academic research (McCollough et al., 2000).
Recent growing global competitiveness led to a rise in customer’s expectations (Maxham, 2001). To answer this competitiveness and keep a good financial performance, organisations must adapt more effective and efficient quality management systems in order to reduce response time and costs, while increasing quality (Schibrowsky. and Lapidus, 1994). From these systems, the outcome should be the continuous quality improvement of products and services, because when the objectives are reached, new objectives are established in which the already detected and corrected non-conformities do not appear again, triggering the cycle of a continuous improvement system. As Hallen and Latino (2003) showed in their case study of a chemical manufacturer,
15 complaint feedback can be used to identify root causes of problems that lead to customer
dissatisfaction. Furthermore, the results of the case study showed that eliminating root causes of problems improves customer satisfaction (Hallen and Latino, 2003).
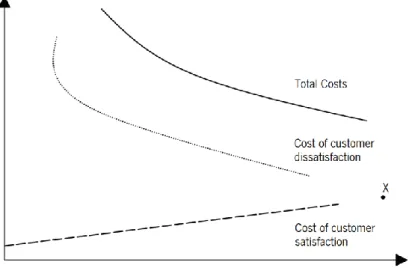
The total costs and the costs of customer dissatisfaction are expressed by the graphic in Figure 2.
Figure 2: Costs related to customer satisfaction and dissatisfaction. Adapted from Slack et al. (2001, p. 684)
The X point in the picture could illustrate the optimum cost between the two functions, if this point was the point of intersection between them. These two costs have a very strong relation. The cost to satisfy the customer normally contributes to lower the total complaint costs (Slack et al., 2001). The receipt of complaints is an excellent opportunity for an organisation to restore customer confidence and to capitalize on this feedback for assistance in organisational improvements (Dingemans, 1996; Johnston, 2001).
3.1.1. Customer service
Organisations who really understand and believe in the importance of good customer service take many benefits. Bad news travel faster and far than good ones. The damage caused by bad service can be almost incalculable; one single badly handled telephone call with an important customer can ruin years of marketing efforts (Bosch, 2005). The direct cost of handling and rectifying complaints, handling refunds, returns and legal actions, can be very high (Sheth et al., 1999). Viewed positively, within many organisations, differentiation by product has become nearly impossible, and value added by their service has become the prime means of gaining competitive advantage (Kim et al., 2003). Some organisations have realized this, placed good customer service at the top of their agenda for
16
many years, and collected the rewards in terms of continued growth and profitability. Some have recently made great advances in improving their customer service. Some have made some serious attempts to do so, with some considering results, while others have not done anything to make things better for them (Kim et al., 2003).
Frequently, the definition of "customer service" is too narrow. It is sometimes described as "customer care", and seen as little more than smiling at and being friendly to customers. But true customer service is far more comprehensive, and must involve virtually every aspect of the organisation's activities (Davidow, 2003).
Customer service process is part of the natural sequence of a transaction. Research into products is systematic and frequent, while research into service requirements of customers is rarely carried out. Money and effort can be wasted on aspects of low priority to customers, while highly-valued elements, some of which may be cheap or simple to provide, are ignored. Most organisations that do this find it immeasurably worthwhile, and also encounter many surprises in the results (Kolodinsky, 1995). Many customers get poor service because they do not know what is available to meet their requirements, or how to find out. Ignorance goes deeper than individual products (or services), and may influence the overall image of an industry or sector. Inevitably, this is bigger in new sectors or those in which technology or other factors are developing quick changes. Today, technological obsolescence is a problem for experts as much as for complaint and complaint processes (Kolodinsky, 1995).
For many customers, the period from order to delivery is the heart of the customer service problem. Delivery problems may arise from poor production control, or over-optimistic delivery promises, but the worst fear of all is the lack of information. The rail staff who tell surprised passengers nothing about the cause or purpose of a duration of a stoppage, or the supplier who does not contact the line manager whose production is at a standstill awaiting delayed delivery — all commit the same sin. But the supplier who is prepared to volunteer in order to give an explanation, an apology and a realistic promise has the chance of turning potential cataclysm into a golden opportunity for making friends and improving customer´s loyalty (Lee and Cunningham, 2001).
Unhelpful handling of complaints can be a major failure of customer service. Customers want to know how and to whom they should complain, and to be confident that their complaint will be handled
17 fairly, swiftly, and courteously. A Polite, quick, and reasoned rejection may be more acceptable than a delayed and contested acceptance (Michel, 2001).
Should the cause of complaint prove to be the misuse by the customer’s side, the supplier will have another gold opportunity to win lifelong loyalty by helping instead of throwing guilt to the unfortunate customer (Michel, 2001).
3.1.2. Customer service improvement
Good service requires specific skills, and notably of communication. Six elements that interact in a customer’s service improvement approach are:
• Survey; • Organisation; • Standard setting; • Communication; • Training; • Monitoring.
To carry out such approach, an individual or a team would be necessary, having the explicit authority and active support of top management. Many organisations find the involvement of a consultant helpful, although implementation must always lie within the organisation and its staff (Michel, 2001). No worthwhile improvement program can get far unless it is based on knowledge of what service customers are currently getting from the organisation and from their competitors, and what do they actually want. Without this knowledge, it is possible to misallocate resources whilst failing to meet essential needs. Intuition and guesswork can lead to bad conclusions; even if the beliefs held were correct at some point in the past, needs and standards change. Existing and potential customers' views of service would need survey by the most appropriate techniques: email, telephone, face-to-face survey, or a combination of the three (Michel, 2001).
Much information is available within the organisations, although when using this information, it would be necessary to distinguish between opinions, facts, and prejudices. A particularly valuable resource, if it is available, would be the analysis of complaints. Information from the front-line staff is likely to be especially helpful; their contribution may, sometimes be clearer and frankly more revealed in a
18
discussion with a third party such as a consultant, rather than with their managers. Information about services provided by the competitors may be obtained directly, through the survey of company’s customers, through field staff, and through trade contacts (Miller et al., 2000).
Standards of customer service need definition. Wherever practicable, they can benefit from being measurable, although this may prove to be difficult in some areas (Miller et al., 2000).
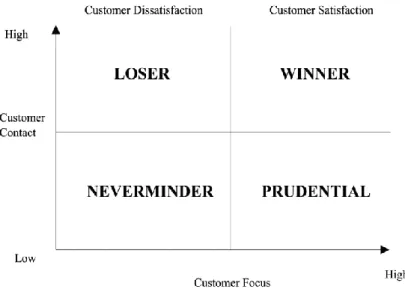
Existing customers would be delighted to hear what is being done to meet their needs (Miller et al., 2000). In Figure 3: Customer contact, focus and dis/satisfaction it is represented the interaction between customer focus and customer interaction.
Figure 3: Customer contact, focus and dis/satisfaction. Adapted from: Volkov et al. (2002).
What is observed in Figure 3: Customer contact, focus and dis/satisfaction is that the winner would be the organisation who would answer right in the right time. There may be a benefit in many forms of communication with the customers (Volkov et al., 2002).
It is virtually certain that a customer service survey would demonstrate the need for staff training in many areas in many organisations. Complaint resolution techniques, IT knowledge, document writing, and face-to-face contacts are examples of areas inside the customer service level that could be improved (Volkov et al., 2002).
Changes would also call for continuous monitoring against the standards set. As knowledge is accumulated, standards may be reconsidered and improved procedures or training may be adopted. After a period of time, a further customer service survey would become necessary, and the cycle
19 could be reproduced, as part of a continuing improvement process in customer service excellence (Volkov et al., 2002).
3.2. THE 8D METHOD
Team oriented problem-solving method (TOPS), using eight disciplines - 8D (also known as TOPS 8D, Global 8D or Ford 8D) is recognised as one of the seven key quality tools within the Ford EQIP training schedule (Ford Motor Company, 1994). The 8D consists in teams working together in order to solve problems, using a structured 8 step approach to help focus on facts, instead of opinions. It is a method used to identify, correct and eliminate the reoccurrence of quality problems. It is applied both in products and process improvements. Team synergy emphases this method. The know-how and energy of many qualified people is believed to be better and smarter than the sum quality of the individuals. The origin of this method remotes the Second World War, where the U.S. Government first used an 8D-like process, naming it as the Military Standard 1520 (corrective action and disposition system for nonconforming material) (Al-Mashari et al., 2005).
The 8Ds were first introduced in industry at 1987 by Ford Motor Company in a manual titled “Team Oriented Problem Solving” (TOPS). Ford developed this methodology called Global 8D, to facilitate standardize reporting, maintain a searchable repository of problem-solving efforts, and enhance team collaboration. This course was applied by the request of the senior management of an automaker's organisation, which was facing growing difficulties over the fact that the same problems were reoccurring year by year. Although other problem-solving methods were available, a need for a data-based problem-solving methodology was still present (Al-Mashari et al., 2005).
The focus was to merge this approach into a team environment. Teams would be cross-functional and be formed by members from both manufacturing organisations and design engineering. Since the first publication of TOPS, the course manual has been translated to many languages and used mainly by Ford Motor Company as "Global 8D". Ford's other divisions quickly began implementing the 8D, which became a problem-solving methodology required for Ford suppliers. Several companies, including Motorola, General Electric and Navistar have licensed Ford´s course and use it as a problem-solving process of their own (Al-Mashari et al., 2005).
20
3.2.1. Structure
8D has become a standard in Auto, Assembly and other industries that need a thorough structured problem-solving method. This problem-solving process has also migrated to other manufacturing organisations as managers have switched jobs outside of automotive. The 8D process has been employed recently extensively outside the auto industry. As part of Lean initiatives, it is used within Food Manufacturing, High Tech and Health Care industries. The 8D are divided into eight steps. Each one is part of the problem-solving process (Rambaud, 2006):
• D1 stands for defining the problem-solving team; • D2 is the analysis of the problem;
• D3 requires the containment actions;
• D4 is about finding the root cause for the problem; • D5 is defining the corrective actions;
• D6 is implementing the corrective actions; • D7 is about the prevention of the problem;
• D8 is the final step, used normally for congratulating the team.
Many common disciplines involved in the "8D" process can be found in various books and articles used by Quality Assurance professionals. For example, an "Is/Is Not" worksheet is commonly done at D2, and a "Fishbone Diagram" or "5 Why Analysis" are much used at D4 step (Rambaud, 2006).
3.2.2. Strengths and limitations
8D method is effective in developing proper actions in order to eliminate root causes and in implementing the permanent corrective actions to eliminate the root causes. It also contributes to explore the system of control that allowed the escape of the problem. This escape point is studied for the objective of improving the ability of detection by the system of control, when and if it should occur again. This prevention loop explores the systems that allowed the failure and cause mechanism to appear in the first place. In order for the 8Ds to be most effective, there were made many
21 assumptions. It was assumed that organisations would be familiar with the use of basic quality tools (Rambaud, 2006).
The 8Ds have their most success in dealing with chronic recurring problems, mainly defects or warranty issues. As a whole, the 8D were never intended to replace a systemic quality system. The 8Ds' objective was to face the problems and discover the weaknesses in the management systems that permitted the problem to occur in the first place. Other systemic overall quality initiatives, such as Six Sigma, are still required, because for many manufacturing organisations, routine problem solving will not improve the product and/or process (Rambaud, 2006).
According to Rambaud (2006), the biggest abuse in the implementation of the 8D involves using the method solely as a one-page problem-reporting effort. This misuse is often further exaggerated by requiring the report to be written within 24 hours. Some steps can take a few hours, while others can take weeks. In manufacturing, many chronic problems can occur only with a unique set of conditions. Sometimes they will be present, other times will not. Extensive studies and experiments have to be conducted in order to understand the root causes. Rambaud (2006) also states that 8D reporting can be time consuming and difficult to develop and that in order to successfully implement the 8D methodology the persons involved should receive an appropriate training.
3.3. SIX SIGMA METHODOLOGY
Six Sigma is one of the most structured methodologies that contribute for the organisation’s development to product improvement and processes. It wants to reach, in a profitable way, the complete customer requirement’s satisfaction (Wessel and Burcher, 2004). It defines the standard deviation of a normal distributed case positioned at or beyond 99.998% level on the X-axis of the normal distribution curve. A process is at a Six Sigma level when the result is only 3.4 defects within a million opportunities (Pande et.al, 2000).
Some researchers have divided Six Sigma into three generations. The first comprehended a period of 8 years (1987-1994) with a focus on reduction of defects. The second generation lasted from 1994 to 2000 and the objective was the reduction of costs. The third generation’s objective was to create value to the enterprise and to its customers. This generation reveals the concept of the Six Sigma White Belt. This third generation also aims to the commercial and service business processes,
22
and transactional systems quality. This integrates service delivery times, customer waiting time in order to receive services, inventory service levels and others (Pande et.al, 2000).
Although Six Sigma was first introduced in manufacturing, it has expanded itself into other departments within industries and services (Pandey, 2007) and has created new opportunities of improvement inside organisations (Sanders and Hild, 2000).
Each Six Sigma project begins by forming the team, who listens to the customer’s needs. The team measures how these needs are being fulfilled, and then analyzes the variables that directly contribute to the customer’s satisfaction. After that, they work on how to improve the process and then how to control it. These steps, since definition until control of the process are called DMAIC Pandey, A. (2007).
Six Sigma is driven by close knowledge of customer needs, data, statistical analysis, and disciplined use of facts. Six Sigma is a methodology used to improving business processes. An organisation can achieve various types of “business success”, because Six Sigma benefits are wide. This methodology not only shows the current state of a process including effectiveness and efficiency, but points towards an alignment with the organisation’s strategy (Sanders and Hild, 2000). “Business success” with Six Sigma can be manifested by different ways:
• Reduction of defects; • Culture change; • Reduction of costs; • Productivity improvement; • Customer loyalty; • Service development.
One of the success factors to achieve the business objectives is the human interaction, with teamwork, culture change, and motivation. Other factor is because it is oriented to the process by process analysis, and process improvement. Another important characteristic of this methodology is the use of both statistical and non-statistical tools within a problem-solving process (DMAIC). This methodology also creates a powerful team structure (Champions, Master Black Belts, Black Belts, Green Belts and White Belts) for the creation of projects (Pandey, A. 2007).
23 A Champion is responsible for coordinating a business quest in order to achieve Six Sigma. A Master Black Belt is a mentor, trainer, guide, and coach of Black Belts and others in the organisation. A Black Belt is a leader in implementing Six Sigma on projects and helps the teams achieve their objectives. The Green Belts deliver successful implementation of the Six Sigma methodology and tools, on projects. The White Belts participate in the project’s teams and support the objectives of the project, typically in the context of their current responsibilities. The main difference between a White Belt and the other higher ranks is that the White Belt focuses on departmental problems instead of interdepartmental problems (Sanders and Hild, 2000).
Six Sigma follows a process called DMAIC, which is the core component of the methodology. DMAIC is the baseline of the Six Sigma methodology and a way to improve process. It is structured by five different steps:
• Define (the high-level project goals and process);
• Measure (the key aspects of the process and collect the relevant data to the project); • Analyze (the data to verify cause-and-effect relationships);
• Improve (the process using improvement tools); • Control (the process in order to prevent more defects).
DMAIC is a structured problem-solving process widely used in business as part of the Six Sigma methodology. These phases lead a team from defining a problem through implementing solutions linked to underlying causes, and establishing best practices to make sure the solutions stay in place (Pande et.al, 2000).
The team should follow all of DMAIC in complex problems, because the causes and solutions are not obvious. To get at the root of a complex problem, people from different areas of knowledge or experience have to be gathered. If it is a simple problem, often an experienced person can gather and analyze data and find a solution without going through all DMAIC steps. DMAIC should also be used if the risks of implementation are high, even if the solution might be obvious (Coronado and Antony 2002).
24
3.3.1. Define
The first step in DMAIC is used in order to set the objectives and goals to reach, as well as the range of the project, the team, and the entire problem in cause. It has to assured that it has to be kept an updated project charter including the following points (Pande et.al, 2000):
• The problem statement;
• Description of the team and the stakeholders;
• A high-level project plan with the required milestones;
• The goal statement, clearly identifying the key output metric to be improved; • The verification of project scope;
• A more detailed schedule of activities.
Six Sigma uses quality tools in order to gather information about the problem and to build a successful project plan from the beginning. Some examples of tools are (Pande et.al, 2000):
• Kano analysis;
• SIPOC (Supplier-Input-Process-Output-Customer); • Process mapping;
• Swim-Lane flowcharts.
The purpose of a Kano analysis is to better understand what value the customers place on the features of the product or service, which can reduce the risk of providing products or services that over-emphasize features of little importance or that miss critical-to-quality features/attributes. It is a good “first cut” technique to evaluate relative importance of customer requirements. It also allows the team to identify segments by the type or level of quality that customers expect. It helps determine if there are requirements that were not explicitly stated by customers or that were included in previous offerings and are still valued by the customer. It also works out to integrate the team’s VOC data gathering plans (Jacobs, 1999).
In order to fill a Kano analysis, the team must collect all the VOC data through the many different means, identify known or presumed customer requirements, and for each potential need the customer must be asked how would they feel if the need was addressed and how would they feel if it wasn´t. The customer is given four choices (Jacobs, 1999):
25 1) I would like it;
2) It is normally that way (the feature is expected); 3) I do not care;
4) I would not like it.
Based on the customer’s responses, the team shall clarify each need as a dissatisfier, satisfier or delighter as it is represented in Appendix A.
The team must deal with the basic requirements (dissatisfiers) that the service does not already deliver. If the team fails to perform a good job on fulfilling these requirements, it does not matter how well the team performs on other features or options (Jacobs, 1999).
A high-level process map can be usually represented by a SIPOC diagram. SIPOC is a tool which captures critical information to a project. It helps the team and its sponsor agree on the project boundaries and scope and it also helps to identify process inputs which match outputs of the upstream process and inputs of downstream processes (Pande et.al, 2000).
The process mapping is used to visually document a process. The team shall arrange the steps in order, combine similar ideas, and determine and maintain a consistency level of detail as the team goes on. In order to observe a process, the team should (Pande et.al, 2000):
1) Clarify the purpose of the observation; 2) Prepare an observation form;
3) Prepare staff in the workplace;
4) Walk the process; carry out the observation plans;
5) Have observers summarize lessons learned and present them to the whole team.
The team should strive for a level of detail that is useful to the project, no more, no less. Too much detail will result in an oversized flowchart and too less will make it useless (Pande et.al, 2000). A Swim-Lane flowchart emphasizes the “who” in “who does what”. It is especially useful with service processes, and it also makes it easy to study handoffs between people and/or work groups in a process (Rummler and Brache, 1990).
In order to create the flowchart, the team must identify the different people or job functions involved in the process, listing them in the left side. The collection of data to create this flowchart can be done
26
via brainstorming. The team should be looking for reasons behind repeated handoffs back and forth between individuals or work functions, in order to combine work so that one person can complete all their tasks in one time (Rummler and Brache, 1990).
3.3.2. Measure
The purpose of measuring is to thoroughly understand the current state of the process and to collect reliable data on process speed, quality, and costs that the team will use to expose the hidden causes of the problems. It is the data collected that will point the direction of the project. The expression “what you measure is what you improve” is often used to describe this step (Pandey, A. 2007). The final result will be upon the measurements made initially in this phase. In order to be successful in completing this step, the team should:
• Create a data collection plan including operational definitions for all measures; • Measure the outputs, inputs and process variables relevant to the project; • Use measurement system analysis to ensure accurate, consistent, reliable data;
These data collection tools can facilitate a team´s data collection process in order to later apply statistical tools in the “Analyze” step (Pande et.al, 2000).
Continuous data is made by any variable measured on a continuum or scale that can be infinitely divided, while attribute data is made all types of data other than continuous (Sanders and Hild, 2000).
In a process, there are input data and output data. Input data measures speed quality and cost performance of items or information coming into a process. Normally, input data focus on effectiveness, and output data quantify the overall performance of the process. The following questions were asked as criteria for choosing the appropriate metrics (Sanders and Hild, 2000):
• Do metrics tell you what you would really like to know? • Do metrics adequately represent customer experience?
A good collection plan helps ensuring that data will be useful (measuring the right things) and statistically valid (measuring things right). The team has to decide which data is going to collect, the stratification factors, and who will collect it. The following questions are made in order to describe the data collection procedure (Pande et.al, 2000):
27 • What steps should data collectors use?
• How should they take the measurements? • What tools will be used for this?
• How will data be recorded? In which units?
People involved in these questions and people from other groups should have similar answers to these questions, so the measurement description is refined until consistent results are achieved (Pande et.al, 2000). Using existent data lets the team use the archived data or current measures to learn about the output, process or input. New data means recording new observations. The use of current data is cheaper and quicker than gathering new data, but cautions must be taken in consideration like (Wessel and Burcher, 2004):
• Data must be in a form that one can use;
• It has to be relatively recent with the same conditions as when they were collected;
• The collector should be confident that data collected was consistent with the operational definitions;
• They must be truly representatives of the measurement system; • There should be enough data to make the conclusions valid.
The team has to measure true data if they want true results, because being committed to the truth is more powerful than any technique (Wessel and Burcher, 2004).
3.3.3. Analyze
The objective of this step is to find out when and where the defects occur. It is very important to determine the relations between the cause factors and variables in order to understand and correct a problem. This step allows pinpointing and verifying causes affecting the key input and output variables tied to project goals (finding the critical Xs) (Pande et.al, 2000). This step may involve:
• A value analysis;
• Calculating process´s cycle efficiency; • Analyzing the process flow and constrains. • Analyzing data collected in the “Measure” step;
• Generating theories to explain potential causes and narrowing the search for potential causes;
28
• Collecting additional data to verify root causes.
To narrow the search for root causes and significant cause-and-effect relationships, some useful tools can be used. These tools can be (Pande et.al, 2000):
• Variation analysis; • Ishikawa diagrams; • The “Five Whys”; • Regression;
The purpose on using Control Charts is to distinguish special cause from common cause variation. It was also used to detect trends and patterns in data that provided clues about the sources of variation (with the ultimate goal of reducing or eliminating those sources). Variation is the term applied to any differences that occur in the production, services, and processes. There are two types of variation (Pande et.al, 2000):
• Common cause. This is the variation due to random shifts in factors that are always present in the process.
• Special cause. This variation is above and beyond common cause variation, arising from factors that are not always present in the process
Every process has common cause variation. One that has also special cause variation is called “a process out of control”. When a process has any special cause variation, the idea is to track down that variation and eliminate the specific, assignable root causes (Pande et.al, 2000).
Ishikawa diagrams demonstrate the causes of a certain event. Causes are usually grouped into main categories, which include (Ishikawa, 1990):
• People: Anyone who is involved with the process;
• Methods: How the process is performed and the specific requirements for doing it; • Machines: Any equipment required to make the process;
• Materials: Raw materials used to produce the final product;
• Measurements: Data generated from the process, which are used to evaluate its quality; • Environment: The conditions in which the process operates.
29 The “5 Whys” method takes a cause (for example from an Ishikawa diagram) and asks several times the question: “Why has it occurred?”. This has to be continued until a potential root cause is found. These questions have nothing to do with the number five. Sometimes the root cause is found after two or three questions, while other times it continues through more than five (Bodek, 1988).
3.3.4. Improve
To improve a process is to change it making improvements and optimizations. This step focus on the week points of a process in order to execute a successful implementation considering the measures and analysis made, assuring that the defects are reduced (Sanders and Hild, 2000). In order to achieve success in this step, some of the key procedures were identified by some researchers (Pande et.al, 2000):
• Develop potential solutions;
• Evaluate, select, and optimize best solutions; • Develop and implement pilot solution; • Attainment of project goals;
• Develop and execute a full-scale implementation plan.
The team should flesh out the solution ideas, develop criteria, and evaluate the alternatives. The results should be documented. They have to be open in changing or combining options to optimize the final selections. If necessary, they can also perform designed experiments to find optimal settings for combinations of factors (Sanders and Hild, 2000).
Some of the tools used in this step are statistical, while others are not. The main idea is to use the appropriate improvement way for each case, because problems are not always equal or are not solved by the same way (Pande et.al, 2000).
3.3.5. Control
“Control” is the last step within the DMAIC process. It guarantees that the improved process is within the specification limits. It eliminates the defect creation, and serves a detection method in case any defect appears (Pande et.al, 2000).
30
This step is aimed to ensure the institutionalization of the improvements made. The process capability shall be ensured throughout three steps:
• Outlining the predictive impact of each counter measure;
• Deciding the modus operandi on the implementation of counter measures; • Defining the controlling process.
The results should be documented by control charts, capability analysis, and other data displays showing that the realized gains are in line with the project charter. Also, the procedures for locking gains should be established and documented, in order to monitor process performance and continued effectiveness of the solution. Lessons learned should be realized as much as the opportunities to use the improvement methods from this project into others (Pande et.al, 2000).
3.4. INTEGRATED MANAGEMENT SYSTEMS
The new technologies in the information systems brought new opportunities for the organisations to restructure themselves. Since the publication of Hammer and Champy´s book, the use of IT has been considered by organisations as one of the essential factors to the enterprise´s success. Davenport et al., (2003) does a further investigation and demonstrates another point of view in his book. Information technology (IT) has performed a decisive role, since the ground floor, by the means of the automation of processes. Nevertheless, the great revolution was revealed in the last decade demonstrating that the simple use of informatics resources did not guaranteed the success of an enterprise. This problem would occur by the means of two main causes:
• The indiscriminate automation of industrial processes, without seeing if these processes were or not the most adequate to the company’s survival in the global market;
• The proliferation of systems who do not communicate between themselves.
The first problem was raised by Hammer and Champy (1993), who said that if something which does not work is automated, it will result in the production of problems at an even higher speed. This problem is avoided by the introduction of an IT system, preceded by deep changes in the organisation. The second problem can be also restrained by the possibility of using integrated management systems that can integrate all the organisation’s areas, opening possibilities to the transfer and exchange of information between the different sectors of an organisation (Davenport et al., 2003).